COST-EFFECTIVE ANALYSIS OF TRAFFIC
EMISSION CONTROL: TARGETING
STRATEGIES UNDER UNCERTAINTY
NERHAGEN, Lena - VTI, Borlänge, Sweden
LI, Chuan-Zhong - Uppsala University, Uppsala, Sweden.
ABSTRACT
Emissions from traffic impose negative effects on human health, and recent evidence indicates that particulate matters (PM) are the detrimental air pollutant that causes most life years lost. To improve the efficiency of resource allocation, various mitigation measures have been proposed for reducing these emissions. However, whether or not the policy instruments are welfare improving, and if yes, how much more efficient they can be remain to be studied. To answer the questions, we need to both assess the economic cost of emission control and the health benefit due to the reduced PM emission by all proposed control instruments. This paper focuses on the cost efficiency for reaching pre-determined emission targets. We are concerned with reducing the concentrations of PM in Stockholm by local policy measures. Contrary to other cost-efficiency studies we have in this study included adaptations in behaviour in addition to the conventional technical measures alone.
Since there are different emissions of PM, targeting PM10 may not be a good indicator of the health benefits. We therefore compare the performance of targeting PM and of targeting years of life lost (YOLL) and found interesting differences. We find that if the ultimate objective is to save lives or say life-years, it should be more appropriate to target YOLL, provided that YOLL can be properly predicted. Moreover, since the collected data on the effectiveness and cost of the policy instruments involve large uncertainty, we have employed a stochastic control model to explore the implications of the degree of uncertainty. We find that the higher fulfilment probability, the larger the marginal cost as expected. Also, for a given fulfilment probability, the more uncertain we are about the true effectiveness parameters, the larger the marginal costs.
Keys-words: emission control, cost-effective analysis, human health, uncertainty, stochastic control
INTRODUCTION
It has been long recognized that emissions from traffic impose negative effects on human health, and recent evidence indicates that particulate matters (PM) are the detrimental air pollutant that causes most life years lost (WHO, 2006). Since the negative effects are not priced in the marketplace, transport-related resource allocation may be distorted, resulting in human welfare loss. The problem is more serious in densely populated urban areas due to the increased number of inhabitants exposed to the pollutant. To improve the efficiency of resource allocation, various mitigation measures have been proposed for reducing PM emissions from traffic. These include policy instruments ranging from general emission control legislation to detailed local air quality objectives. One such example is the Stockholm trial where rush hour road pricing was implemented, resulting in reduced traffic in the city and thereby lower emissions and concentration levels.
However, whether or not the policy instruments are welfare improving, and if yes, how much more efficient they can be remain to be studied. To answer the questions, we need to both assess the economic cost of emission control and the health benefit due to the reduced PM emission by all proposed control instruments. We are concerned with the expected reduction of concentrations of PM10 in Stockholm by local policy measures that are discussed as a means to achieve the air quality limit values1. In a related project (see Nerhagen et al., 2008) the emissions and health impacts from different emissions sources where studied. The results revealed that traffic in Stockholm was the main source for high concentrations of PM10, especially at street level in spring time due to the dispersion of road dust, but also for causing premature mortality but this instead was mainly due to exhaust PM. Since congestion charging is one measure that would reduce both these emissions, we have in this study included adaptations in behaviour in addition to the conventional technical measures alone.
Cost-efficiency analysis is a commonly used method in the area of environmental policy studies. It is for example the method used in the GAINS-model developed by the International Institute for Applied System Analysis (IIASA). The GAINS-model is often used for scenario analysis of international policy appraisals such as the Clean Air for Europe (CAFE) program and the Emission Ceiling Directive of the European Union (the so called NEC directive). In a Swedish context cost-efficiency analysis has been used to evaluate the effects of the charge on nitrogen oxides being introduced in 1992 (Höglund, 2005) but also to assess how the national environmental objectives can be achieved in a cost-efficient way (Li and Budh, 2008). It has also been applied in recent Swedish policy work related to climate policy (Swedish Energy Agency and Swedish Environmental Protection Agency, 2007).
1 Environmental quality standards are a type of legally binding policy instrument introduced by the Swedish Environmental Code of 1999. For air quality the standards adhere to the EU air quality limit values and for PM they have been based on measurement of PM10 (particulate matter with an aerodynamic diameter of 10 µm or less). If the standards are exceeded, as in the case of Stockholm, action programs have to be implemented. In Stockholm the main contribution from local emission sources to PM10 concentrations is road wear. Tail-pipe emissions of PM are of a smaller size, hence a new standard targeting PM2.5 is underway.
However, although simple to use mathematically, there are a number of issues related to the use of this method in policy analysis that we will explore in this paper. The first issue concerns the data quality for this type of analysis. To obtain data on the effectiveness and the associated cost is both time consuming and costly and the information requested is in many cases considered to be sensitive business information. Hence, a systematic approach is needed on how to collect the data. In Sweden a recent research project investigated how this could be done but to our knowledge this project did not end up in any actual implementation (Ribbenhed et al., 2005). One possible explanation for this is the lack of interest for this type of information from relevant authorities. Although Swedish authorities by law are required to undertake economic assessments of environmental policies it has been found that this is an area in need of improvement. Two recent policy evaluations in the air pollution area have not undertaken a comprehensive economic analysis since the costs and efficiency or benefits have been discussed but not quantified in monetary terms (County board of Stockholm County, 2004; Swedish National Road Administration, 2007).
There have also been discussions in the literature on the possibility to collect relevant data. In most papers and reports there is criticism against the engineering data commonly used (Hartman et al., 1997; Höglund, 2005; Li and Budh, 2008). Höglund (2005) for example discusses that most analyses are based on assumed costs and efficiencies for different abatement techniques and that this does not take full account of the firms’ abatement cost behaviour. In her analysis she finds that there seem to abatement measures that can be undertaken at zero or very low cost, supporting the hypothesis of "low-hanging fruits". This hypothesis states that due to organizational inefficiencies there are cost-effective abatement measures that are not undertaken. The introduction of a policy measure such as a regulation encourages the firms to reduce such inefficiencies thereby revealing the benefits of undertaking certain abatement measures. Another problem concerns what data that it is relevant to include. Li and Budh (2008) and also a number of recent Swedish reports touch upon this issue. Li and Budh (2008) for example make a note that only financial costs are included in their data and that so called social costs such as time and comfort are excluded. Sternhufvud et al. (2006) discusses this problem more explicitly and they make a distinction between technical and non-technical measures where non-technical measures are related to some change in the production or consumption process. According to their definition non-technical measures can be divided into three kinds: efficiency (less use of input), substitution (using another input) or demand (change in behavior).
That this distinction is important when comparing abatement cost estimates from different studies is discussed in Särnholm and Gode (2007). It is stated that their results cannot be directly compared to a previous study by Särnholm (2005) since the former included both efficiency and fuel-shift measures while the latter only considered fuel-shift measures. Särnholm and Gode (2007) also discuss the problem of data collection in general and the problem of generalization of results from a case study such as theirs to national estimates and potentials. They also discuss the problems they had of receiving reliable data from transport companies. Hence, what the literature show is that there are great uncertainties related to these types of data and that the outcome of the analysis will be heavily dependent on the assumptions in each study.
Because of the problems on the identification, definition and grouping of policy measures as well as the various value assessment difficulties, we are certain that the collected data available for cost-efficiency analysis are rather uncertain. Thus, in this paper, we will also take into account the effect of uncertainties in our cost-efficiency analysis. In particular, we will examine the effect of different target setting strategies and evaluate their consequences. Moreover, we also perform cost-effective analyses in a stochastic control framework.
The remaining part of the paper is structured as follows: Section 2 provides a brief description of the data used for cost-efficiency analyses including proposed policy instruments, their effectiveness and associated costs. Section 3 describes the deterministic and the stochastic models and defines the marginal cost with alternative targeting strategies. Section 4 describes the various setting and report the results of our analyses, and section 5 sums up the study.
DATA
Several different sources contribute to the PM concentrations in Greater Stockholm region. According to the emission inventory of the Stockholm and Uppsala Air Quality Management Association (Johansson and Eneroth, 2007), about 2909 tonnes of PM10 were emitted in the Great Stockholm area during 2003, whereof about 70% was from road traffic, and 25% from power plants and residential heating. To reduce the emission level, several policy measures have been proposed on the basis that they have been discussed in the abatement plans regarding air quality that have been developed for Oslo and Stockholm, two cities where PM-emissions from road wear are a problem causing exceedances of EU's air quality limit values (Oslo Kommune, 2004; County board of Stockholm County, 2004).
The data on abatement measures, their effectiveness and associated costs that were compiled in the TESS project (cf. Nerhagen et al, 2008 and Nerhagen and Li, 2008), are summarized in Table 1. As shown in the table, there are 12 emission control measures, from "Street cleaning inner city" to "Residential heating (GSHP/DH)2". Some of the measures are technical and others are behavioural adaptation related ones, and some may belong to belong to both categories, as indicated in column 3. Column 4 is the cost (in 1000 sek) associated with the measures for a complete adoption/compliance. For the measure "Vehicle change LDV", for example, the cost is negative, meaning that the measure is a cost-saving one even without health and environmental concerns. The reason is that this measure is based on a shift to a car that is of the same brand but more fuel efficient. In this case we have not accounted for the possible quality reduction that drivers could perceive from having a less powerful engine.
Table 1: Policy instruments, effectiveness and costs
No Measures Category Cost
(1000 SEK)
PM10 reduction (tonne)
YOLL reduction (life years)
1 Street cleaning inner city Technical 600 0 0.221 2 Street cleaning all C streets Technical 2700 0 2.21 3 Dust reduction inner city Technical 600 0 0.1105 4 Less studded tires Adaptation 99000 929.5 5.95 5 Vehicle PM filter HDV Technical 327500 36 90.4 6 Vehicle change LDV Technical -489000 3 8.225 7 Reduced speed at episodes Adaptation 190320 0.4 0.221 8 Congestion charging Adaptation -603000 30.1 8.2215
9 Rerouting Both 19000 -2.41 3.84
10 Residential heating (accumulator tank) Technical 535 153 434.1 11 Residential heating (biomass) Technical 540000 -735 -7111.5 12 Residential heating (GSHP/DH) Technical 540000 132.3 383.4
Column 5 is the total reduction of PM10 in tonnes from the control measures. For example, the instrument "less studded tires" which costs 99000 (in 1000 sek) would reduce PM10 emission from traffic by about 930 tonnes. Note that some numbers are negative indicating that, while a measure can be beneficial for other aspects, it would increase PM10 emissions. However, as discussed in the introduction, the main reason for target setting using air quality limit values is to reduce emissions in order to improve human health. Since emissions are not always a good indicator of human exposure to harmful pollutants one could consider other formulations of targets for the same measures to be used in a cost-effective analysis3. We test if this makes a difference by also doing an evaluation using a target which is an assessment of the expected health impact from a reduction in PM emissions from different emissions sources (road wear, exhaust and combustion PM). We have measured the health impact of the measures as reductions in years of life lost (YOLL), or say, the prevented loss in life-years. These estimates are presented in final column in Table 1 (for details see Nerhagen and Li, 2008).
To be noted here is that the reduction in YOLL is not perfectly correlated with the reduction in PM10. Some measures such as “Less studded tires” and “Vehicle change LDV” have a similar impact on YOLL (5.95 and 8.225) although the influence on PM10 emissions is significantly different (929.5 and 3). The reason for this difference is that the measures target PM emissions of different origin that are expected to have different health impacts. “Less studded tires” mainly influence road dust which is coarser PM that aggravates conditions for people at bad health but with a minor influence on mortality risk. Measures such as “Vehicle change LDV” on the other hand mainly reduce the emissions of finer exhaust PM that are an important cause for disease related premature mortality (Brunekreef and Forsberg, 2005). The reason for the difference in health impact is that finer PM will penetrate further down into
3 Smeets et al. (2007) did a similar analysis for the Netherlands but instead of using YOLL as target they assessed the modeled reduction in population exposure in addition to reductions in emissions.
the lungs and from there into the blood4. For more details on this issue, see Nerhagen et al., (2008).
It is worth mentioning that much uncertainty is involved in the numbers here. We may at best treat them as some kind of mean values with dispersion measures to be assessed, in terms of standard errors or confidence intervals.
MODELS FOR COST-EFFECTIVE ANALYSIS
Cost-effective analysis aims at achieving certain pre-determined targets at the lowest possible cost by choosing the "right" combination of control measures. More exactly, we usexi, i=1, 2,..,12, to represent the control variables with xi =1 if measure i is chosen and
0
i
x = if not. Let ai denote the technical parameter on how much a full adoption of measure i would reduce the emission of the pollutant. For PM10 as example, we have
5=36
a . For
the control cost, let ci be the total cost to implement measure i (for example ci=327500). In a deterministic world, cost-effective analysis is rather simple, especially for controlling the emission of a single pollutant such as PM10. Suppose that we set an emission reduction target as t, then the problem with no uncertainty can be formulated as
12 1 min i i i c x =
∑
s.t. 12 1 0 1 i i i i a x t and x = ≥ ≤ ≤∑
for i=1, 2,..,12 (1)For a given t, we can solve for the cost-effective control xi*( )t and then calculate the minimized cost 12 * * 1 ( ) i i ( ) i c t c x t = =
∑
(2)with which we can derive the marginal cost
*
( ) ( ) /
mc t = ∂c t ∂t (3)
which is a piece-wise continuous function with a finite number of discontinuities (at most 11 points where the increase in t leads to a shift from one instrument to another). The same calculation can also be done using YOLL as target. In our first analysis we use this model to determine and compare the outcome when we use PM10 and YOLL respectively as targets for the same measures.
4 For the purpose of this paper we have chosen to focus on one of the expected health endpoints resulting from exposure to PM, premature deaths resulting from exposure. As discussed in Brunekreef and Forsberg (2005) PM of different origin and size are expected to influence human health in different ways but the exact relationships are still unknown. Premature death is for example the health endpoint used in cost-effective analysis in the GAINS model.
However, another problem with our data is the uncertainties related to the effectiveness of the abatement measures. We therefore give an illustration of how uncertainties influence the results using PM10 as target. To account for this in the analysis we extend the model above to exercise more active control. In this case, it is appropriate to use a stochastic model by actively taking the uncertainty into account.
Let
i i i
a% =a +
ε
(4)denote the stochastic effectiveness parameter with ai as the point estimates. Then the realized reduction becomes
1 2 1 2 1 1 i i i i i i
a x
a x
δ
= ==
+
∑
%
∑
(5) with 12 1 i i i xδ
ε
==
∑
as the stochastic deviation from the expected reduction level. With uncertainty, we cannot be certain that a given target will be reached with 100% confidence. Thus, we need to express the fulfilment of a given target in probability terms. The model is now 12 1 min i i i c x =∑
st 12 1 Pr( i i ) i a x tα
= ≥ =∑
% , 0≤xi ≤1, i=1,2,...,12 (6)where α is the probability of fulfilment. For example, if α=0.75 and t=1022, then we mean that we are looking for such cost-effective solutions xi*,i=1, 2,..12, such that we are 75% confident that the suggested target in the reduction of PM10 emission (1022) will be realized. With this model, we can calculate the expected reduction in PM10 conditional on the requirement of probability fulfilment α and the degree of uncertainty in the effectiveness measures δ. We do not assume uncertainty in the cost measures due to the linearity in the objective function. As long as the cost estimates are unbiased, the marginal cost estimates would be the same, though they should be relabelled as the expected marginal costs in the presence of uncertainty.
DATA ANALYSES AND RESULTS
For a range of PM10 emission reduction targets, we have applied the deterministic model (1) and calculated the marginal cost and side effect as shown in Table 2. For t=34, it is seen that marginal cost is about 3500 SEK per tonne. How should we interpret this number? Suppose that a reduction target of 34 is already reached, by a full adoption of "congestion charging" with a negative cost, then an additional increase in the target level by 1 tonne would cost SEK 3 500. However, if t=1250, reached by x4 =1,
6 1 x = , 8 1 x = , 10 1 x = and 12 1 x = , and a
partial use of x5, then an increase in the reduction target by a tonne would cost as up to 9
million SEK.
Table 2: Results from the deterministic model with PM10 as target
Target (tonne) Realized reduction PM10 (tonne) Marginal cost (1000 SEK) YOLL reduction
33 33 0 16.45 34 34 3.50 19.00 186 186 3.50 450.26 187 187 106.51 450.55 1115 1115 106.51 456.49 1116 1116 4081.63 457.66 1150 1150 4081.63 556.18 1245 1245 4081.63 831.49 1250 1250 9097.22 845.17 1283 1283 9097.22 928.04
From Figure 1, it is seen that the marginal cost remains lower than SEK 106 510 up to a target level 1115 tonnes while beyond the marginal cost rises abruptly. For t>1284, marginal cost would be infinite, meaning that with the available measures, no reduction level greater than 1284 is feasible. In Table 2, we also show the side effect on the prevention in lost life years. To reach a PM10 reduction target, a number of measures are needed, and adoption of these measures also reduces the emission of other pollutants and save life years. It is worth mentioning that life-saving is an intended objective, but since the problem here is formulated as minimizing cost to reach a PM10 reduction target, we tentatively term the effect on YOLL side effect. From the table, it is seen that reduction in PM10 goes along with the prevention of life-years lost.
0 1000 2000 3000 4000 5000 6000 7000 8000 9000 10000 0 200 400 600 800 1000 1200 1400 D_PM10 M C
In the analysis so far, we have used PM10 as the targeting variable. For comparison purpose, we now use the prevented loss in the number of life years instead. By running the deterministic model targeting YOLL, we obtain the results as in Table 3 with the marginal cost as well as the side effect on PM10 reported. By regressing the number of life years saved on the corresponding PM10 reduction in Table 3, we obtain the following results (standard error in parentheses)
∆YOLL= 195.45 + 1.5452∆PM10 (82.93) (0.23)
which shows that there is a significant correspondence between PM10 reductions and the life years saved. The more reductions in PM10, the more life years saved.
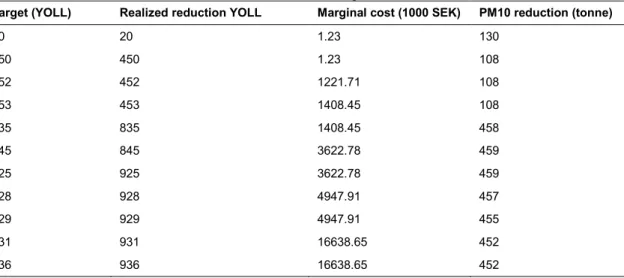
Table 3: Results from the deterministic model with YOLL as target
Target (YOLL) Realized reduction YOLL Marginal cost (1000 SEK) PM10 reduction (tonne)
20 20 1.23 130 450 450 1.23 108 452 452 1221.71 108 453 453 1408.45 108 835 835 1408.45 458 845 845 3622.78 459 925 925 3622.78 459 928 928 4947.91 457 929 929 4947.91 455 931 931 16638.65 452 936 936 16638.65 452
To compare the effects of the two different targeting strategies is, however, not easy. The reduction in PM10 and YOLL are measured in different units, and the marginal cost curves for reducing them may locally differ to some extent as depicted in Figure 2. For example, for a targeting YOLL reduction with 925 units, the marginal cost is about 3.6 million SEK, and the side effect on PM10 is about 459 units. By targeting PM10 with the same amount directly, however, the resulting marginal cost is only about 106 000 SEK.
0 5 0 0 0 1 0 0 0 0 1 5 0 0 0 2 0 0 0 0 M C 0 500 1000 1500 reduction in yoll (pm)
Figure 2: PM10 versus YOLL reductions: The marginal costs
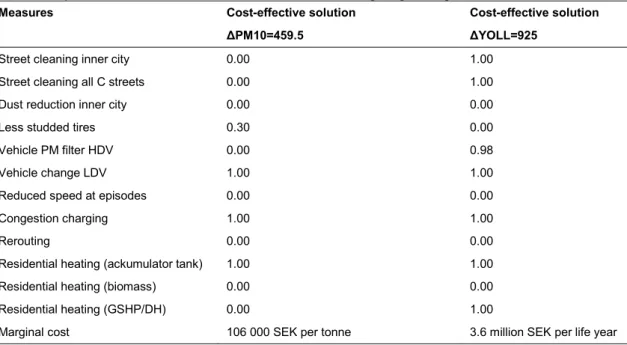
The reason for this result is further illustrated in table 4. A zero in column 2 and 3 indicates that the measure is not cost-effective and hence not chosen, a one that the measure is undertaken and a value between 0 and 1 that the measure is partly undertaken. As seen in the table, there are some important differences hidden in the analysis so far. For example, the first two instruments "Street cleaning inner city' and "Street cleaning all streets' are not chosen when targeting PM10 reduction (as they have not effect), but chosen for life year savings. The same is true for instrument 5 (Vehicle PM filter HDV) and 12 (Residential heating (GSHP/DH) due to their effectiveness in life saving but not on PM10 reductions. On the other hand, instrument 4 (Less studded tires) was partially chosen for PM10 reduction but the instrument was not chosen for life saving targeting due to its relatively smaller effect there. Note that instrument 11 is not chosen at all as it costs money and causes both increased PM10 emission as well as the loss of life years. Possibly, this measure has positive environmental effects concerning other pollutants.
Table 4: Comparison of cost-effective measures with different targeting strategies
Measures Cost-effective solution Cost-effective solution
∆PM10=459.5 ∆YOLL=925
Street cleaning inner city 0.00 1.00
Street cleaning all C streets 0.00 1.00
Dust reduction inner city 0.00 0.00
Less studded tires 0.30 0.00
Vehicle PM filter HDV 0.00 0.98
Vehicle change LDV 1.00 1.00
Reduced speed at episodes 0.00 0.00
Congestion charging 1.00 1.00
Rerouting 0.00 0.00
Residential heating (ackumulator tank) 1.00 1.00
Residential heating (biomass) 0.00 0.00
Residential heating (GSHP/DH) 0.00 1.00
Marginal cost 106 000 SEK per tonne 3.6 million SEK per life year
In sum, the overall trend is that a more PM10 reduction corresponds to more life years saved, and the higher marginal cost. However, for a specific combination of the target level, the choice in cost-effective measures and the resulting marginal cost can be considerably different.
Now, we illustrate the effects of using the deterministic model in the presence of uncertainty about the effectiveness parametersai. The column data in Table 1 involves much uncertainty, but quantitative measures for them are currently not available. To start with, we assume some 99% "confidence interval" [ai −h ai, i +hi], with hi =
β
ai and β=0.3 . The standard deviation of the random effectiveness parameter ai is aboutσ
i =hi / 3. In the same way as the Environmental Objectives Committee expressed uncertainty (Li and Budh, 2008), this number β=0.3 is interpreted as the variation coefficient of the point estimates. In this case, the calculated emission reduction should be the expected value of the actual reduction. For a target level of 33 tonnes, for example, the 95% confidence interval of the reduction is calculated to be [27,39], and the respective interval for a target level of 1116 tonnes is [931, 1300]. Although the targets are pre-determined, and they are expected to be reached in probability, the actual reduction is truly stochastic, either below or above the targets. By symmetry of the normal variable, the probability for not reaching targets is 50% and the probability to over-reach target is also 50%.To reach a higher fulfilment probability level α>0.5, we employ the stochastic control model as in (6). For example, if α=0.75 and t=1022, then we mean that we are looking for cost-effective solutions xi*, i=1,2,...,12, such that we are 75% certain that the suggested target in the reduction of PM10 emission will be realized. In Table 5, we show the results from the stochastic model under uncertainty, conditional on α=0.75,β=0.3.
Table 5: Results from the stochastic model with PM10 as target (
α
=0.75,β
=0.3)Target Expected
reduction
Probability fulfilment
Marginal cost L-95% U-95%
(tonne) (tonne) (1000 SEK)
30 33 0.85 0 27 39 995 1054 0.75 114 881 1227 1020 1081 0.75 114 903 1259 1040 1102 0.75 116 920 1284 1075 1138 0.75 4088 953 1323 1095 1158 0.75 4094 973 1343 1100 1163 0.75 4095 978 1348 1125 1188 0.75 4103 1003 1374 1150 1213 0.75 4110 1028 1399 1160 1223 0.75 4113 1038 1409 1165 1229 0.75 4114 1042 1415 1169 1233 0.75 4115 1046 1419 1170 1234 0.75 4125 1047 1420
Compared to the deterministic model, it is seen that the expected reductions are higher than the targets with a required probability of fulfilment being 0.75, and the marginal costs also tend to be higher. With the same uncertainty assumption (β=0.3) but a higher probability of fulfilment α=0.95, we re-run the model and find that with a higher probability of fulfilment, both the expected reductions and the marginal costs are higher in order to reach a given target level. For example, when the target is set to 990, we obtained an expected reduction of 1145, with a fulfilment probability 0.95 and a marginal cost about SEK 4.1 million. Next, we keep the compliance probability at 0.75 but increase the coefficient of variation to β=0.4, then we find that the overall marginal costs are higher for the same requirement on the probability of fulfilment. For a target of 995, the expected reduction becomes 1076 satisfying the compliance probability of 0.75, and the marginal cost becomes SEK 118 000.
CONCLUDING REMARKS
In this paper, we have studied the cost-effectiveness of traffic emission control under different targeting strategies, both under parameter certainty and uncertainty. By assuming that data for Greater Stockholm, collected from the other sub-projects in TESS as perfect, a cost-effective analysis is done with a simple linear programming model. The main finding is that the marginal cost rises very abruptly for a reduction target of PM10 over about 1115 tonnes. However, since reductions in emissions in PM10 may be only weakly related to health benefits, we have examined the consequences of targeting life-years saved instead of PM10. The findings are that: (1) the overall trend is consistent in that the more PM10 reduction, the more life-years saved, and thus the higher marginal costs, (2) there are still essential differences in the choice of effective measures and marginal cost at particular targeting levels that may greatly differ. Therefore if the ultimate objective is to save lives or
say life-years, it should be more appropriate to target YOLL, provided that YOLL can be properly predicted.
The problem in doing this is that there are still large uncertainties both regarding the health impacts of different pollutants and how to measure the contribution from different sources. Thus it may be more efficient to target emissions or concentration levels of pollutants, such as PM10 in our case, which indirectly improve health and save lives. Given that the emission levels are correlated with the health impacts, this should have the same effect as controlling for pollution-related heath effects. Hence, the crucial thing to consider when using such an indirect approach is that there is a close correlation between the health impacts and changes in the metric chosen for evaluation. Moreover, in actual applications it is reasonable to expect that a measure will reduce emissions of different origin with different health impacts and in this case a multiple emission control model as in Li and Budh (2008) is preferable.
Another problem with this type of analysis is that the data involves a considerable degree of uncertainty. In the presence of uncertainty, say, a 30% variation from the point estimates of the effectiveness parameter, we have calculated the confidence interval of realized emission reductions. Even though we have a pre-determined reduction target (in our case PM10 reduction), the realized reduction is a random variable, and the fulfilment probability is simply 0.5 under the normal distribution assumption. To take the uncertainty into account, we employ an active stochastic control model to control both for the targets and fulfilment probabilities. We have simulated the uncertainty by 30% and 40% variations from the mean values to examine the effects of them. We find that the higher fulfilment probability, the larger the marginal cost as expected. Also, for a given fulfilment probability, the more uncertain we are about the true effectiveness parameters, the larger the marginal costs.
Regarding uncertainty, our conclusion is to employ the active stochastic control model in the presence of uncertainty to control for both the target itself and the fulfilment probability. Ignoring the uncertainty may not be a good way of doing cost-effective analysis. The data is rough and thus other types of uncertainty are ignored. In future research, both the cost data and effectiveness parameters may need to be refined, preferably with uncertainty data provided explicitly. Moreover, cost-effective analysis in the traffic sector may also need to be integrated with some more broadly defined environmental objectives.
Acknowledgement
The authors thank Svante Mandell for helpful comments. The usual disclaimer applies.
REFERENCES
Energimyndigheten and Swedish Environmental Protection Agency (2007): Åtgärdsmöjligheter i Sverige - en sektorsvis genomgång. Delrapport 3 i Energimyndighetens och Naturvårdsverkets underlag till Kontrollstation 2008. Energimyndigheten ER2008:29. Swedish Energy Agency
Hartman R.S., Wheeler D. and Singh M. (1997): The cost of air pollution abatement. Applied Economics, 29. pp. 759-774.
Höglund L. (2005): Abatement costs in response to the Swedish charge on nitrogen oxide emissions. Journal of Environmental Economics and Management 20. pp 102-120 Johansson, C., and Eneroth, K. (2007): TESS -- Traffic Emissions, Socioeconomic valuation
and Socioeconomic measures. Part 1: Emissions and Exposure of Particles and NOx in Greater Stockholm. SLB analys rapport nr. 2. http://www.slb.nu/lvf
Li, C-Z. and Budh, E. (2008): Environmental Objectives, Cost Efficiency, and Multivariate Stochastic Control. Environmental Model Assessment 13, 315-325.
County board of Stockholm County (2004): Förslag till åtgärdsprogram för att klara miljökvalitetsnormen för partiklar PM 10 i Stockholms län. Dnr 1842-02-87078.
http://www.ab.lst.se/upload/dokument/miljo_och_halsa/miljolagstiftning/MKN/Partiklar/ atgardsprogram_pm10.pdf
Nerhagen, L., Bergström, R., Eneroth, K., Forsberg, B., and Johansson, C. (2008): The mortality cost of particulate matter due to emissions in the Stockholm area – an investigation into harmfulness, sources and the geographical dimension of their impact. VTI-rapport 635A, Available at www.vti.se
Nerhagen and Li (2008):. Cost-effective analysis of local policy measure to improve air quality in Stockholm -- an exploratory study. VTI-notat 32A. Available at www.vti.se Oslo kommune and Statens vegvesen Region öst (2004): Luftkvalitet i Oslo. Tiltaksutredning
med forslag til handlingspakker. www.luftkvalitet.info
Ribbenhed, M., Furusjö, E. och Carlsson Reich, M. (2005): REKOluft -- Reduktionskostnader för luftemissionsbegränsande åtgärder. IVL rapport B 1608. IVL Swedish
Environmental Research Institute
Smeets, W., Blom, W., Hoen, A., Jimmink, B., Koelemeijer, R., Peters, J. and de Vries, W. (2007) Cost-effective abatement options for improving air quality in the Netherlands. MNP Netherlands Environmental Assessment Agency. Dust conference 23 -24 April 2007, Maastricht.
Sternhufvud, C., Belhaj, M. och Åström S. (2006): The Features of Non-technical Measures and their importance in Cost-effective Abatement of Air Pollutant Emissions. IVL rapport B1656. IVL Swedish Environmental Research Institute
Särnholm, E. (2005): Åtgärdskostnader för minskning av koldioxidutsläpp vid svenska kraftvärme- och värmeanläggningar. IVL rapport B1650. IVL Swedish Environmental Research Institute
Särnholm, E. och Gode, J. (2007): Abatement costs for carbon dioxide reductions in the transport sector. IVL rapport B1716. IVL Swedish Environmental Research Institute WHO (2006): Air Quality Guidelines - global update 2005. WHO/SDE/PHE/06.02. World
Health Organization.
Swedish National Road Administration (2007): Redovisning av regeringsuppdrag N2006/4800/TP - uppdrag att utreda möjliga åtgärder för att minska
partikelemissionerna från slitage och uppvirvling. Dokument beteckning SA80A 2006:15982. Swedish Road Administration