RELATIONSHIP BETWEEN SPEED AND LATERAL POSITION ON
CURVES
Shauna L. Hallmark, Neal Hawkins, and Omar Smadi Center for Transportation Research and Education,
Iowa State University, Ames, Iowa USA E-mail: shallmar@iastate.edu
ABSTRACT
Lane departure crashes are a significant safety concern. The majority of lane departure crashes occur in rural areas, mostly on 2-lane roadways. A disproportionate number of these crashes occur on horizontal curves. Curve related crashes involve a number of roadway and driver causative factors. Understanding how drivers negotiate curves can assist in application of countermeasures.
One aspect of curve negotiation that is not well documented is the relationship between lateral position and speed. This relationship was assessed by comparing the odds of a near lane crossing for vehicles traveling 5 or more mph over the advisory speed to those for vehicles traveling below that threshold. Data were collected using a “Z” configuration of road tubes at three rural 2-lane curves in Iowa (USA). Data were collected at various locations within those curves including the PC and center of curve. Data were compared for daytime and nighttime separately since driver behavior can vary during these time periods. When results were statistically significant, vehicles at higher speeds had greater odds of near lane crossings.
1 BACKGROUND
The Federal Highway Administration (FHWA, 2009) estimates that 58 percent of roadway fatalities are lane departures, the majority of which are single-vehicle run-off-road crashes. Addressing lane departure crashes is therefore a priority for National, State, and local agencies. Horizontal curves are of particular interest because they have been correlated with overall increased crash occurrence. Curves have approximately three times the crash rate of tangent sections (Glennon, 1985). Preston(1999) reported that 25% to 50% of severe road departure crashes in Minnesota occurred on curves, even though curves only account for 10 percent of the system mileage. Shankar et al.(1998) evaluated divided State highways without median barriers in Washington State and found a relationship between the number of horizontal curves per kilometer and median crossover crashes. Farmer and Lund (2002) evaluated single-vehicle fatal and injury rollover crashes using FARS data and data from Florida, Pennsylvania, and Texas. Using logistic regression, they found that the odds of having a rollover on a curved section were 1.42 to 2.15 times that of having a rollover on a straight section.
A primary driver factor in crashes is excessive speed. NHSTA (2008) reports that approximately 31% of fatal crashes are speed related. Factors that contribute to excessive speed include driver workload and distraction, fatigue, sight distance, misperception of degree of roadway curvature, and situational complexity. Driver errors on horizontal curves are often due to the inappropriate selection of speed and the inability to maintain lane position. Drivers’ speed selection at curves depends on both explicit attentional cues and implicit perceptual
cues (Charlton, 2007). A drivers’ speed prior to entering a curve has a significant effect on their ability to successfully negotiate the curve (Preston and Schoenecker, 1999). Inappropriate speed selection and lane positioning can be a result of a driver failing to notice an upcoming curve or misperceiving the roadway curvature. Driver workload plays important role in driver speed maintenance. Distracting tasks such as radio tuning or cell phone conversations can draw a driver’s attention away from speed monitoring, detection of headway changes, lane keeping, and detection of potential hazards (Charlton, 2007). Other factors include sight distance issues, fatigue, or complexity of the driving situation(Charlton and DePont, 2007).
Anderson and Krammes (2000) developed a model comparing mean speed reduction and mean crash rate for 1,126 horizontal curves on rural 2-lane roadways. They report that the relationship between mean crash rate and required speed reduction to negotiate the curve is approximately linear. This finding is also supported by Fink and Krammes (1995) who indicate that curves requiring no speed reduction did not have significantly different mean crash rates than their preceding roadway tangents.
Although the relationship between speed and lateral position is important in understanding curve negotiation, the relationship is not well understood. A few studies have addressed the topic including one by Stodart and Donnell(2008) which collected driver speed and lateral vehicle position along a closed course 2-lane rural highway during the nighttime. Speed, lateral position, and other data were collected in an instrumented vehicle using 16 naïve drivers. The authors used several statistical methods to determine whether there is an endogenous relationship between speed and lateral position.
In another study, Preston and Shoenecker(1999) evaluated vehicle paths through a curve on a two-lane rural roadway with a speed limit of 55 miles per hour (mph) and an annual average daily traffic (AADT) of 3,250 vehicles per day (vpd). The researchers collected data over a 4-day period evaluated whether each vehicle successfully negotiated the curve, defined as a vehicle remaining within the lane lines as it traverses the curve. Vehicles which crossed a left or right lane line on one or more occasions were defined as “not successfully navigating the curve.”
They conducted a logistic regression to model the relationship between initial speed and the probability of a vehicle unsuccessfully navigating the curve. They found that there was a 20 percent better chance for vehicles that were traveling at or below the speed limit to successfully navigate the curve than for vehicles that were traveling over the speed limit, with the difference being statistically significant at 99 percent. They found that 45 percent of vehicles traveling at or above 65 mph were unable to negotiate the curve compared to 30 percent for vehicles that were traveling under 65 mph, with the difference being statistically significant at the 90 percent confidence interval.
2 PROJECT OBJECTIVES
Driver speed is a major factor in whether a driver will be able to successfully negotiate a curve. Successful curve negotiation is also a function of lane keeping which is commonly assessed using lateral position. An understanding of the relationship between speed and lateral position is important in applying roadway countermeasures such as advisory speeds. A better understanding of the relationship between driver speed and lane position can also provide valuable information for road departure collision warning systems (RDCWS).
This paper summarizes research which evaluated speed and lateral position on rural two-lane curves. Longitudinal speed and lateral position were collected during a separate study to evaluate the effectiveness of roadway based curve countermeasures. Treatments were installed at three rural 2-lane curves and speed and lateral position were used as measures of effectiveness. Data were collected before the countermeasures were installed and this information was used to assess the relationship between speed and lateral position as described in this paper.
The study used odds ratio to test differences in curve negotiation between vehicles traveling within 5 mph of the posted advisory curve speed and those traveling over that threshold.
3 DATA COLLECTION AND REDUCTION
3.1 Site Selection
High crash sites were selected from a list of horizontal curves on rural two-lane paved roadways in Iowa (a Midwestern state in the United States). The team defined a high crash location as a curve having five or more crashes within a five-year period (2002 through 2006). The researchers identified these sites as potential locations for additional treatments for a related study. The researchers displayed the potential sites on a geographic information system (GIS) map with aerial imagery. The team then identified sites where the curve was within a major intersection, railroad crossing, or other major access point and removed those sites from the list of potential sites.
The team made field visits to the remaining sites, where they noted information such as posted and advisory speed and other site characteristics. During the site visits, the team conducted an initial speed study using a radar gun to ensure that a speed problem existed. The researchers defined a speeding problem as a mean or 85th percentile speed that was 5 or more mph over the advisory curve speed, if present, or the posted limit, if no advisory speed was present.
After sites visits, the team reviewed each potential location and narrowed the list to those that met the following criteria:
• Posted speed limit on tangent section of 50 mph or higher • Demonstrated speeding problem (as defined above)
• No unusual features that would make certain types of treatment or speed data collection difficult
Before installation of the treatments, speed and volume data were collected using pneumatic road tubes. Lateral position data were also collected at three sites. As a result, data collected before installation of treatments at these three sites represent normal driving and were used for the analysis described in this paper.
All sites were rural 2-lane paved roadways with no paved shoulders. Gravel or earth shoulders were present of varying widths. The posted speed limit on the tangent section was 55 miles per hour (mph) (88.5 kilometers per hour {kph}) for all sites and all sites had an advisory speed posted for the curve. Additional information about the sites including annual average daily volume in vehicles per day (vpd) is shown in Table 1. All roadways had both a centerline and edge lines. Roadway width for all three sites was approximately 23 feet from edge line to edge line.
Table 1: Site Information
Curve Advisory Speed Radius Volume
221st Street 50 mph (80.5 kph) 957 feet (291.7 m) 2.410 vpd IA 141 35mph (56.3 kph) 514 feet (156.7 m) 830 vpd US 52 40 mph (64.4 kph) 617 feet (188.1 m) 2,280 vpd
3.2 Use of Lateral Position as a Safety Surrogate
Lane position has been used as a safety surrogate measure since crash data are not always available. Lane position or deviation from the lane center has been used to assess the effectiveness of different lane departure countermeasures such as wider edge lines (Donnel et al, 2006), post-mounted delineators (Zador et al, 1987; Chrysler et al 2009), advance warning (Charlton, 2007), and rumble strips or rumble stripes (Finley et al, 2009; Rasanen, 2005). Stimpson et al. (1977) identified lateral placement and speed as the best indicators for assessing driver behavior on horizontal curves. Use of lateral position, assumes that there is a correlation between lane position and likelihood of running off the roadway. Several studies have used lane keeping as a measure of effectiveness, including Porter et al. (1995) and Taylor et al. (2005).
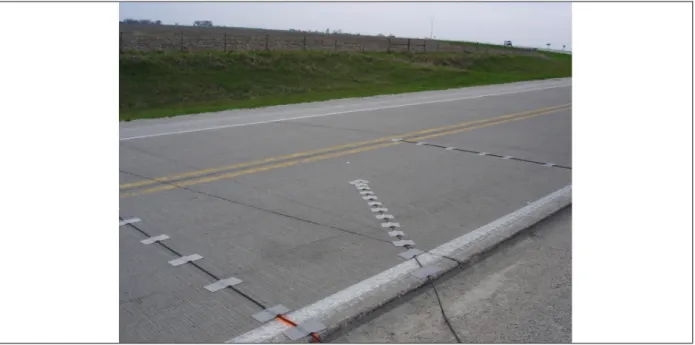
In order to collect lateral position, the team followed a methodology used by Finley et al (2009) and Porter et al.(1995) that uses pneumatic road tubes set up in a “Z” configuration, as shown in Figure 1. Using the time stamp of when each tire strikes a particular road tube and geometric relationships, the distance that the vehicle is from the edge of the roadway (Ox)
can be determined. The tube configuration is set up so that the right edge of the right lane line for tube 1 is the reference point (0,0).
Data were collected at various positions (curve beginning, center of curve, and curve exit) along each of the three curves resulting in eight data collection locations.
3.3 Data Reduction
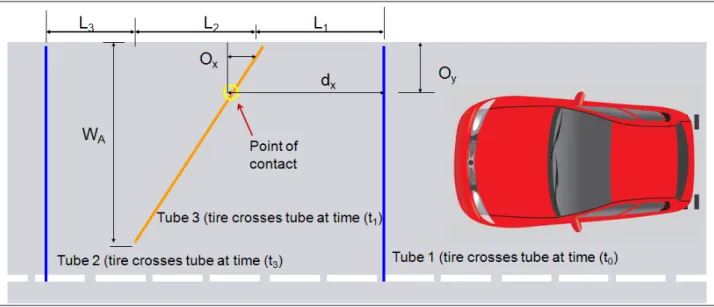
Data were collected at two or more locations at each of the three curves. Data from the counters is output as raw data into a spreadsheet with date, time (to the millisecond), and sensor (tube) number. Each row represents one tire strike on a particular sensor and data are ordered sequentially. Ideally tubes 1 and 2 receive one strike for each vehicle axle while tube 3 could receive one or two strikes depending on whether the outside tire crosses tube 3. As a result, a particular tube order indicates number of axles and direction. Other scenarios such as a vehicle crossing the centerline from the other direction, a vehicle crossing the tubes at an unusual angle, and air backwash result in tube configurations that are illogical. This information was used to remove erroneous data from the datasets. A schematic of the variables used is shown in Figure 2. Vehicle speed was calculated using time from when the first axle of tires strikes tube 1 and tubes 2:
v = (L1 + L2 + L3) (eq 1)
(t2 – t1)
When speed is known and the time the first tire strikes tube 3, the distance from tube 1 to tube 3 can be calculated using:
dx = v (t3 – t1) (eq. 2)
The variable dx is different for each vehicle since the vehicle strikes tube 3 at a different
location depending on its distance from the edge line. Using properties of similar triangles, the lateral distance the wheel is from edge of the right lane (Oy) is calculated. A 6-foot track
width and known lane width were used to convert lateral position to reflect distance of vehicle center in relationship to lane center. Lateral displacement (dx) is the distance from the outside
right wheel to the right roadway edge.
Data were collected for several days at each site. Since it was difficult to account for the large number of unusual configurations that could occur, it was determined in this case that it was more feasible to reduce the data manually than to attempt to write a computer program to reduce the data. The manual data reduction was quite time consuming so an attempt was made to reduce 500 passenger vehicles for the daytime period for each location and 300 passenger vehicles for the nighttime period. However, since the curves are in rural locations, lower volumes were present, so in several cases smaller sample sizes were present. In a few cases for the nighttime period, the same size was so low that a statistical comparison could not be made. Sample size is presented along with results in Table 2.
Additionally, since data reduction was mostly a manual process and large trucks only made up a small percentage of the traffic stream, only passenger cars were included in the analysis.
Figure 2: Layout configuration of road tubes to measure lateral displacement
4 METHODOLOGY
Data were disaggregated into daytime and nighttime periods. Data were evaluated by time period since curve negotiation may be different during the daytime as compared to nighttime. Daytime was defined as sunrise until one half hour before sunset. Nighttime was determined to be sunset until one half hour before sunrise as determined by posted sunrise and sunset times for the days when data were collected. Data for the remaining half hours at sunrise and sunset were discarded since light conditions are transitioning between light and dark.
The relationship between and lateral position was assessed using an odds ratio. The odds of a near lane crossing for vehicles traveling 5 or more mph over the advisory speed compared to those traveling within 5 mph of the advisory speed. A near lane crossing was defined as a vehicle tire coming within 6 inches of the edge line or centerline.
5 RESULTS
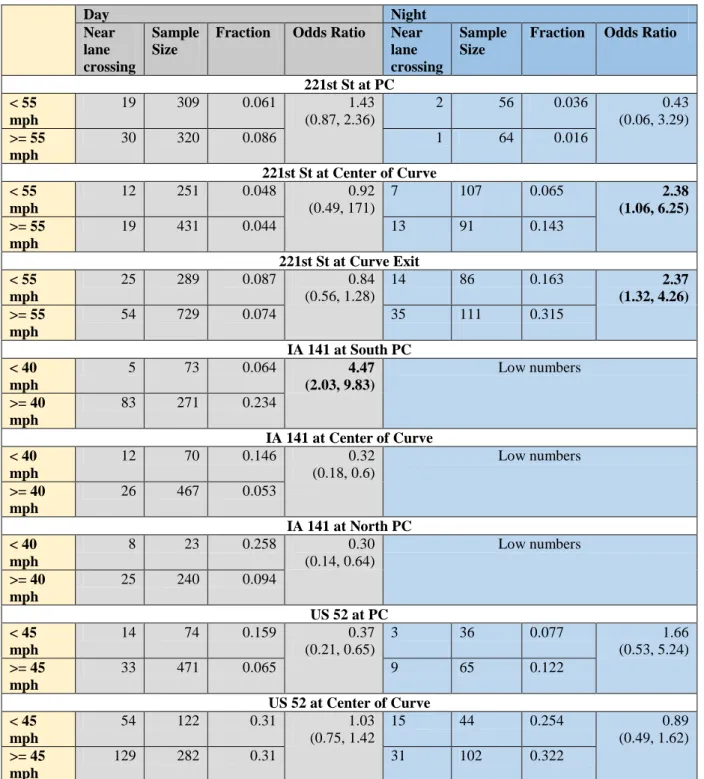
Results are presented in Table 2. For the daytime period, seven locations had odds ratio that were not statistically different at the 90% level of significance. At one location (221st at the south PC), vehicles traveling 5 or more mph over the advisory speed were 4.47 times more likely to cross near the centerline or edge line as vehicles traveling below that threshold.
Three locations during the nighttime period had too few observations to evaluate. Additionally, three locations had odds ratios that were not statistically different at the 90% level of significance. At two locations, the odds of crossing near the center line or edge line were higher for vehicles traveling 5 or more mph over the advisory speed than for vehicles traveling below that threshold. At one location, the odds were 2.38 times higher and at the other the odds were 2.37 times high for vehicles traveling 5 or more mph over the curve advisory speed.
Table 2: Relationship Between Near Lane Crossings and Speed Day Night Near lane crossing Sample Size
Fraction Odds Ratio Near
lane crossing
Sample Size
Fraction Odds Ratio
221st St at PC < 55 mph 19 309 0.061 1.43 (0.87, 2.36) 2 56 0.036 0.43 (0.06, 3.29) >= 55 mph 30 320 0.086 1 64 0.016 221st St at Center of Curve < 55 mph 12 251 0.048 0.92 (0.49, 171) 7 107 0.065 2.38 (1.06, 6.25) >= 55 mph 19 431 0.044 13 91 0.143 221st St at Curve Exit < 55 mph 25 289 0.087 0.84 (0.56, 1.28) 14 86 0.163 2.37 (1.32, 4.26) >= 55 mph 54 729 0.074 35 111 0.315 IA 141 at South PC < 40 mph 5 73 0.064 4.47 (2.03, 9.83) Low numbers >= 40 mph 83 271 0.234 IA 141 at Center of Curve < 40 mph 12 70 0.146 0.32 (0.18, 0.6) Low numbers >= 40 mph 26 467 0.053 IA 141 at North PC < 40 mph 8 23 0.258 0.30 (0.14, 0.64) Low numbers >= 40 mph 25 240 0.094 US 52 at PC < 45 mph 14 74 0.159 0.37 (0.21, 0.65) 3 36 0.077 1.66 (0.53, 5.24) >= 45 mph 33 471 0.065 9 65 0.122 US 52 at Center of Curve < 45 mph 54 122 0.31 1.03 (0.75, 1.42 15 44 0.254 0.89 (0.49, 1.62) >= 45 mph 129 282 0.31 31 102 0.322
6 CONCLUSIONS
This paper summarized research to assess the relationship between speed and lateral position. Longitudinal speed and lateral position were collected at several locations along three curves on rural 2-lane roadways in Iowa (US). Data were only collected at three sites due to the significant amount of manual effort required to reduce the data.
The odds of a near lane crossing for vehicles traveling 5 or more mph over the advisory speed were compared to vehicle traveling under the speed threshold. Results were not statistically significant at the majority of the locations evaluated. However, there was some evidence of a relationship at one location during the daytime and 2 locations during the nighttime. In those cases the odds of a near lane crossing were 2.37 to 4.47 times higher at higher speeds.
Although there were some limitations with this approach, the results provide evidence of the relationship between lateral position and speed. This is useful in evaluating roadway based countermeasures since metrics which reduce speeds may result in better lane positioning and less likelihood of a lane departure. Additionally, this information can be a first step in understanding how driver negotiate curves for RDCWS and other applications.
REFERENCES
Anderson, I.B. and R.A. Krammes. (2000). “Speed Reduction as a Surrogate for Accident Experience at Horizontal Curves on Rural Two-Lane Highways.” Journal of the
Transportation Research Record. Vol. 1701. pp. 86-94.
Charlton, S.G. and J.J. DePont. (2007). Curve Speed Management. Land Transport New Zealand Research Report 323. July 2007.
Charlton, S.G. (2007). “The Role of Attention in Horizontal Curves: A Comparison of Advance Warning, Delineation, and Road Marking Treatments.” Accident Analysis and
Prevention. Vol. 39. pp. 873–885.
Chrysler, S.T., J. Re, K.S. Knapp, D.S. Funkhouser, and B.T. Kuhn. (2009). Driver Response
to Delineation Treatments on Horizontal Curves on two-lane roads. Texas
Transportation Institute. FHWA/TX-09/-5772-1. May 2009.
Donnell, E.T., M.D. Gemar, and I. Cruzado. (2006). Operational Effects of Wide Edge Lines
Applied to Horizontal Curves on Two-Lane Rural Highways. Pennsylvania
Transportation Institute, University Park, PA, November 2006.
Farmer, C.M. and A.K. Lund. (2002) “Rollover Risk of Cars and Light Trucks after Accounting for Driver and Environmental Factors.” Accident Analysis and Prevention. Vol. 34. pp. 163–173.
Fink, K. L., and R. A. Krammes. (1995). “Tangent Length and Sight Distance Effects on Accident Rates at Horizontal Curves on Rural Two-Lane Highways.” Transportation
Research Record 1500, Transportation Research Board. pp. 162–168.
Finley, M.D., Dillon S. Funkhouser, and Marcus A. Brewer. (2009). Studies to Determine
the Operational Effects of Shoulder and Centerline Rumble Strips on Two-Lane Undivided Roadways. Texas Transportation Institute. August 2009.
FHWA. (2009) FHWA’s Road Departure Program.
http://www.t2.unh.edu/nltapa/Pubs/fhwa's_roadway_ departure_program.pdf. Accessed Federal Highway Administration. December 2009.
Glennon, J.C., T. Neuman, and J. Leisch. (1985) Safety and Operational Considerations for
Design of Rural Highway curves. FHWA. FHWA/RD-86-035. December 1985.
NHTSA. (2008). Traffic Safety Facts, 2008 Data: Speeding. National Highway Traffic Safety Administration. DOT HS 811 166.
Porter, R.J., E.T. Donnel, and K.M. Mahoney. (1995). “Evaluation of the Effects of Centerline Rumble Stripes on Lateral Vehicle Placement and Speed.” Journal of the
Transportation Research Record. No. 1862. Transportation Research Board,
Washington, DC. pp. 10-16.
Preston, H. and T. Schoenecker. (1999) Potential Safety Effects of Dynamic Signing at Rural
Horizontal Curves. Minnesota Local Road Research Board. Dec. 1999.
Rasanen, M. (2005). “Effects of a Rumble Strip Barrier Line on Lane Keeping in a Curve.” Accident Analysis and Prevention. Vol. 37. pp. 575-581.
Shankar, V., R.B. Albin, J.C. Milton, and F.L. Mannering. (1998) “Evaluating Median Crossover Likelihoods with Clustered Accident Counts: An Empirical Inquiry Using the Random Effects Negative Binomial Model.” Journal of the Transportation Research
Record. Vol. 1635. pp. 44–57.
Stimpson, W.A., H.W. McGee, W.K. Kittleson, and R.H. Ruddy. (1977). Field Evaluation of
Selected Delineation Treatments on Two-Lane Rural Highways. Report no.
FHWA-RD-77-118, FHWA, U.S. Department of Transportation, Washington, D.C.
Stodart, B.P. and E.T. Donnell. (2008) “Speed and Lateral Vehicle Position Models from Controlled Nighttime Driving Experiment.” ASCE Journal of Transportation
Engineering. Vol. 134, No 11. pp. 439-449.
Taylor, W., G. Abu-Lebdeh, and S. Rai. (2005). “Effect of Continuous Shoulder Rumble Strips and Pavement Markings on Lateral Placement of Vehicles.” Journal of the Transportation Research Record No. 1911. pp. 105-112.
Zador, P, H.S. Stein, P. Wright, J. Hall. (1987). “Effects of Chevrons, Post-Mounted Delineators, and Raised Pavement Markers on Driver Behavior at Roadway Curves.” Journal of the Transportation Research Record No. 1114. p. 1-10.