http://www.diva-portal.org
Postprint
This is the accepted version of a paper published in Industrial management + data systems. This paper has been peer-reviewed but does not include the final publisher proof-corrections or journal pagination.
Citation for the original published paper (version of record): Eriksson, D., Hilletofth, P., Hilmola, O-P. (2013)
Creating value through wholesaler and retailer interface. Industrial management + data systems, 113(8): 1169-1188 https://doi.org/10.1108/IMDS-02-2013-0078
Access to the published version may require subscription. N.B. When citing this work, cite the original published paper.
Permanent link to this version:
1
Creating Value through Wholesaler and Retailer Interface
Abstract
Purpose – In the premium price range, retailer collaboration and showroom decoration as
well as information dissemination play important role in the consumer sector, particularly in furniture sales. Purpose of this research is to report findings from Swedish wholesaler and its process to improve sales of order driven furniture business.
Design/methodology/approach – A large case study including 26 companies follows in
longitudinal manner the retailers’ contribution to value creation based on a value gaps model. Both qualitative and quantitative data are used. Approach was chosen as wholesaler needed to change its business strategy due to high competition.
Findings – Innovative products may lose consumer perceived value, if information of the
product is distorted by the retailers. It is of course so that the number of display pieces in retailer outlets play important role, but actually the way these are presented is most critical. Only one retailer in this study followed wholesaler’s guidance, but again this retailer was able to show best sales. In turn some retailers performed much lower than expected, as they were not interested from new sales concept implemented due to strategy change at wholesaler.
Research limitations/implications – The service quality gaps model has been adjusted and is
presented as a value gaps model that may be used to understand, how value creation is not limited to a single company in a supply chain. However, we would like to emphasize that our observations are not necessarily enough as only one wholesale company and its retailer network in Sweden was followed.
Practical implications – The common practice for wholesalers to focus on display pieces is
not sufficient. The retailers’ ability to contribute to value creation needs to be considered, and this starts from collaboration at showroom level. This particularly concerns items in other than low cost product groups.
Originality/value – The research introduces information distortion as a concept to
understand, how consumer perceived value might be reduced by value gaps in a supply chain. Research is also unique in a way that it reports business strategy in other than low end segment (lowest costs), but still wholesaler procures products from Asia (China), and develops models in Sweden.
Keywords: Demand creation, strategy, supply chain management, value gaps, retail Paper type: Case study
2
1 Introduction
As a result of globalization, maturing of markets, and increased competition, a new market environment has evolved during the last decades (Christopher et al., 2004). Consumers have become more sophisticated and have higher demands on products and services. Christopher et al. (2004) argue that companies may try to compete with a lower price than their competitors and focus on producing high volumes. The risk with this strategy, however, is that the products may be viewed as commodities, which tends to force down the contribution margins. To escape competition based on cost, the authors identify a separate strategy based on introducing innovative products and introduce them to the market in a way that add value to the consumers. One example of this is global smart phone business – these Internet phones are today more expensive than very large flat screen TVs, and it could be argued that smart phone suppliers have been very successful of turning customers attention on what they could do with products and how trendy they are (instead of price alone). Think about stores of Apple, Sony and others around the world (Jones et al., 2010). Same trend, but in lower magnitude, is present in the furniture industry, where the consumer may choose to purchase furniture at a low cost (commodities), or in a premium price range (innovative products). Wholesalers are primarily responsible for new product development (NPD), but in the end retailers sell the concepts and experiences to customers. There is clearly lack of research in furniture supply chains about this contemporary topic.
Demand creation and supply chain management (SCM) are closely linked, especially during new product development (NPD), where identified consumer needs are converted to products (Khan and Creazza, 2009). For either management direction to fulfil its potential, it needs to be coordinated with the other (Jüttner et al., 2007; Piercy, 2002), especially in competitive markets where the consumers have great influence. Demand creation and SCM both have the ultimate goal of long-time prosperity for the entire supply chain. However, demand creation processes are often described with a focal-company focus (e.g. Leonard and Rayport, 1997; MacMillan and McGrath, 1997; Parasuraman et al., 1985). In a supply chain these processes are not controlled by single companies, rather managed through and affected by negotiation, relations, and external factors. It is therefore not suitable to investigate the subject from a single-company focus and important to examine the issue from a chain perspective.
This research concentrates on a small Swedish furniture wholesaler (Alpha) and how its retailers affect the utilization of their supply chain strategy, and how they contribute to Alpha’s demand creation strategy. Due to fierce competition Alpha decided to shift its business strategy from selling mass-produced furniture with low contribution margins to a consumer focused business strategy centred on developing and distributing innovative furniture in the premium price range. Using empathic design (Leonard and Rayport, 2000) Alpha was able to create furniture with a high innovative value, but the downstream alliances in the supply chain seem to affect the value of the products. The product does not stand alone, but is a part of the value package. One part of the package is closely related to the shopping experience as the consumer also consumes the store’s environment (Nsairi, 2012). The purpose of this paper is to study, how retailers affect value creation for a wholesaler, who develops innovative products. Thus, the aim is to investigate if the downstream alliances play an important role conserving and conveying innovative value, from the wholesaler to the consumer, with specific focus on products developed based on a profound understanding of unarticulated consumer needs. The main research question is: “How do retailers affect value creation for a furniture wholesaler selling a flexible assortment with innovative features?”
3
The remainder of this manuscript is structured as follows: In Section 2 the theoretical framework is presented, while in Section 3 the methodology and the research process are described. Case study findings are presented in Section 4, and further discussed through framework in Section 5. Finally, in Section 6 we conclude our research work and provide avenues for further research in this area.
2 Theoretical Framework
The theoretical framework of this research is centred on the interplay between activities dedicated to create value packages and the activities devoted to realize the production and delivery of the value packages. Here, referred to as demand creation and supply chain management (SCM). Demand creation activities include market intelligence, NPD, branding, and marketing and sales (Hilletofth, 2010). SCM includes sourcing, manufacturing, and distribution (Mentzer et al., 2001). Activities included in demand creation has been linked to strategic planning (Kärkkäinen et al., 2001), and SCM needs to be linked with the overall business strategy in order to be effective (Chopra and Meindl, 2010). The activities are therefore not only linked to their separate management direction, they are also connected to overreaching business strategies. The nature of the interplay between demand creation and SCM induces a need to coordinate the two management directions on an overreaching level (e.g. Hilletofth, 2012; Hilletofth and Eriksson, 2011;Jüttner et al., 2007).
Macro coordination of demand creation and SCM strives to provide superior consumer value and simultaneously to minimize costs (Jüttner et al., 2007; Walters and Rainbird, 2004) and to allow the involved entities to be prosperous in the long run (Hilletofth, 2011). Some vital components are: having a consumer focus in both demand creation and supply chain processes (De Treville et al., 2004; Heikkilä, 2002), coordinating value creation and value delivery (Canever et al., 2008; Esper et al., 2010; Jüttner et al., 2007; Walters and Rainbird, 2004), a view that demand creation and supply chain processes are equally important and that they need to be managed in a coordinated manner (Jacobs, 2006; Langabeer and Rose, 2004; Rainbird, 2004; Walters, 2008), and to consider value creation in both demand creation and supply chain processes (Vollmann and Cordon, 1998; Walters, 2008). Moreover, activities on the operational, tactical, and strategic levels must be aligned (Porter, 1996).
2.1 Demand Creation
Managing demand creation deals with the processes necessary to understand, create, and stimulate consumer demand (Charlebois, 2008; Jüttner et al., 2007; Walters and Rainbird, 2004). By understanding the consumer base several areas of value adding differentiation may be discovered. MacMillan and McGrath (1997) suggest that the consumption chain should be mapped, i.e. the total time from when the consumer becomes aware of the product until the product is disposed of. Possible areas for differentiation include delivery, storage, and disposal and also more typical services such as payment options, installation, and possibilities to get assistance. In the eyes of a wholesaler many of these differentiation opportunities rely on the retailer. Moreover, MacMillan and McGrath (1997) point out that the company needs to consider how the product is actually used, i.e. a gap between espoused theories, and theories in use (Argyris and Schön, 1995).
Searching for new areas of differentiation is difficult for several reasons, e.g. consumers may be so accustomed to the current conditions that they are unable to articulate their needs for new or deficits in current solutions (Leonard and Rayport, 1997). One of the first steps of
4
NPD is usually to search for new consumer opportunities with the purpose of understanding the voice of the consumer (Van Kleef et al., 2005; Kärkkäinen et al., 2001; Lee and Whang, 2001; Simonson, 1993). One way to incorporate users in the NPD process is through co-development of products, e.g. to evaluate and improve products under co-development (Prahalad and Ramaswamy, 2000; 2004). Consumers may also be observed without any interaction with specific products. By studying the consumers from the outside, erratic behaviour may increase market intelligence and reveal opportunities for NPD. One technique for utilizing observations to discover new areas of product differentiation is empathic design (Leonard and Rayport, 1997; Van Kleef et al., 2005).
Based on the previously mentioned techniques, it is easily assumed that the responsibility to create demand is a task for the company responsible to NPD, in this case the wholesaler, or supplier to the retailer. However, retailers and suppliers have different areas of competence, and if these are combined, a unique competence may be created. Furthermore, the retailer needs to commit to the new products and faces several risks when doing so. The wrong product may not only be a bad investment of money, it may also harm the retailer’s relation with its consumers (Hamister, 2012). Furthermore, if the products are aimed towards a premium segment, the retailer needs to consider how they relate to their current range and price levels (Dass and Kumar, 2012).
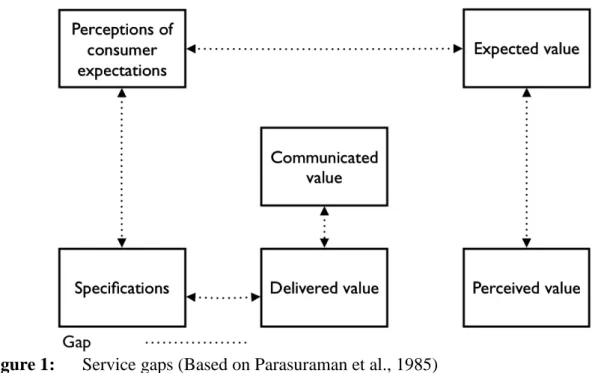
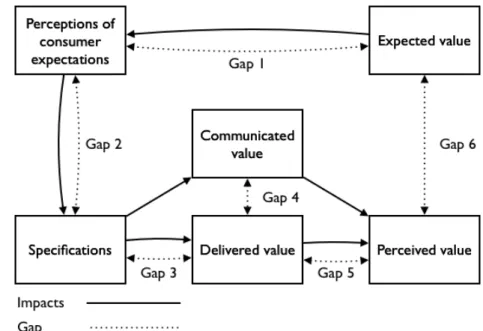
Parasuraman et al. (1985) propose a model of service quality gaps (Figure 1). The first gap is the gap between the consumer expectations and the management perception of the expectations. This gap rises due to inadequate marketing research orientation, lack of upward communication, insufficient relationship focus, and inadequate service recovery (Zeithaml et al., 2009, p. 34). The second gap is between management perceptions and service quality specifications. The gap is caused by poor service design, absence of customer-driven standards, and inappropriate physical evidence and serviscape (ibid, p. 37). The third gap is between service quality specifications and the service delivery. The gap arises due to dificiencies in human resource policies, failure to match supply and demand, customers not fulfilling roles, and problems with service intermediaries (ibid, p. 39). The fourth gap is between service delivery and external communications of the service. The gap is a result of lack of integrated services marketing communications, ineffective management of customer expectations, overpromising, inadequate horizontal communications, and inappropriate pricing (ibid, p. 42). The fifth gap is between the consumer perceived service, and the expected service. This gap is affected by the earlier gaps and is also the determinant of consumer satisfaction.
5
Figure 1: Service gaps (Based on Parasuraman et al., 1985)
Quality of service, and value offerings address characteristics such as intangibility, heterogeneity, and inseparability. As such, they cannot be counted, nor measured, nor tested prior to the delivery of the service. One way to evaluate the quality of the value offering is by measuring the gap between consumer expected value and consumer perceived value (Parasuraman et al., 1985).
2.2 Supply Chain Management
Theoretical propositions have been put forth on, how to match supply chain configuration with product, market, demand, and consumer characteristics (e.g. Christopher, 2000; Christopher et al., 2006; Fisher, 1997; Mason-Jones et al., 2000). In essence the proposed supply chain strategies are lean, agile, or leagile (combination two earlier mentioned). Lean approaches focus on cost efficiency, but are vulnerable to fluctuations in demand and agile approaches focus on responsiveness towards market fluctuations, but tend to be associated with higher costs (Fearne and Fowler, 2006).
Three complementary approaches for creating a leagile supply chain configuration are proposed by Christopher and Towill (2001): the Pareto rule, base/surge demand, and postponement. Postponement states that the final configuration of the products should be delayed to the latest possible moment. The activities prior to final configuration should be undertaken in a lean fashion and the activities following final configuration should be undertaken in an agile fashion. The lean and agile activities are postponed and separated in a decoupling point (Alderson, 1950; Bucklin, 1965). These activities call for management focusing across company boarders with managers considering the whole supply chain, managing relations with partners, controlling the activities, and organizing for the future (Sandberg and Abrahamsson, 2010). This might be even more important in industries such as the furniture industry, where the wholesalers carry inventory and invest in postponement capabilities, and the retailers are responsible for the communication of these capabilities to the consumers.
Hewlett Packard was able to save money in their distribution network by postponing the final configuration of their products. The requirements were a modularized product and manufacturing design and the strategic location of manufacturing and warehouse facilities.
6
The postponement strategy may result in a higher degree of standardized modules, differentiation opportunities, independent manufacturing of modules, and easier troubleshooting of quality issues (Feitzinger and Lee, 1997). Benetton used postponement to manage their wide range of colours, which helped to strengthen the brand and to increase consumer value with more product variety (Dapiran, 1992). Similarly the Spanish apparel manufacturer Zara manages to bring new products from the drawing board to the stores in two weeks. The responsive approach is facilitated both by the distribution network configuration (Walker et al., 2000) and by Zara’s use of a postponement strategy, which is based on purchasing fabrics in just a few colours and initiating final configuration as late as possible (Walters, 2006).
3 Methodology
This paper is a part of an in-depth case study that was initiated in the summer of 2009, but cooperation with the case company started in 2008. The case study focuses on the connections and interactions between business strategy, demand creation, and SCM. The research has utilized an abductive approach (Kovacs and Spens, 2005) centred on systematic combining (Dubois and Gadde, 2002). The essence of systematic combining is a constant matching between, and direction and redirection of: the framework, the empirical world, theory, and the case (Dubois and Gadde, 2002). The idea for this paper came about as empirical findings showed differences in retailer performance and the search for theory that could explain the differences and how to better manage them.
The case study approach was chosen as the research approach allows the researcher to understand both the studied phenomenon and the complex setting in which the phenomenon occurs (Scandura and Williams, 2000; Yin, 2008). This entails that case studies are concerned with both the studied phenomenon, and the context in which the phenomenon is being studied. As such, this methodology has its benefits and deficits. The case studied holds unique characteristics, with a great complexity and no opportunity for the researchers to control the events. Thus, the case study approach is appropriate. The results thus need to be used to generate hypothesis and models, which are subject to future scrutiny prior to claiming generalizability.
The case study began with 60-90 minutes interviews with key informants representing senior and middle management. Brief interviews and meetings with all employees in the case company followed the initial in-depth interviews. About 25 supply chain partners are included in the data collection, which consists of 35 documented interviews and more than 600 documents of primary and secondary data. The findings presented here are primarily based on sales data from 16 retailers all located in the same geographical area and all but two have the same sales representative from Alpha. Financial data and data from interviews with nine of Alpha’s competitors is also used to provide a better understanding of the context. Representatives from the case company believe that consumers are able visit anyone of the investigated retailers and thus, based on geography, can be assumed to share consumer base. The sales data represents one year of sales for each store (May 2009-March 2010) combined with lists of the display pieces at each investigated retailer. To clarify, a display piece is a unique article number on display at the retailer, a unique piece is one article that may or may not have a display piece. The sampling of the stores was considered important for reducing the number of variables that could potentially distort the data. The retailer with the highest amount of display pieces is called A, and the retailer with the smallest number is called P.
7
The case study utilizes both qualitative and quantitative data, which has been necessary to understand the findings and also is considered appropriate when conducting case studies (Eisenhardt, 1989, Yin, 2008). The iterative process with the case company where findings have been discussed and reviewed continuously helps to ensure construct and internal validity. Findings have also been compared with both established and new theories in order to strengthen external validity (Yin, 2008). The use of multiple data sources, methods and theories is a conscious strategy for achieving data, method, and theory triangulation (Flick, 2009) improving rigor, depth, and breadth of the results, which is comparable with validation (Yin, 2008).
Since the case and the retailers are chosen on theoretical grounds the findings can foremost be generalized to theoretical propositions (Yin, 2008). Due to the longevity, large amount of included companies, and triangulations the findings have high internal validity. The design of the study, however, reduces the generalizability of the findings. The aim of this research is to investigate how retailers affect the value creation for one wholesaler. Thus the methodology is aligned with the purpose of the research. However, the findings need to be adopted in other contexts with caution until they have withstood falsification attempts. The use of well-established methods is not likely to generate any advances in methodology, but helps to improve the quality of the conducted research.
4 Case Study
The case company is a furniture wholesaler located in Sweden. Furniture is designed by the case company, manufactured by suppliers in China, shipped to Sweden for warehousing at Alpha’s distribution centre (DC), and then distributed to retailers as the consumer makes a purchase. Retailers buy display pieces, and rest of the logistics in everyday life sales is completed through order based deliveries through distribution center (in other words retailers do not hold inventory). The case company works with 15 manufacturers, a serving team in China, and has about 400 retailers (customers) in Northern Europe, mainly Sweden. Sourcing activities are undertaken with cost efficiency as the primary goal and distribution activities are conducted in a cost-efficient and flexible manner.
The market demand is heterogeneous with regards to product characteristics, price, and service requirements. Historically Alpha has pursued a low cost and high volume business strategy, but fierce competition and the Internet have turned the low cost segment into a dangerous business environment. In 2004 the case company changed business strategy to differentiate itself on the basis of consumer insight, i.e. a profound understanding of consumer needs that the consumers might not be able to express making Alpha able to deliver superior consumer perceived value. The foundation for the new strategy is NPD, but collaborative forecasting and supplier management have also proven to be important. This new strategy focused primarily on demand creation processes, and therefore giving supply chain processes a role of secondary importance (through having demanding order driven approach).
4.1 New NPD Process
The first time the new NPD process was conducted, it involved interviewing IKEA consumers by approaching them on parking lots and asking them about their purchases and the offered products. The NPD process is nowadays clearly defined in Alpha’s demand creation approach and includes observing and photo documenting potential consumers in their homes. The case company segments its consumers into three groups based on personality and their furniture
8
into three design styles. The two segmentations combined makes a 3x3 matrix called the product platform, which is used for range management. Designs are selected on the basis of the furniture type and consumer segment that is targeted. Contractors carry out consumer investigations and design activities. The case company includes the contractors in their productive borderless organization that also includes the serving team in China, universities, and retailers. Despite the elaborate process of gathering consumer insight the CEO acknowledges that it is hard to identify the true consumer needs. Moreover, the founder/former CEO believes that designers may influence how differentiation opportunities are converted into products. The manager responsible for quality acknowledges that some products are technically impossible to be produced and that manufacturing in China needs to be monitored to avoid deviations from the specifications. In order to increase efficiency in sourcing and to create a flexible assortment the choices of materials and colours are restricted making sourcing reliable and increasing the possibility for consumers to match different furniture in the product range.
One of they key concepts with the new business strategy is flexibility. Furniture is restricted to certain colours and finishes, which allows the consumer to mix and match furniture between different collections and the final configuration of selected furniture is postponed until a consumer order has arrived. The final configuration is based on a modular approach and has been furthest implemented on tables, where the consumer can choose from different sizes of table tops and leg heights and chairs, where the fabric may even be changed. Moreover, the furniture has got added features, e.g. ventilation in media furniture and multiple functions. If this is not displayed correctly at the retailer, the furniture may appear to the consumer as a generic product with much lower price tag.
4.2 The Current Industrial Setting
At first glance it would seem appropriate for wholesalers to open their own retail channels. There are, however, a few problems doing so. First off, with current retail configuration there are several hundreds (if not thousands) available retail options for the wholesalers. Private branded retail stores would also require investments in store locations and tie up capital in showroom pieces. Also, several wholesalers, Alpha included, are specialized in a segment of the furniture market. Thus, furniture from other companies is needed to complement the own products and present the whole range of furniture needed. Specifically for Alpha upholstered furniture, carpets, and interior decoration from other companies complement their products in a showroom setting.
Following the financial crisis in 2008 the Swedish furniture industry has faced hard times. Among the competitors to Alpha, the wholesalers importing from China, has had hard times adjusting to the crisis. So much that the key competitors to Alpha, with China based import, have all faced bankruptcy. Production volumes and lead-times has made it hard to adjust to new, lower, demands. Wholesalers owning their own production capabilities closer to the consumption market have been able to adjust production rate of own products, and also sell capacity to other companies. The decline in economy has also put a lot of retailers out of business. Retailers have faced two tough scenarios. Retailers who rent their store have faced higher rents. Due to large stores, and low sales value per area unit, several stores have lost profitability. The other scenario is retailers who own their own building. The buildings are often large, located away from other stores, and several buildings are in poor condition. When sales have dropped they have a hard time to keep the business afloat, while, at the same time, it is hard to rent or sell the facilities due to the condition and location. This has forced
9
wholesalers and retailers to search for new ways to increase competitiveness. One being the strategy adopted by Alpha.
4.3 From the Distribution Centre to the Consumer
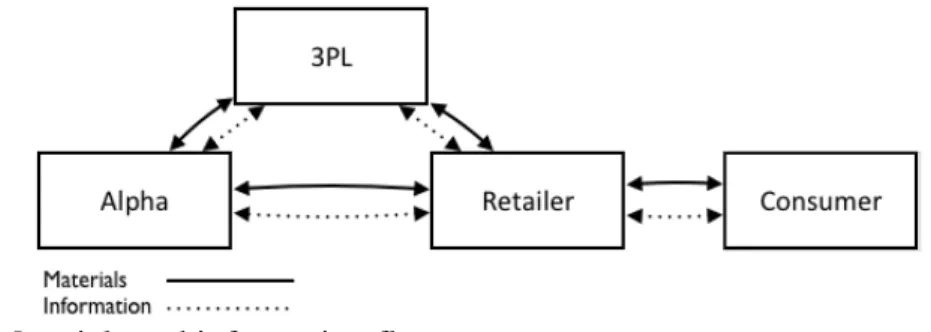
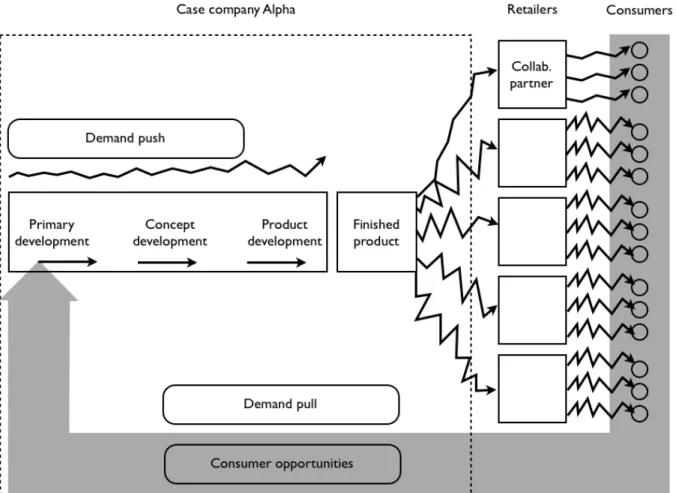
The final configuration is performed at the case company’s distribution centre from where furniture is shipped to the retailers in two ways. The most common is when a 3rd party logistics provider (3PL) with a dominant market position in Sweden picks up furniture that are sorted at the 3PL’s sorting facility and then transported to the retailers. The less common is when a few retailers collect the furniture at Alpha’s distribution centre. The consumer and the retailer are responsible for the final delivery to the consumer. The basic configuration is illustrated in Figure 2.
Figure 2: Materials and information flows
A common conception in the furniture industry is that the sales are dependent on the number of display pieces. Hence, wholesalers focus on pushing as many display pieces as possible onto the retailers. The retailers’ concern is that the display pieces must generate consumer sales to cover both the cost directly associated with the display piece, but also to cover overhead costs, and to generate profit. The case company hopes to increase the sales of the retailers with the flexible postponement strategy and also by providing materials samples and leaflets.
4.4 Retailer Performance
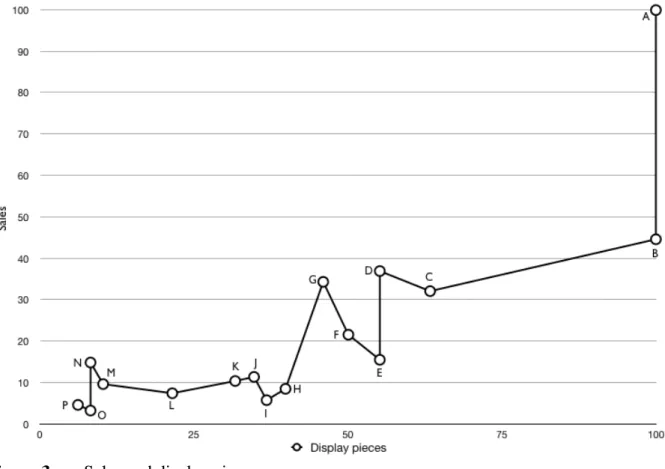
Despite the common conception of the importance of the number of display pieces nor the case company, nor any of the retailers included in the study had any measurements on the relation between sales and display pieces. The retailers were not even able to account for the display pieces used the last year. A first step was to investigate the correlation between display pieces and sales (Figure 3). To hide the retailers’ identity the highest sales volume and the highest number of display pieces are indexed 100. The values have a linear correlation with bad fit on the highest values and can also be fitted to an exponential correlation with better fit for the highest values. Retailers A and B have the same number of placements, but the sales volume of A is more than double the volume of B; retailers C, D, and G have higher sales than E, and F; and retailers M, and N have higher sales than O, and P. Given this data it cannot be stated that the number of display pieces causes sales; the correlation may come from another causative factor.
10
Figure 3: Sales and display pieces
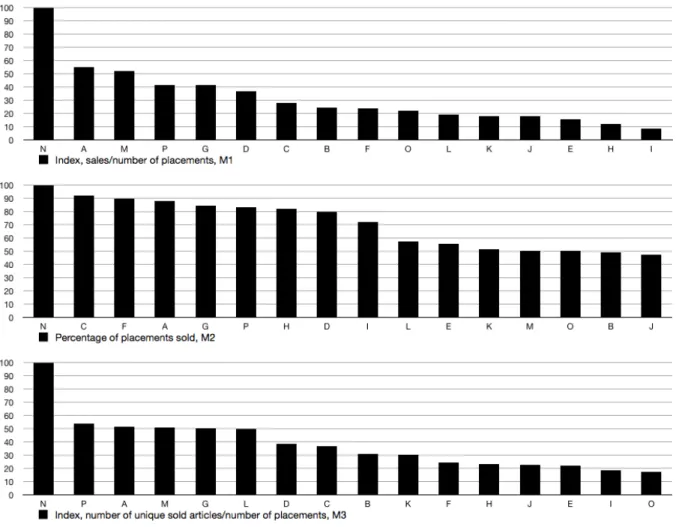
To further investigate the retailers’ performance three performance measures were constructed (Figure 4). Sales/number of display pieces is one way to see how much sale each display piece generates during the studied time period (M1). A high index indicates higher payback on the investment for the retailer and high sales volume for the wholesale. This metric is closely related to the notion in the industry that wholesalers should focus on forcing display pieces on the retailers. The second performance measure is what percentage of the display pieces that are sold at least one time during the investigated period (M2). Even if one display piece can generate sales on other articles its logic is to show things that sell. The third performance measure is an index describing the amount of unique pieces sold per display piece (M3). This indicates the retailers’ ability to show one product, but use their knowledge to generate sales on other products.
11
Figure 4: Retailers' and display pieces' performance (highest values indexed to 100)
Retailer N stands out from the rest of the retailers with the best performance across all three measures (M1-3). Retailers A and B has the same number of display pieces and the difference in sales (Figure 4) is reflected in the difference in M1. Retailer A is not only the highest grossing retailer, but also one of the best with regards of performance measures M1-3. Retailer G has good performance on M1 and M3. Also, retailers M and P perform well especially on M3. Retailer A has a close collaboration with Alpha, which may account for their performance, retailer B’s showroom has been neglected and has just gone through a make over, retailer G has shown high devotion to the store and Alpha’s brand, retailers M and P are product specialists, and retailer N collaborates with another retailer.
4.5 Using Qualitative Data to Explain the Performance
As the retailers were visited and investigations continued at the case company, some explanations started to appear. Retailer A is the retailer with the closest collaboration with the case company of all their 400 retailers. Further, retailer A has designed their showroom in a way that they are able to present the display pieces the way Alpha has intended. However, this collaboration is just happening in the level, where wholesaler alpha want its products to be promoted through showrooms – it is not deeper collaboration, which would mean more involvement on NPD. On the other hand, Retailer B, which has the same amount of display pieces with retailer A, has a showroom that is not catered to and has deteriorated. From the other end, Retailer D is also very good at displaying Alpha’s furniture, and retailer G expressed that they really like Alpha’s furniture and are happy to present them to the consumers. Several retailers do not consider the features of the case company’s furniture and display them with generic products. This is most apparent with the media furniture, since
12
several retailers place them in groups with other wholesalers’ media furniture, which reduces the likelihood of their features to be discovered by the consumers. The retailers also claim that once the price is increased, the consumers’ quality expectations on the furniture increase more than the price would actually indicate. Retailers E, and H are examples of retailers who are not able to display Alpha’s furniture the way intended, and retailer I was the only retailer who did not engage in discussions when visited for research purposes.
One explanation for the correlation between display pieces and sales that were accepted by both retailers and the personnel at the case company was that, if furniture from one wholesaler has good performance at a retailer that retailer is likely to invest more money in display pieces from that wholesaler. As the retailer invests more display pieces from that wholesaler, it is likely that the retailer generates more sales from that wholesaler, which is a positive spiral. Hence, retailers that invest in a few display pieces and show them in an appropriate way to the consumer is likely to increase their sales, while a retailer that does not display the furniture properly is likely to have low sales on that product. In essence, retailers that have the ability to convey information about the value of the product to the consumer is likely to perform better. Retailers and the case company also agree that products that are sold based on price or design do not need the same attention, since it is easy for the consumer to identify, which product is the cheapest or most appealing. Products with innovative features that are not apparent at a first glance, however, require more efforts from the retailer, such as knowledge from the sales staff, information to the consumers, and a thought through display. Thus, products with an obscure value offering require some collaborative efforts to retain or increase their value, while products with apparent value certainly can benefit from collaborative efforts, but do not require it to retain their value.
13
If the process of gathering consumer information is seen as demand pull the process of converting the information to actual products and selling them to consumers can be seen as demand push. During the pull-stage information clarity about true consumer needs is affected by the ability to actually understand consumer need. During NPD the information gathered is passed on to several actors responsible for different processes. The information is retold, and reinterpreted. Moreover, restrictions such as materials, production capabilities, cost, and segmentation models forces the NPD to sway away even further from the true identified need. The empirical data also indicates that the retailers affect the information distortion to varying degree, where retailers with high performance on M1-3 add the least information distortion and therefore is better to convey the innovative value of the product to the consumer (Figure 5).
5 Analysis
The case company utilizes a leagile strategy based on postponement. The supply chain strategy is suitable with the business strategy, since the supply chain is configured with intermediary inventory and the products have modularized designed (Christopher and Towill, 2001). The demand creation initiatives made by the case company has resulted in new differentiation strategies, which is an important part of the case company’s new business strategy in order to achieve a competitive advantage. However, the demand creation and supply chain management should not be seen as a focal company strategy, but a strategy devoted to increasing the performance of the whole chain. Information distortion in demand push indicates that the retailer plays an important role to keep the value of the product intact, until it is in the hands of the consumer. As stated demand creation involves the processes necessary to understand, create, and stimulate demand and if the retailers’ only act as a link in the chain that forwards the physical product, they are only part of the supply chain and not part of the demand creation.
Figure 6: Value gaps, potential points of information distortion
Information distortion in demand push may be better understood if analysed with service quality gaps (Figure 6). The information distortion is likely to create a gap between consumer expected value, and the case company’s perceptions of the expected value (Gap 1). During the
14
NPD process the perceptions of consumer expectations are converted into product specifications. The specifications are likely distorted by the people involved in the process and also by the restrictions in materials and colours (Gap 2). The specified value and the delivered value may vary due to quality issues in manufacturing, but also due to the cultural and geographical distances inherent with the choice manufacture in China e.g. cutting corners in production and material quality (Gap 3). The gap between the delivered value and the communicated value is subject to the retailers’ ability to display and sell the furniture to the end consumers, and also the case company’s abilities to market the products in a correct way (Gap 4). Based on the comments made by retailers on the relation between price and quality there seems to be a gap that was not included by Parasuraman et al. (1985) between delivered value and consumer perceived value (Gap 5). Finally, the gap between consumer perceived and consumer expected value is the most important gap (Gap 6). If the perceived value is higher than the expected value the consumer is likely to be satisfied.
Consumers, the case company, manufacturers, retailers, and 3PLs are all part of the supply chain, but their participation in demand creation is based on their involvement to understand, create, and stimulate demand. The manufacturers do not seem to add to the consumer value of the products, but may restrict the value creation and should therefore only be seen as members of the supply chain. The retailers on the other hand have the ability to fulfil the demand creation criteria, which seems to be related to their ability to minimize information distortion in demand push. The ability to reduce information distortion in demand push is not only an indicator of the participation in the demand creation, but is also a criterion for the supply chain to be exploited to its full potential as the benefits of the postponement strategy is likely to be further utilized by retailers that understand the demand information gathered by the case company during the NPD process.
The difference in M1-3 between retailers A and B (B is roughly 55, 44, and 42 per cent worse than A in M1-3 respectively) may be explained if the logic in the analysis is followed. Retailer A has low information distortion and is a member of the demand creation efforts, and is therefore able to invest in the correct display pieces, generate sales on the pieces that are on display, and utilize the case company’s flexible supply chain and product strategy to generate sales on pieces that are not on display. Likewise, retailer B has high information distortion and is not a member of the demand creation efforts and is therefore unable to invest in the correct display pieces, poor at generating sales on the pieces that are on display, and poor at utilizing the case company’s flexible supply chain and product strategy to generate sales on pieces that are not on display.
Table 1. As interest to showroom declines, so does forecasted sales (based on regression model shown in Appendix A).
15
For the research purposes we gathered quantitative data from all retailers, which were related to sales performance (shown in Figures 3 and 4). As a priori to sales materialization and deliveries, case company Alpha can basically only influence on amount of display pieces (placements) and on the collaboration level with different retailers (that they would be willing to follow instructions on placement of display pieces and their introduction to everyday contacts to potential customers). From earlier analysis we know that display pieces alone do not explain the sales of individual retailer. They have some relationship, but it is not the definite driver. Therefore, we developed regression model, where explaining factors (independent values) were number of placements and level of showroom collaboration. First independent value is known earlier, and latter on was either 1 (collaboration) or 0 (no collaboration). From earlier case study we realized that “real collaboration” is only with retailer A. This was the only one having real showroom collaboration as rest of the retailers were not implementing it as it was desired or did not implement it at all. As Appendix A shows, explanation power of this sort of regression model is very high, 95.1 % (R2). Please note that this relationship and explanation power is so high, if intercept is having value of 0 (only two independent factors account). Actually collaboration is 120 times more valuable than display pieces – basically you may not be able to cover lack of collaboration just with physical furniture.
In earlier case analysis it was concluded that retailers B, E, H and I were different from the rest of the retailers in their lower interest towards showroom activities (retailer I even refused to take a part of research interview). For retailer B this collaboration / no-collaboration addition in the regression model works extremely well – retailer B is actually selling as it is supposed to sell as only display pieces are concerned (they are not installed as required and not in the appropriate showroom). However, retailers E, H and I are all performing even below amount of display pieces would indicate. Not surprisingly, highest deviation from forecasted performance (through regression model) is in retailer I, who did not show any interest for research work. On the opposite, retailer N (high performer in developed measures of M1 to M3) is actually showing highest positive deviation from forecasted sales amounts.
Retailer Diff. to Regression Model
A 0.0% B -0.8% C 11.3% D 32.9% E -59.8% F -4.3% G 39.8% H -111.0% I -187.2% J -37.4% K -37.2% L -30.0% M 52.3% N 75.2% O -13.4% P 40.1%
16
6 Concluding Discussion
This research set out to investigate how retailers affect value creation for a wholesaler who develops innovative products. The main research question is: “How do retailers affect demand creation for a furniture wholesaler selling a flexible assortment with innovative features?” Service quality gaps provide a theoretical explanation for how information distortion can create value gaps that affect the performance of both the demand creation and the supply chain. However, the model needs to be adjusted to accommodate for products instead of services, and to acknowledge that the gaps are part of an intra-organizational, not inter-organizational, construct. Thus, value gaps is a better model to apply in supply chain contexts. The introduction of service gaps theory has therefore been a successful step to better explain the importance of the retailer and differences in retailer performance. Based on the findings in the case study value gaps seem to be of greater importance, if the product is innovative since innovative products are more likely than generic products to include value-adding features not apparent at first glance. Thus, retailers have the ability to both contribute to and constrict value creation based on two findings: If the information distortion is low the retailer is able to communicate the value of the product to the consumer and retailers that understand the case company’s supply chain strategy have the ability to present the consumers with a flexible product assortment.
The findings have been presented to the CEO of the case company, who considered them to be important to consider in the future as well as representative for the current state. Discussions on how to better utilize sales data has been initiated. The purpose is to to more successfully include retailers in the demand creation and thereby decrease information distortion and better utilize the potential of the supply chain strategy. The CEO was presented with the assumption that a strong brand name could help to reduce information distortion during demand push. A strong brand name would presumably result in higher awareness of the products among the consumers, thus reducing the need for retailers to inform the consumers of the products. The CEO believes that this is part of the solution, but that is also necessary to assist the retailers so that they can better understand and communicate the value of the products. This is, however, believed to rely on the case company to produce sale-assisting material and manage marketing. The assumption that a strong brand name will reduce the information distortion, since the consumer is more aware of the product was put forth and the CEO believed that all retailers should and successfully could take part in the demand creation, if the case company focuses their efforts on better communicating the value of their products. Besides focusing on brand name and identical marketing efforts for all retail channels, another way to manage distribution is to develop a differentiated distribution strategy, where retailers are segmented based on their participation in the demand creation. The case company and retailers taking part in demand creation develop unique competences, where consumer value may be increased as a result of decreased information distortion and better knowledge of the opportunities provided by the supply chain.
This research provides some practical and theoretical implications. The first practical implication is that retailer performance is not restricted to the number of placements and that new measures are needed. In the case study this is illustrated by the difference in performance between retailers A, and B. The difference between high performing retailers D, G and N, and low performing retailers E, H and I could also be explained with qualitative information. The second practical implication is that a company focusing on developing innovative products with added consumer perceived value needs to consider to what extent other actors in the supply chain are also involved in the demand creation. This has strong support in theory, but the hands-on approach towards improvement is not established. This research has been put
17
forth three suggestions: Increase the brand value, strengthen the communication with the retailers, and create a differentiated distribution strategy. The main theoretical implications are the refinement of the service quality gap model into a value gap model and the identified connection between value gaps, demand creation, and SCM. The value gap model presents a new way to better understand, how demand creation and SCM are connected. The investigation of performance measurements in the furniture industry should also be considered a theoretical contribution as there are no previous studies that have measured the success of a flexible product strategy in the furniture industry.
Being a single case study exploring a novel area, the findings and implications still need more research before using them for normative purposes. First and foremost, the value gaps model needs to be examined in other contexts to determine weather or not it is suitable for SCM research, and if the gaps are correctly constructed and explained for other settings. In future research, the segmentation model of distribution based on strategic alliances and expansion of the demand creation should be further investigated and expanded to sourcing. Further studies into performance measures of flexible supply chain strategies could also help to increase the understanding of the relation between value gaps, demand creation, and SCM and how value gaps should be managed to increase profitability and competitiveness of the supply chain.
References
Alderson, W. (1950), “Marketing efficiency and the principle of postponement”, Cost and
Profit Outlook, 3, 15–18.
Argyris, C. and Schön, D.A. (1995) Organizationa learning II: theory, method and practice, FT Press, England.
Bucklin, L. (1965), “Postponement, speculation and the structure of distribution channels”,
Journal of Marketing Research, 2(1), 26–31.
Canever, M., Van Trijp, H. and Beers, G. (2008), “The emergent demand chain management: Key features and illustration from the beef business”, Supply Chain Management: An
International Journal, 13(2), 104–115.
Charlebois, S. (2008), “The gateway to a Canadian market-driven agricultural Economy: A framework for demand chain management in the food industry”, British Food Journal, 110(9), 882–897.
Chopra, S. and Meindl, P. (2010), Supply chain management: strategy, planning, and
operations, Pearsons, Upper Saddle River, NJ.
Christopher, M. (2000), “The agile supply chain: competing in volatile markets”, Industrial
Marketing Management, 29(1), 37–44.
Christopher, M., Lowson, R. and Peck, H. (2004), “Creating agile supply chains in the fashion industry”, International Journal of Retail and Distribution Management, 32(8), 367– 376.
Christopher, M., Peck, H. and Towill, D. (2006), “A taxonomy for selecting global supply chain strategies”, International Journal of Logistics Management, 17(2), 277–287.
18
Christopher, M. and Towill, D. (2001), “An integrated model for the design of agile supply chains”, International Journal of Physical Distribution and Logistics Management, 31(4), 235–246.
Dapiran, P. (1992), “Benetton, global logistics in action”, International Journal of Physical
Distribution & Logistics Management, 22(6), 7-11.
Dass, M. and Kumar, P. (2012), “Assessing category vulnerability across retail product assortments”, International Journal of Retail & Distribution Management, 40(1), 64-81.
De Treville, S., Shapiro, R. and Hameri, A-P. (2004), “From supply chain to demand chain: The role of lead-time reduction in improving demand chain performance”, Journal of
Operations Management, 21(6), 613–627.
Dubois, A. and Gadde, L.-E. (2002), “Systematic combining: an abductive approach to case research”, Journal of Business Research, 55(7), 553-560.
Eisenhardt, K.M. (1989), “Building theories from case study research”, Academy of
Management Review, 14(4), 532-550.
Esper, T., Ellinger, A., Stank, T., Flint, D. and Moon, M. (2010), “Demand and supply integration: A conceptual framework of value creation through knowledge management”, Journal of Academic Marketing Science, 38(5), 5–18.
Fearne, A. and Fowler, N. (2006), “Efficiency versus effectiveness in construction supply chains: The dangers of ‘lean’ thinking in isolation”, Supply Chain Management: An
International Journal, 11(4), 283–287.
Feitzinger, E. and Lee, H. (1997), “Mass customization at Hewlett-Packard: the power of postponement”, Harvard Business Review, January-February, 116-121.
Fisher, M. (1997), “What is the right supply chain for your product?”, Harvard Business
Review, 75(2), 105–116.
Flick, U. (2009), An introduction to qualitative research methods, Sage Publications Ltd, London, UK.
Hamister, J. W. (2012), “Supply chain management practices in small retailers”, International
Journal of Retail & Distribution Management, 40(6), 427-450.
Heikkilä, J. (2002), “From supply to demand chain management: Efficiency and customer satisfaction”, Journal of Operations Management, 20(6), 747–767.
Hilletofth, P. (2010), “Demand-supply chain management”, Doctorial Thesis, Chalmers University of Technology, Gothenburg, Sweden.
Hilletofth, P. (2011), “Demand-supply chain management: industrial survival recipe for new decade”, Industrial Management & Data Systems, 111(2), 184-211.
Hilletofth, P. (2012), “Differentiation focused supply chain design”, Industrial Management
19
Hilletofth, P. and Eriksson, D. (2011), “Coordinating new product development with supply chain management”, Industrial Management & Data Systems, 111(2), 264-281.
Jacobs, D. (2006), “The promise of demand chain management in fashion”, Journal of
Fashion Marketing and Management, 10(1), 84–96.
Jones, Peter, Daphne Comfort, Colin Clarke-Hill & David Hillier (2010). Retail experience stores: Experiencing the brand at first hand. Marking Intelligence and Planning, 28(3), pp. 241-248.
Jüttner, U., Christopher, M. and Baker, S. (2007), “Demand chain management: integrating marketing and supply chain management”, Industrial Marketing Management, 36(3), 377–392.
Khan, O. and Creazza, A. (2009), “Managing the product design-supply chain interface: towards a roadmap to the ‘design centric business’”, International Journal of Physical
Distribution & Logistics Management, 39(4), 301-319.
Kovács, G. and Spens, K. (2005), “Abductive research in logistics research”, International
Journal of Physical Distribution & Logistics Management, 35(2), 132-144.
Kärkkäinen, H., Pippo, P. and Tuominen, M. (2001), “Ten tools for customer-driven product development in industrial companies”, International Journal of Production
Economics, 69(2), 161–176.
Langabeer, J. and Rose, J. (2002), “Is the supply chain still relevant?”, Logistics Manager, 11–13.
Lee, H., and Whang, S. (2001), “Demand chain excellence”, Supply Chain Management Review, March/April, 41–46.
Leonard, D. and Rayport, J.F. (1997), “Spark innovation through empathic design”, Harvard
Business Review, November-December, 102-113.
MacMillan, I. and McGrath, R. (1997), “Discovering new points of differentiation”, Harvard
Business Review, July-August, 133-145.
Mason-Jones, R., Naylor, J. and Towill, D. (2000), “Engineering the leagile supply chain”,
International Journal of Agile Management Systems, 2(1), 54–61.
Mentzer, J., DeWitt, W., Keebler, J., Min, S., Nix, N., Smith, C. and Zacharia Z. (2001), “Defining supply chain management”, Journal of Business Logistics, 22(2), 1–25. Nsairi, Z. (2012), “Managing browsing experience in retail stores through perceived value:
implications for retailers”, International Journal of Retail & Distribution
Management, 40(9), 676-689.
Parasuraman, A., Zeithaml, V.A. and Berry, L.L. (1985), “A conceptual model of service quality and its implication for future research”, Journal of Marketing, 49(Fall), 41-50. Piercy, N. (2002), Market-led strategic change, Butterworth-Heinemann, Oxford, UK.
20
Prahalad, C. and Ramaswamy, V. (2000), “Co-opting customer competence”, Harvard
Business Review, January-February, 79-87.
Prahalad, C. and Ramaswamy, V. (2004), “Co-creating unique value with customers”,
Strategy & Leadership, 32(3), 4-9.
Rainbird, M. (2004), “Demand and supply chains: the value catalyst”, International Journal
of Physical Distribution & Logistics Management, 34(3/4), 230-250.
Sandberg, E. and Abrahamsson, M. (2010), “The role of top management in supply chain management practices”, International Journal of Retail & Distribution Management, 38(1), 57-69.
Scandura, T.A. and Williams, E.A. (2000), “Research methodology in management: current practices, trends, and implications for future research”, Academy of Management
Journal, 43(5), 1248-1264.
Simonson, I. (1993), “Get closer to your customers by understanding how they make choices”, California Management Review, 35(4), 68-84.
Van Kleef, E., Trijp, H. and Luning, P. (2005), “Consumer research in the early stages of new product development: A critical review of methods and techniques”, Food Quality and
Preference, 16(3), 181–201.
Vollmann, T. and Cordon, C. (1998), “Building successful customer-supplier alliances”, Long
Range Planning, 31(5), 684–694.
Walker, B., Bovet, D. and Martha, J. (2000), “Unlocking the supply chain to build competitive advantage”, The International Journal of Logistics Management, 11(2), 1-8.
Walters, D. (2006), “Demand chain effectiveness – supply chain efficiencies: a role for enterprise information management”, Journal of Enterprise Information, 19(3), 246-261.
Walters, D. (2008), “Demand chain management + response management = increased customer satisfaction”, International Journal of Physical Distribution and Logistics
Management, 38(9), 699–725.
Walters, D. and Rainbird, M. (2004), “The demand chain as an integral component of the value chain”, Journal of Consumer Marketing, 21(7), 465–475.
Yin, R.K. (2008). Case Study Research: Design and Methods, Sage Publications, London, UK.
Zeithaml, V., Bitner, M. and Gremler, D. (2009) Services Marketing – Integrating Customer
21
Appendix A – Regression model for forecasting sales of each retailer as items selected
include amount of placements and collaboration (absolute numbers of coefficients and standard error scaled not to report confidential data).
SUMMARY OUTPUT Regression Statistics Multiple R 0.975 R Square 0.951 Adjusted R Square 0.876 Standard Error 8443.0 Observations 16 ANOVA df SS MS F Significance F
Regression 2 4.3752E+12 2.1876E+12 136.39 1.88961E-09
Residual 14 2.2455E+11 1.6039E+10
Total 16 4.5997E+12
Coefficients Standard Error t Stat P-value
Intercept 0 #N/A #N/A #N/A
Collaboration 60375.01 9726.97 6.21 0.0000