Energiting 2009, March 11-12 at Älvsjö fair, Stockholm. E d it or s: D ah lq u is t E . a n d P al m J .
2
0
0
9
P
ro
ce
ed
in
gs
o
f
th
e
S
ci
en
ti
fi
c
C
on
fe
re
n
ce
o
n
E
n
er
gy
a
n
d
I
T
a
t
A
lv
sj
o
fa
ir
,
S
to
ck
h
ol
m
M
ar
ch
1
1-12
, 2
00
9
in
c
on
n
ec
ti
on
w
it
h
t
h
e
“E
n
er
gi
ti
n
ge
t
20
09
”
This is a joint scientific conference on Energy and IT between Mälardalen University and the Research School Program Energy Systems in Cooperation with Swedish Energy Agency. The papers are peer reviewed. ISBN number 978-91-977493-4-3.
MDH
Alvsjo fair, Stockholm March 11-12, 2009
Proceedings of the Scientific Conference on Energy and IT at Alvsjo fair, Stockholm March 11-12, 2009 in connection with the “Energitinget 2009”
Editors: Dahlquist E. and Palm J.
This is a joint scientific conference on Energy and IT between Mälardalen University and the Research School Program Energy Systems in Cooperation with Swedish Energy Agency. The papers are peer reviewed.
ISBN number 978-91-977493-4-3.
Energy savings potentials and social change in the use of residential electricity Mats Bladh,
Adoption of energy efficiency measures in detached houses: Perception of homeowners Giresh Nair, Mid Sweden University
Households, energy use and scenarios of energy efficiency of everyday life activities Anna-Lisa Lindén, Lund University
The role of energy advisors on adoption of energy efficiency measures in detached houses Krushna Mahapatra, Mid Sweden University
Perceptional and socio-economic factors in adoption of low energy houses Krushna Mahapatra, Mid Sweden University
Consumption patterns today and tomorrow with respect to energy and how the energy
system will be affected by this
Iana Vassileva, Malardalen University
CO2 emissions from general district heat use in Sweden – a method for justified comparisons in residential energy use
Magnus Åberg,
Applying an interdisciplinary perspective on industrial energy efficiency Jenny Palm, Dept. of Technology and Social Change, Linköping University and the national research school the Energy system Programme
Markov-Chain Modelling of High-Resolution Activity ,Patterns and Household Electricity Demand
Joakim Widén, Department of Engineering Sciences.Uppsala University
From electricity to heat – a discourse analytic policy study of energy conversion at national, municipal and household level
Karin Perman, Energi och Miljöteknik, University College Dalarna Case study of mobilized energy storages for distributed heating
Bio-refinery system of DME or CH4 production from black liquor gasification in pulp mills
M Raza, Energy Processes, KTH
Numerical and experimental study of the inclined free fins applied for thermal management Bijan Karimpourian, Malardalen University
Simulation of ambient temperature effect on large-scale power transformer load ability Hasan Gholinejad, Malardalen University
Process control in steel core production to optimize of power dissipation in electrical machines and transformers
Kourosh Mousavi Takami, TDI, Malardalen University
Evaluation of magnetic aging in transformers and electrical machines cores during operation
Kourosh Mousavi Takami, TDI, ACECR, Malardalen University
A simple method for removing leakage of metal pipes, like district heating- and NG pipes Mohammad Tabatabaeeghomi, Mälardalen University, Vasteras, Sweden also Technology Development Institute (TDI), ACECR, Tehran, Iran
Modeling of Radon Transport trough Building Materials and ventilation
Keramatollah Akbari, TDI, ACECR, Malardalen University
Energy efficient window development – Historical overview of the development of energy efficient windows in Sweden
Paper No.:1
Energy saving potential and social change in the use of residential electricity
Mats Bladh, Tema, Linköping University
ABSTRACT
The European Union is implementing the eco-design directive, which means for example a phase-out of inefficient equipment, such as those with stand by-function or lamps with a low lumen/Watt-ratio. How much energy will be saved from this? The Swedish Energy Agency has collected detailed measurement data from 400 households in Sweden. Based on that, and on interviews and visits, savings potentials in the use of lighting have been estimated. Possible reductions are quite big, but very diverse. Realistic estimations can be reached using real householder’s possession and hours-of-use of lamps and stand by-functions. In the case of lighting two levels of reduction will be estimated and discussed: one level when incandescents are replaced by CFLs, and another when they are replaced by LEDs. The latter, however, may be associated with rebound effects since a whole new repertoire of lighting design opens up.
Social change can both promote and counteract energy savings in residential electricity use. Consumption differs between different types of households, and the household structure is changing in many countries. Based on quantitative data from Sweden the following differences will be addressed:
Are female householders thriftier than male? Single person households will be compared. This is of interest for the future if women continue to get a more economically autonomous position in many countries.
Do single person households consume more energy per person than others? Presumably this is so since co-use of electric equipment is lost when the number of people decreases in the average household. This is a tendency counteracting energy savings due to eco-design directives, and of interest if single living is becoming more common in many countries.
Do pensioners have a lower consumption than younger people? This is not obvious. Older people may combine a thrifty lifestyle with older equipment. This is of interest for the future since the elderly is a growing part of the population in many countries, and whether the thrifty lifestyle depends on lower income for pensioners, or on habits acquired during earlier years. If the latter is correct the thrifty lifestyle may disappear with coming generations of pensioners that has become used to a high consumption level.
Introduction
In many countries a phase-out of incandescent lamps is proposed or decided. The committee for eco-design within the European Union has prepared a phase-out of import of lamps with low lumen per Watt, suggested to begin in September this year. This should be seen as part of a large program of reducing carbon dioxide emissions, since about 80 per cent of power production
within EU is based on fossil fuels. Saving electric energy in the residential sector would contribute to that.
Reductions seem to be hard to achieve, however. Despite energy efficiency programmes at EU and national level electricity consumption has grown. Bertoldi and Atanasiu point at several factors behind this growth: A growing number of appliances, both of new and old types; Increased hours-of-use for some appliances; Larger dwelling areas; Older population spending more time at home.1
Thus two tendencies are at work at the same time—one reducing end-use, and another increasing it. An obvious example from Sweden is the decision to introduce digital-TV, forcing many homeowners to buy a set-top box for the purpose in 2006 and 2007, and the eco-design directive in 2008 of limiting stand by-consumption on such appliances to 1 Watt. In this paper I will analyze these tendencies using data from Sweden, with special focus on residential lighting. Data comes from measurements in detail of electricity consumption in 400 households, arranged and collected by the Swedish Energy Authority. In principle, data for each lamp and other specific appliances six times per hour was monitored. Added to this, interviews were made with a limited number of households. I will also discuss social structure and change in social structure, based on official statistics.
A study of nine households
Quantitative data in detail and interviews results in a huge amount of information. Therefore only a small number of households could be studied. What is lost in possible generalization to the whole population is gained in detail.
Consumption of electric energy for lighting is a complex matter. In order to give a structure to the findings I will begin with a simple formula: Electric energy consumed for lighting = Number of lamps x Wattage x Hours-of-use.
The number of lamps differs a lot between households. This depends not only on the area of the dwelling, but also on the type of house and on culture. Dwellings in detached houses generally have a garden, where lighting often is installed. Out-door lighting at the garage, at the entrance, etc. is paid for by the home-owner. Residents in apartments in multi-family houses, on the other hand, make use of lights in the stairwell, in the common laundry and other collective areas, but they do not pay for it directly. It is hard to make a fair comparison between the two types living. When it comes to lighting the asymmetry should not be exaggerated, if outdoor lighting can be isolated.
Secondly, most of the householders interviewed emphasized “cosiness” as important when they were asked about their choice and use of lighting. This is perhaps an indication of a Nordic lighting culture, comparable to the Norwegian habits shown in a famous article by Wilhite et al.2
1
Paolo Bertoldi & Bogdan Atanasiu, Electricity Consumption and Efficiency Trends in the Enlarged European Union. Status Report 2006. Institute for Environment and Sustainability, 2007. European Commission, Directorate-General, Joint Research Centre, EUR 22753 EN. European Communities, 2007. 2
In such a culture many small lamps are installed, also in windows, for the sake of creating a nice and warm atmosphere in the home. Such a preference structure make Swedes accessible for new types of decorative lighting, such as glowing stripes to put around a tree, and small halogen lamps retracted in the ceiling. It is a custom in Sweden since long to put special Christmas lights in windows during December. This kind of “cosy” lighting may well be extended to new forms of decorative lightings. But the “cosy” also means a preference for tea lights and candles. However, families with children and a disabled man declared in the interviews that they were afraid of causing fire.
Another aspect on the number of lamps is a difference between lamps and lighting points. Quite a few of the lamps are turned on and off at the same time. This goes for the fashionable retractable halogen spotlights we could see at our visits in the nine homes. While each individual lamp had 20W, the user actually turned on 120 or 160 Watts.
Turning now to wattage another discrepancy between single-family and multi-family houses must be taken into account. As a general rule property-owners of multi-family houses install fluorescents in the kitchen and in the bathroom—this goes with the rented apartment and is not the choice of the householder. Householders in detached houses generally choose all lighting themselves.
In the nine households taken together there were 316 lamps measured.3 Of these 316 lamps 53% were incandescents, 27% halogens, 13% fluorescents, and 8% CFLs. A majority of the lamps, 64%, had wattage in the range between 20 and 49 (27% from 0 to 19, and 2% 100W and above). Lighting points had bigger shares for higher wattage classes (see Table 1 below), an illustration of the effect of serial coupling.
Interviews revealed that power, Watt, was associated with intensity of light, also among households with one or a few CFLs installed. Wattage is taken as a guide for replacement, so that a 40W-bulb replaces a broken 40W. Watt is not associated with electricity consumption. This is an important aspect when energy efficiency measures are to be considered. I will get back to this in the concluding discussion.
In dwellings with a large area it is possible install a larger number of lamps and higher sum of Watt, while a smaller area in general limits installations. But when only one or two persons live in a detached house, as was the case with a retired couple, the number of lamps used at the same moment in time or during a 24-hour period, is quite small. All of the households studied used only a minor share of the wattage possible to use, including the household consisting of two adults and a small child living in a small apartment. This family used 24% of its potential wattage at its highest single point in time, while the older couple had a maximum of 5%. Over a longer analysis of household energy use behaviour in Japan and Norway”, Energy Policy, vol. 24, no 9, 1996, 795-803.
3
At our visits in respondent’s homes we registered a larger number of lamps than on the installation sheet used by the firm doing the actual monitoring, amounting to the sum of 391. Visits were made approximately one year after measuring period, so residents may have made changes in the meantime. But it is not probable that a bathroom with no window would have been without lighting, or that no lamps in the bedroom had been monitored while lamps in all other rooms had.
period between 2 and 11% of installed wattage was used (Watt-used = Wh per day/Hours-of-use per day).
Hours-of-use is dependent on presence in the home. As a rule both men and women are employed (77% women and 83% men) and thus spending time outside their homes.4 Even though the housewife has disappeared, presence in the home may have increased due to work from home in some occupations. A retired couple spent more time at home than a young working couple did. However, retirees can be active away from home as well, and young people uses parental leave benefits when the children are small. In fact, a family with three children had the highest estimated presence in the home.
Absence from home is modified by the use of timers. One respondent, a young single woman, regularly used a timer for turning on a lamp in the living room before coming home from work in the late afternoon. A more frequent use of timers, though, was for turning on and off lamps at predetermined hours during the evening (in the garden or indoors) when residents were at home. One reason for this was to scare off burglars, but more often for the atmosphere these lights brought.
Table 1. The number of lamps, lighting points and average hours-of-use in four classes of wattage for nine households.
WATTAGES LAMPS LIGHTING POINTS HOURS OF USE
1-19 85 26 3.5
20-49 203 73 2.4
50-99 21 37 1.5
100- 7 24 1.4
Aggregated data for nine households. Hours with decimals.
Lighting points with lower wattage is used longer than lighting points with higher wattage (see Table 1). To a certain degree this is explained by the longer hours for CFLs. While incandescent lamps and halogen lamps were lit 1.8 hours per day, and fluorescents, 2.1 hours, CFLs were used twice as long, or 4.2 hours per day.
This is not an indication of a “rebound effect”, though. Possibly incandescents have been replaced with CFLs in lighting points with long burning hours regardless of lamp type used. Only one person, a young single woman, said that it was acceptable to use a CFLfor more hours than an ordinary lamp. A careful study of this householder’s use of one of her four CFLs over a month, showed that it was impossible for her to undo the saving from replacing an incandescent with a CFL. It would have required 39 hours per day. There may be a rebound effect, but it is certainly limited.
A surprising finding was that a single lighting point consumed a very big part of total electricity consumption for lighting purposes—in one case 53% and in another 73%. In both cases a fixture very popular in Sweden,called Uplight, was used, combining one halogen lamp of 300W directed
4
at the ceiling, and one for reading of 50W. Since the upward lamp is used for background light it is used for a longer time than what is usual for the households in question.
Information in detail from the nine households make it possible to simulate the magnitude of savings if all remaining incandescent lamps were replaced by CFLs. The realism in this is that actual hours-of-use and actual number of lamps installed is the base for the simulation. I have assumed that the general recommendation that, for example, a 40W incandescent can be replaced by a 9W CFL holds, and that there is no rebound. The latter assumption can be questioned because interviews with householders showed dissatisfaction with the delay in reaching full illumination, and this may in turn lead people to avoid turning them off as they would have done with other types of lamps.
The simulation resulted in a substantial reduction in consumption of electric energy for lighting. Reductions varied between 16 and 78%. From this small sample it is dangerous to generalize, however, but a possible level of reduction at 50% seems probable.
Table 2. The level of energy consumption for lighting after simulated replacement of remaining incandescent lamps in nine households. Per cent of actual level.
HOUSEHOLD SIMULATED LEVEL
SINGLE YOUNG 55 SINGLE MIDDLE-AGE 22 SINGLE OLD 78 COUPLE YOUNG 40 COUPLE MIDDLE-AGE 41 COUPLE OLD 54 FAMILY YOUNG 39 FAMILY MIDDLE 3 84 FAMILY MIDDLE 5 70
CFLs are easy to find in many shops in Sweden, and at affordable prices. It is possible to find them in shape and form suitable for existing fittings. However, CFLs contains mercury, one of the most poisonous substances we know. A better alternative would be Light-Emitting Diodes, LEDs. A similar simulation would lower the possible level even further. But this is not a realistic option today for Swedish households.
The supply of LED-lights in Sweden today is limited from a substitution point of view. What is offered now, in Spring 2009, are clamp, table, wall, pendant and floor lamps with a concentrated
ray of light and a cold, blue colour of the light. Only one bulb-shaped LED with a screw-socket was found. The cold blue light and intensity of light comparable to that of a 15W incandescent lamp, diminishes its role as a substitute.Fixtures are mostly very small and quite far from ordinary design standards. LED spotlights seem to be a possible substitute for halogen spotlights retracted in the ceiling.5
The supply is also broad from an extending-the-use-of-lighting point of view. Many LED-items are meant for complementary and extended use, for example stripes to be placed in staircases, thin plates to be retracted in the bathroom floor, or in the shape of stones to be put in the garden. Such items may have aesthetic value, and their energy consumption is marginal, but they do not replace high wattage lamps.
The situation for the supply of LED today will most probably change in the years to come. LED-lights are developing quickly, including adaptation to AC without additional device, and offer a potential for very low energy consumption.6 LED-modules at 1 or 2W and with a warmer light can in the future replace conventional lighting for many purposes. In view of such prospects for LED the CFL seem to be a transitional solution.
Social change
Electricity consumption in the residential sector has grown in the long term. Electric heating increased from 9 TWh in 1978 to 24 TWh in 1987, and then decreased to 17 TWh in 2000 (the same in 2005). Residential electricity, including electricity use in collective spaces in multi-family houses, increased from 17 TWh in 1985 to 27 TWh in 2003 (26 in 2005).7
A growing consumption may be the result of an increasing number and increased use of electrical devices in the home. For example, loading batteries for a large number of mobile telephone terminals, diffusion of broadband equipment, introduction of plasma display TV-sets, etc. However, new technology may not be the only cause for increasing consumption. I will here analyze changes in the social structure (household structure in regard to the number of people and to age distribution) and a possible difference between men and women.
Households comprise different number of people, one person, two persons etc. Dwelling area and basic equipment is not proportionate to the number of persons. Single person households have lighting, TV etc., which is often used collectively in households with more than one person. Thus a changing distribution on different household sizes influences consumption not only for new technology but also for mature items.
5
The supply of LED was mapped through study of homepages published by Ljusexperten, IKEA and Clas Ohlson in February 2009. New LED-supply was mapped from homepages published by Philips Sweden and Osram Sweden.
6
For an example of AC adaptation see http://www.optoga.se, ”Acriche”. 7
Updated time-series from Mats Bladh, Hushållens elförbrukning. Tema-T Working Paper, 291. Department of Technology and social change, Linköping university, 2005. Collective electricity consumption in multi-family houses is not included in ”household electricity use” in statistics published by the Swedish Energy Agency.
Furthermore, two different household structures result in different number of households when the total number of people is given.A thought experiment can clarify this. Let us assume a country with 10 million inhabitants. In one extreme case there are 5 million one-person households and 1 million five-person households. This gives a total of 6 million households. In another case there are 2 million five-person households. This gives a total of 2 million households. Thus, in the first case there will be a need for 6 million dwellings, and in the second case 2 million. And not only the dwelling, but all items and services that is associated with the current standard of living.
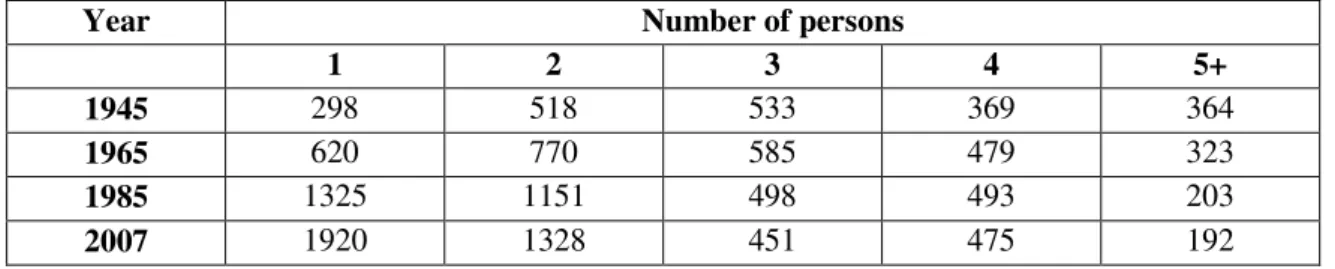
In Sweden the distribution of household size has changed in the long term. The share of small households, especially those with one person, has increased since 1945, while the biggest households have decreased. There are probably many reasons behind this development. Gainful employment among women is one important aspect, changes in legislation concerning divorce is another, changes in the care for the elderly away from institutionalized living is a third, improved financial support for students and for pensioners are other aspects.
Table 3. Distribution of household size in Sweden 1945, 1965, 1985 and 2007. Thousands.
Year Number of persons
1 2 3 4 5+
1945 298 518 533 369 364
1965 620 770 585 479 323
1985 1325 1151 498 493 203
2007 1920 1328 451 475 192
Source: Statistics Sweden. Censuses 1945-1985. Household economy 2007.
The household structure in many other European countries follows the same pattern, even though data and definition of “household” differs somewhat. Data covering 25 European countries comparing the distribution of the early 1980s with the early 2000s, shows only one exception to this tendency (Estonia). In Greece the share for one-person households increased from 15 to 20% between 1981 and 2001, while the share for five and more-person households decreased from 16 to 11%. In Hungary the equivalent figures were from 20 to 26% (one person) and from 11 to 9% (five or more).8
From the monitoring study electricity consumption for lighting in different household sizes has been used for a counterfactual estimation. Data shows that electricity consumption is bigger in larger households, but not in proportion to the number of people. This is an indication of a loss of co-use of lighting, and this loss will add to the growth of consumption beside an increasing number of households due to a growth in population and other causes for increasing consumption. If Sweden had the same household structure in 2007 as it did in 1980, electricity consumption for lighting would have been 0.34 TWh (12.5%) less than it actually was. Furthermore, if other countries follow the same path when it comes to household structure as Sweden has, it would be interesting to estimate what this would mean in terms of electricity consumption. Using Swedish
8
Housing Statistics in the European Union 2004. National Board of Housing, Building and Planning, Sweden & Ministry for Regional Development of the Czech Republic. Boverket, 2005, p 23.
electricity consumption data and comparing the factual Greek household structure with that of the Swedish, the aggregated consumption increases with 1 TWh or 36%. Using the same procedure for Hungary, the increase is 0.7 TWh or 24%.
However, the absolute level of the figures should not be taken as fixed facts. Data for different groups must be weighted according to population statistics first—but relative values for different households sizes holds.
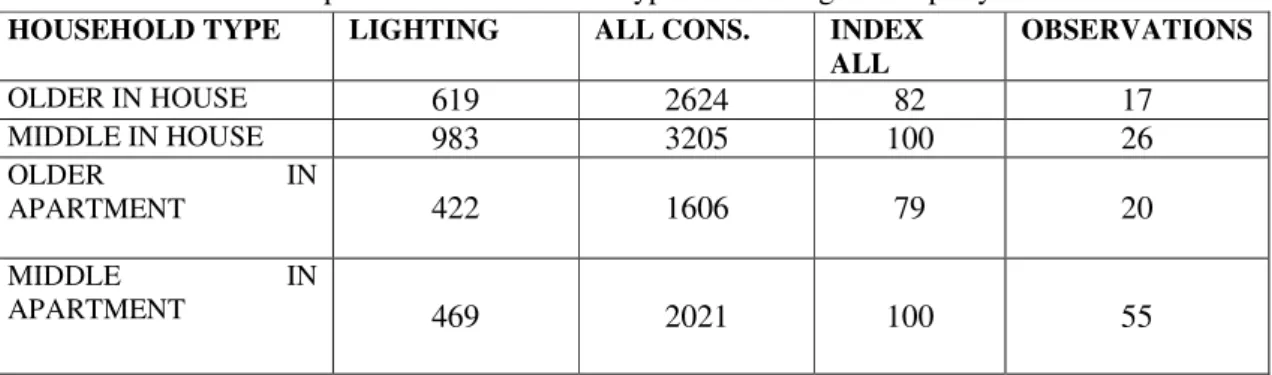
Another aspect on change in the household structure is the growing share for the elderly. Data from the monitoring study is used, but in this case the whole data set cannot be used since the number of households with older people are very few in household sizes with more than two persons. I have defined the elderly as those with an age of 65 years or more at the time of measuring, and I will compare them with households in the age between 18 and 64 years. Since the monitoring study comprises only a few elderly living in detached houses (which has become common in Sweden for this age group), I have added two-person households, excluding those with one member below the age of 65.
Table 4. Electricity consumption for lighting and for all purposes in old-aged and middle-aged one- and two-person households and type of dwelling. KWh per year. Index.
HOUSEHOLD TYPE LIGHTING ALL CONS. INDEX
ALL OBSERVATIONS OLDER IN HOUSE 619 2624 82 17 MIDDLE IN HOUSE 983 3205 100 26 OLDER IN APARTMENT 422 1606 79 20 MIDDLE IN APARTMENT 469 2021 100 55
Older = 65 years of age and above. Middle = 18-64 years.
There seem to be a difference between households with older and with younger people. Intuitively this is not obvious. Eyesight usually gets worse when people get older and therefore more light is needed. Older people sleep less than middle-aged people. Pensioners stay at home more, and the elderly are used to incandescent lamps and are latecomers when new types of lighting is introduced. In favour of the hypothesis that the elderly consume less electricity we find three factors. Pensioners have lower income and are therefore forced to economize. Secondly, older people have grown up under poorer conditions, and by habit they continue to economize on lighting and other uses of electricity. Thirdly, older people move from larger to smaller dwellings where less electricity is used.
However, the result in Table 4 is not robust considering the small sample and the wide spread among households. Individual differences are very large, so that middle-aged households show a low consumption, while older householders have high (the lowest value for middle-aged households in detached houses was 683, and the highest value among the elderly in the same type of dwelling was 2142).
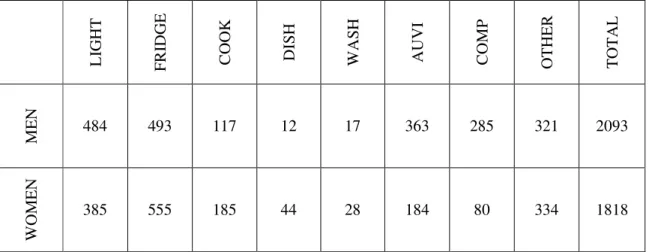
Are there systematic differences between men and women? It has been shown that men uses the car more often than woman, and therefore consumes more fuel.9 What about electricity? Gender roles tell us that women cook more and men use the computer more. If women are more concerned about creating a nice atmosphere at home by the choice of light, what would that mean in electricity consumption for lighting? Traditional gender roles exist, but individual differences are actually bigger than the difference between the average man and the average woman. Is it possible to detect gender differences in the measurement study?
In this part I have picked out only one-person households. This clears away doubts concerning compromises between men and women in mixed households. Furthermore, only households in multi-family houses, because observations are few of households in small houses, and because there are different conditions in the two types of dwellings.
Table 5. Electricity consumption among male and female one-person households. KWh per year.
L IG H T FR ID G E C O O K D IS H W A SH A U V I C O M P O T H E R T O T A L M E N 484 493 117 12 17 363 285 321 2093 W O M E N 385 555 185 44 28 184 80 334 1818
Fridge = refrigerator, freezer, chiller. Cooking = stove, oven, microwave oven, and other cooking utensils. Dish = dishwasher. Wash = washing machine in apartment, not in common laundry. AuVi = audiovisual equipment, stereo, TV, video, set-top box, DVD, etc. Comp = computer, printer, broadband equipment, etc. Other = non-separable and not specified.
Table 5 shows 13% lower consumption for the average woman in single-person households participating in the monitoring study (and 20% lower for lighting). The table also reflects traditional gender roles in that electricity consumption among women is higher for storing food, cooking, dishing and washing, while men consumes more energy for audiovisual and computer-related equipment. The difference between men and women concerning lighting is harder to explain.
The spread is big, even when observations are narrowed down to singles in multi-family houses. The maximum value for lighting was 1252 kWh per year, while the minimum value was 48. The maximum value for all other electricity consumption except lighting was 2919, while the
9
Annika Carlsson-Kanyama & Anna-Lisa Lindén, ”Energy efficiency in residences—Challenges for women and men in the North”, Energy Policy 35 (2007) 2163-2172. Annika Carlsson-Kanyama & Riitta Räty, Kvinnor, män och energi: makt, produktion och användning. Rapport FOI-R-2513-SE. FOI, 2008.
minimum value was 717. Differences between individual households are huge. And there is no correlation between consumption for lighting purposes and all other purposes. A correlation coefficient of 0.15 is close to zero, and indicates a non-correlation. Such huge differences appear all over—when data is arranged according to gender, number of people in the household, type of dwelling, appliances or area. Based on 187 observations of households living in detached houses correlations between area and lighting, area and all other consumption, and area and total consumption, gave correlation coefficients in the range of 0.13 and 0.17! The main lesson from the monitoring study is that consumption of electricity varies greatly between individual households.
Concluding discussion
The main lesson from the monitoring study is that consumption of electricity varies greatly between individual households. Dispersion is huge. This does not mean that there are no patterns or correlations at all. The loss of co-use in smaller households, higher consumption in dwellings with larger areas, gender patterns and differences between older people and younger, may very well exist, but these patterns are hard to detect and prove since they drown in a sea of individual differences.
Why such a large dispersion? Probably the correlation runs not between social or subjective aspects on one hand, and energy on the other. It is mediated. People do not use energy, they use lamps, computers, washing machines etc., and these items require electricity in order to function. Technology comes in between the user and energy consumption. Let U stand for user, T for technology, and E for electricity, then relations could be illustrated in this way:
(U–T)–E
The parenthesis marks the using aspect, the active, conscious use by men and women of appliances in the home. Electricity is outside of this relation, something secondary, an effect of technology use, not use directly of electricity (or other energy carriers). Interviews with households revealed this clearly. Such things as “Watt” and “kilowatthours” is something heard of, but not reflected upon, and often confused with each other. The lack of energy-awareness has been shown in many studies.
Neither purchase nor use of appliances is free from the play of chance. Kevin Lancaster introduced the concept of “characteristic of goods”.10 This concept is helpful in our understanding when it comes to purchase. There are several characteristic of a single item, power and energy is just one of them, beside size, price, design, colour of light, etc. It is probable that choice of lamps and other appliances must fit in a particular place in the dwelling, which means that size, design and function is prioritized before energy efficiency.
Use of electric equipment is often instrumental. Appliances are used in order to prepare a meal, read a newspaper, buy tickets on-line etc. They are not used according to energy consuming criteria, criteria sometimes not even known by the user.
10
Kevin Lancaster, Introduction to Modern Microeconomics. Rand McNally International Company, Chicago, 1969, p 183ff.
From an energy efficiency policy perspective this is not a bad thing. If the energy characteristic of a good is downplayed in purchase and use, then regulations such as phase-out of inefficient variants will be successful. If “efficient” means that the consumer acquires the same function, design, price etc., at a lower rate of energy consumption, then the user will buy them and use them.
However, this is not a solution to the problem of innovations. During later decades we have seen several new items diffusing among the population, and there seem to be no reason why this should stop. This points at the need for energy criteria to be present already from the start in the innovation process. A reasonable rule would be a replacement rule, saying that a new type of TV, for example, must be at least as efficient as the existing one before release on the market. LED is a positive thing as a substitute, but not as a complement.
If such regulations are implemented and successful, dispersion in consumption among households will decrease. A narrower dispersion in supply will lead to a narrower dispersion in use. Variation due to gender, age, household size, dwelling type and area, individual hobbies, lighting culture and other rational factors, will appear more clearly.
Due to the large “chance” variation it cannot be proven that other factors contributes to the overall variation. However, there are indications that households with older people have a lower consumption. The elderly seem to consume less electricity both for lighting and total electricity (where “total” excludes heating and hot water), and in detached houses as well as in apartments. Looking at gender it seems as men consume more than women, when singles of both sexes living in multi-family houses were compared. Men had higher consumption for use of audiovisual, computer and lighting appliances, while women had higher on storing food, cooking, dishwasher and washing machine. Traditional gender division of labour in the home thus seem to exist even in single-person households.
The elderly’s share of total population has increased or is increasing in many countries, not only in Europe. A lower level of consumption among the elderly may seem comforting from an energy savings point of view. However, it cannot be settled by this study alone that the elderly is a generation or a phase in the life cycle. If the lower consumption level is associated with a phase, then prospects for lower level in the future can be argued for. If the lower level is associated with historically lower levels of consumption, then the level will disappear when new generations of people reach retirement age.
Another change in household structure is associated with the number people in the household (household size). In Sweden change has been radical during the last 50-60 years. One-person households have increased to such an extent that it is by far the largest category today, while bigger households have decreased. This tendency can be seen in other European countries too. Household structure influences consumption. All households must have a basic material standard, including electric appliances, which means that material necessities per person increase. In smaller households co-use is lost, and at a given number of individuals in the population there will be a larger number of households. This seems to be a slow but firm tendency contributing to an increase in consumption in the future.
Leaving social structure and going down to the study of individual households a big potential for energy savings has been detected, at least when it comes to lighting. A phase-out of incandescent lamps, replaced first by Compact Fluorescent Lamps, and in the future, Light-Emitting Diodes, will reduce electricity consumption radically. Even though differences between individual households are big, and the sample studied small, it is highly probable that replacements will succeed and give the intended result. A counteracting tendency, though, is a possible rebound effect. If CFLs and LEDS do not perform the same qualities of light as conventional lighting, or if the use of lighting will be extended, then hours-of-use may increase and reduce energy savings.
Paper No. 2
ADOPTION OF ENERGY EFFICIENCY MEASURES IN SWEDISH DETACHED HOUSES - PERCEPTION OF HOMEOWNERS
Gireesh Nair, Leif Gustavsson and Krushna Mahapatra Ecotechnology, Mid Sweden University, SE-83125 Östersund, Sweden
gireesh.nair@miun.se; leif.gustavsson@miun.se; krushna.mahapatra@miun.se
Tel: +46-63 165428, Fax: +46-63 165500
Abstract
The paper focuses on Swedish homeowners’ need for and perceptions about adopting building envelop energy efficiency measures. The results of a questionnaire surveying of 3000 randomly selected homeowners during the summer of 2008 showed that 70-90% of the respondents had no intention of adopting such a measure over the next 10 years. The main reasons for non-adoption were that homeowners were satisfied with the physical condition, thermal performance, and aesthetics of their existing building envelope components. A greater proportion of respondents perceived that improved attic insulation has more advantages than energy efficient windows and improved wall insulation, but windows were more likely to be installed than improved attic insulation. Respondents gave high priority to economic factors in deciding on an energy efficiency measure. Hence, economic incentives could be used to increase the adoption of such measures. Interpersonal sources, construction companies, installers, and energy advisers were important sources of information for homeowners as they planned to adopt energy efficiency measures.
Keywords: Energy efficiency, building envelop components, homeowners, Sweden Introduction
Since the oil crises of the 1970s, there have been improvements in the energy efficiency of the Swedish building stocks, but the efficiency gains made since the 1990s have not been significant compared to those of earlier periods (Nässén and Holmberg, 2005). Still the residential and service sectors accounted for 36% (about 145 TWh) of the national final energy use in 2006 (STEM, 2007). Space heating and hot water, constituting about 60% of this energy use (about 87 TWh), offer a significant energy reduction potential.
The Swedish government has a short- and medium-term target of reducing energy use per heated floor area by 20% and 50 % from 1995 to 2020 and 1995 to 2050, respectively (IEA, 2008). The techno-economical potential for decreased energy use through the adoption of energy efficiency measures in the total Swedish building stock has been estimated to be 30 TWh of heat and 15 TWh of electricity (CEC, 2005). It is important to target existing houses because most of
them were built during the 1960s and 1970s before energy efficiency was emphasised in the Swedish building codes. Also, the addition of new houses to the existing stock happens slowly. The number of residential units increased by 4.5% from 1996 to 2006 (SCB, 2008).
The two million detached houses, account for the largest share (42% in 2006) of the energy used in the residential and service sectors. The heat use in these houses has decreased from an average of 159 kWh/m2/year during the 1980-1989 period to about 129 kWh/m2/year in 2006 (IEA, 2008). However, this can be further reduced through the adoption of energy efficient windows, improved attic and wall insulation. Several studies have concluded that the adoption of such energy efficiency measures is beneficial, especially for houses in cold climates or for those in need of renovation (Joelsson and Gustavsson, 2008; Norrman and Johansson, 1995; Gustafsson and Karlsson, 1997; Erlandsson et. al., 1997; Poel et al., 2007).
Homeowners may adopt energy efficient building envelop measure in order to reduce household energy use, improve indoor comfort and to improve the aesthetic appearance of the buildings. All building envelop measures could be installed together, and that happens mostly during major renovations. It is likely that homeowners will adopt those measures that best fulfil their prioritised need. The preference for a specific option is usually based on a comparison of various alternatives in terms of ease of installation, annual cost savings, investment required, aesthetic value, etc.
Potential adopters’ evaluation of alternatives is usually based on perceptions of the attributes of the alternatives. Hence, the Swedish homeowners’ adoption of building envelope energy efficiency measures depends on their perceptions of such measures which is being analysed in this paper. The analysis is based on data collected from a survey of about 3000 Swedish homeowners during May–July 2008. Our study expands existing studies on homeowners’ adoption practices for heating systems (Mahapatra and Gustavsson, 2008a, 2009; Mårtensson, 2006; Sernhed and Pyrko, 2006; STEM, 2005; Nilsson, 2004; Vinterback, 2000; Hallin, 1988) and consumer durables (Martienz et al., 1998).
CONCEPTUAL FRAMEWORK
Building envelope energy efficiency measures are usually renewed after about 30-40 years. Hence, it is likely that many Swedish homeowners have not been involved in adopting such measures. Even if they were involved previously, a new decision is influenced by existing information and circumstances. Following the definition by Rogers (2003) and Howard and Sheth, (1969) which states that innovation is an idea, practice or object that potential adopters
perceive as new, we consider the adoption of energy efficient windows and improved insulation as innovations.
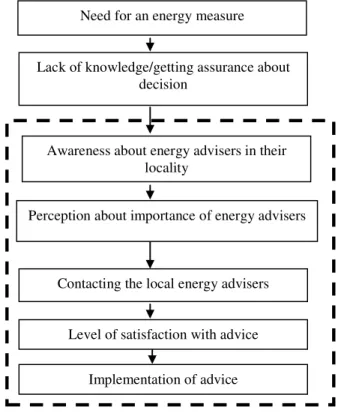
Potential adopters go through various stages when making adoption-decisions (Rogers, 2003; Dieperink et al., 2004; Mahapatra and Gustavsson, 2008a; Hawkins et al., 2007; Faiers et al., 2007). The common stages found in all these studies are the need for an innovation, the collection of information, and the selection of an innovation based on an evaluation of alternatives. We discuss these stages and the influence of external factors on homeowners’ adoption decisions (Figure 1) to understand homeowners’ adoption of energy efficiency measures for building
envelopes. There are several external factors influencing homeowners’ decisions, but we consider only government subsidies for installing energy efficient windows in existing buildings.
Figure 1: Schematic representation of different stages of decision making in homeowners adoption of a building envelope component (Adapted from Hawkins et al., 2007;
Mahapatra and Gustavsson, 2008a)
1.1.1 Stage -1: Need for a new building envelope component
Potential adopters consider adopting an innovation if they feel a need for it (Hassinger, 1959). Need is a state of dissatisfaction or frustration that occurs when there is a difference between the desire and perceived actual state (Rogers, 2003), i.e., when a problem is recognised (Hawkins et al., 2007). Potential adopters, take actions that best fulfil the need in question (Hawkins et al., 2007).
In building envelope component replacement decisions, need may arise because of the physical condition, thermal performance, or the aesthetical value. These conditions generally depend on the age of component. Aesthetic aspect is limited to visibility of the component and is important for windows and façades. In addition, the perceived high cost of energy or a concern for the environment may induce the homeowners to adopt building envelop energy efficiency measures. Furthermore, homeowners’ level of awareness (Rogers, 2003) of various energy efficiency measures will influence the adoption of such measures.
Demographic variables like age, income, and education may influence potential adopters’ decision-making process (Hawkins et al., 2007). Socio-demographic analysis may be useful in understanding the environmental knowledge and attitudes of individuals (Diamantopoulos et al., 2003) and, therefore, may assist in the market segmentation of potential adopters (Wedel and Kamakura, 2000). Still, there is no conclusive evidence on the relationship between demographic factors and green consumer behaviour (Peattie, 2001; Diamantopoulos et al., 2003; Wagner, 1997). Some Swedish studies have shown that there exists a relationship between homeowners’
Collection of Information
Selection of a building envelope component
Physical condition, energy performance of installation, awareness about alternative, perceived energy cost, aesthetics, demographic factors
Mass media and interpersonal communication, change agents Perceived advantages - Economic - Ease of installation Stage 2 Stage 3 Stage 1
Need for a new building envelope component Influencing factors Influence of government policy instruments
age and energy efficient behaviour (Carlsson-Kanyama et al., 2005; Mahapatra and Gustavsson, 2008a, 2008b).
1.1.2 Stage 2 – Collection of information
Potential adopters who intend to fulfil their needs collect information about alternatives from various sources. The information search could be either internal (from memory) or external (from external sources) (Hawkins et al., 2007). Typically, investment-intensive decisions such as building envelope energy efficiency measures entail external searches. The external sources of information include mass media and interpersonal channels. These information sources influence homeowners’ behaviour through a change in the homeowners’ cognitive attitudes (Mahapatra and Gustavsson, 2009). The influence from mass media and interpersonal sources on adoption decisions varies among categories of potential adopters. Mass media communications like television (TV) or newspaper advertisements are more likely to influence the innovators and early adopters, who constitute a small proportion of the total number of potential adopters (Rogers, 2003). Interpersonal sources are important for the majority of other adopters (Arndt, 1967; Bearden et al., 1989; Midgley, 1983). The majority rely on evaluations of friends and peers who have already adopted the innovation (Lekvall and Wahlbin, 1973; Lerviks, 1976; Rogers, 2003).
1.1.3 Stage 3 - Selection of a building envelope component
Potential adopters process the gathered information to make the adoption decision. In doing so, they usually compare various alternatives based on their perception of the alternatives’ attributes: economic factors, environmental benignity, ease of installation, etc. A measure that has more perceived advantages compared to others is likely to be adopted. Adoption decisions are made based on perceptions because potential adopters are constrained by bounded rationality; i.e., they have a limited capacity to acquire, store, and process the vast amount of information required to make a rational decision (Simon, 1959).
1.1.4 Influence of economic instruments
Potential adopters may not realise the advantages of adopting energy efficiency measures; therefore, efforts are needed to promote such measures (Rogers, 2003). Marketing campaigns, rules and regulations, and economic instruments are some of the options. Economic policy instruments like subsidies and low interest loans are used, especially during the early phases of the diffusion process, to promote investment-intensive innovations. Grants and low-interest loans were effective in Sweden (Schipper et al., 1985) and in the United Kingdom (Boardman, 2004;
Shorrock, 2001), but subsidies for wall insulation had a limited impact in the Netherlands (Kemp,
1997).
During our survey period, subsidies were available in Sweden for owners of detached houses who replaced their existing windows with energy efficient windows (U value ≤ 1.2 W/m2K). This subsidy, available from 2006 to 2008, was 30% of the investment cost exceeding 10,000 SEK11, and the maximum subsidy available for each household was 10,000 SEK.
11
Methodology
1.1.5 Survey
In survey research, a suitable sampling technique is required which generalise to the entire population from a small portion of the population (Rea and Parker, 2005). In Sweden, population density varies significantly from north to south, and therefore, the stratified random sampling technique is an appropriate option. In our survey, the strata consisted of 8 Nomenclature of Territorial Units for Statistics (NUTS) regions12. The questionnaire was sent to a sample of homeowners in each of these NUTS regions. The total number of questionnaires sent out for the survey was 3059, and after two reminders, the response rate was 36%. The survey was conducted through Statistics Sweden.
1.1.6 Questionnaire
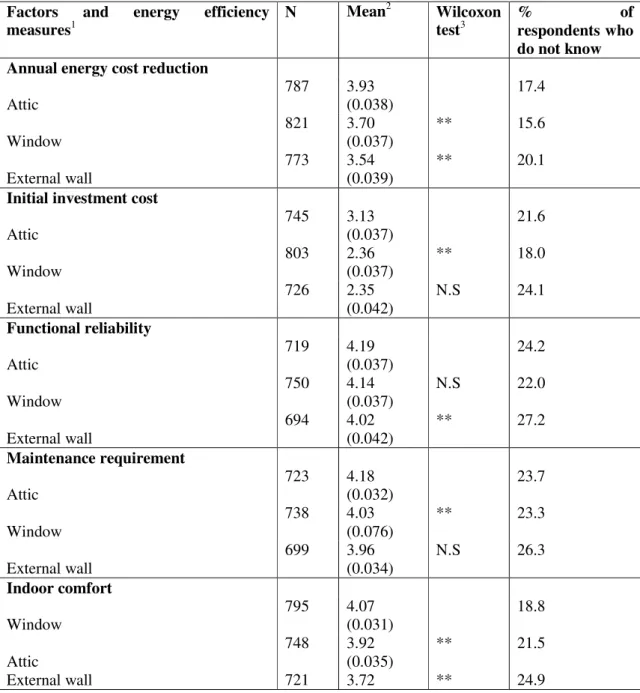
The questionnaire consisted of six parts. Section A included questions about the existing conditions of the building envelope components. Section B included questions regarding the respondent’s awareness of energy efficiency measures and their perceptions of them. Section C included questions about the respondent’s interaction with other major actors like construction companies and energy advisers. In Section D, respondents were asked to grade the level of importance of different installation-related factors like investment cost, energy cost savings, GHG emission-reduction potential and aesthetics. In Section E, respondents were asked to rank the different energy efficiency measures on a 5-point Likert scale for each of the factors mentioned in Section D. Section F included questions related to socio-economic variables.
1.1.7 Analysis
About 64% of the homeowners did not respond. The higher the refusal rate, the greater is the need to ascertain whether the non-responses were concentrated in certain groups (Weisberg et al., 1996). Hence, to generalise our survey results, we tested the presence of a non-response bias. We compared the composition of the group of homeowners sampled with that of those who responded, considering each homeowner’s NUTS region, the age of each house, the age and income of each respondent. No significant non-response bias was found with respect to those variables, except that homeowners older than 55 years were more commonly represented among the respondents.
Homeowners’ ratings of the importance of installation-related attributes (section D of the questionnaire) were ordinal in nature. Hence, the median is the appropriate measure of the central tendency (Nachmias and Nachmias, 1996). However, the median value was the same for a few attributes, making it impossible to rank the level of importance of those attributes. Therefore, we treated the ordinal responses as interval level variables and estimated the mean values of the attributes to rank them. However, we kept intact the ordinal nature of the responses by conducting a non-parametric test to verify the significance of the rankings. The Friedman test could show if at least one attribute was ranked significantly differently from the others, but this test did not allow us to know which attributes were ranked significantly differently. Hence, we conducted a
12
The NUTS regions are: Stockholm County, Eastern-Central Sweden, Småland and the islands of Öland and Gotland, Southern Sweden, Western Sweden, North-Central Sweden, Central Norrland and Upper Norrland.
Wilcoxon signed rank test (henceforth a ‘Wilcoxon test’) of successive pairs of attributes arranged according to decreasing mean values. A significant result for the first pair of attributes automatically renders the successive attribute significantly different from the first one.
The above procedure was also used to analyse respondents’ ratings of various building envelope energy efficiency measures (section E of the questionnaire).
Results
1.1.8 Characteristics of building envelope components
Table 1 provides information about the existing building envelope components of respondents’ houses. Double glass followed by triple glass windows was common. Mineral wool was the most common insulation material used for attic and wall insulation. For attics, insulation thickness varied more or less evenly within the range of 100 – 200 mm, 200 – 300 mm and 300 – 400 mm. About 12% of respondents reported insulation thickness, above 400 mm. In the case of wall insulation, about 6% of respondents reported insulation thickness above 300 mm. The detached houses in North Sweden (i.e., Jämtland, Norrbotten, Västerbotten and Västernorrland counties) have relatively thicker attic and wall insulation compared to those in other parts of Sweden. The proportion of respondents reporting that their windows, attic insulation, or wall insulation was more than 20 years old was 42%, 43% and 50%, respectively.
Table 1: Percentage of respondents reporting on characteristics of their existing building envelope components Characteristics Window (%) Attic insulation (%) External wall insulation (%) Most common type of component
Windows
Double glass Triple glass
Double glass with low emission coating
Triple glass with low emission coating Do not know 46 35 9 19 0.4 NA NA Insulation Mineral wool Cellulose Fibre board Cellplast Others Do not know NA 73 11 2.8 0.7 4.3 8.2 66 7 7.3 1.6 2.5 15.1 Thickness of insulation 0 – 100 mm 101– 200mm 201– 300mm 301– 400mm > 400 mm Do not know NA 6 19 22 16 12 21 14 34 18 6 0.7 27
Age of component < 10 years 10 –20 years 20 – 35 years > 35 years Do not know 29 18 24 18 11.6 21 20 27 15 17.6 14 17 28 22 19.6 Note: NA = Not applicable; A few respondents had more than one type of window
1.1.9 Need for a new building envelope component
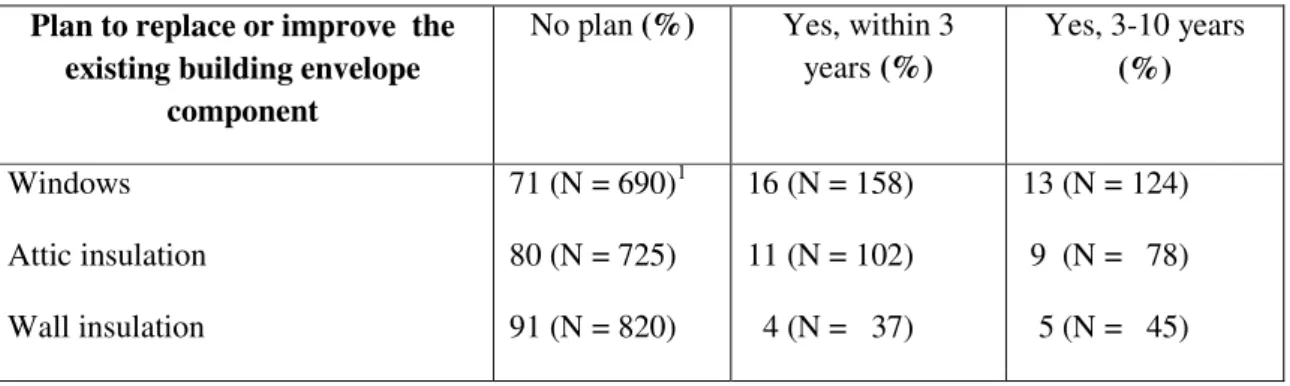
About 71%, 80% and 91% of respondents had no intention of changing their windows or improving their attic or wall insulation, respectively, during the next ten years (Table 2). This shows that a vast majority of homeowners are not going to adopt such measures in the near future. This could be due to several reasons discussed in the following sections.
Table 2: Percentages of respondents (excluding “do not know” responses) reporting about their plans to adopt various building envelope energy efficiency measures.
Plan to replace or improve the existing building envelope
component
No plan (%) Yes, within 3 years (%) Yes, 3-10 years (%) Windows Attic insulation Wall insulation 71 (N = 690)1 80 (N = 725) 91 (N = 820) 16 (N = 158) 11 (N = 102) 4 (N = 37) 13 (N = 124) 9 (N = 78) 5 (N = 45) 1) N = Number of responses
1.1.10 Satisfaction with existing building envelope component
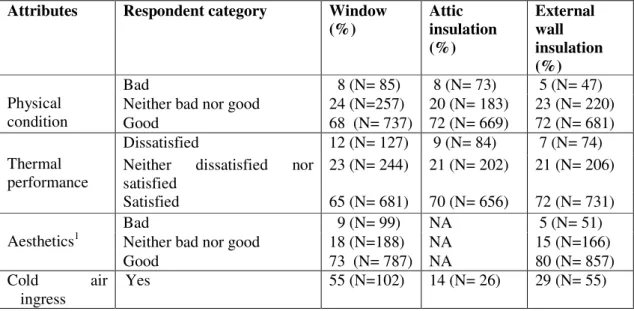
A potential adopter who is satisfied with an existing building envelope component is less likely to need a new component. The majority of the respondents felt that the physical condition of their windows (68%), insulation of their attic (72%) and insulation of their walls (72%) were in good condition (Table 3). About 73% and 80% of the respondents were satisfied with the aesthetics of their windows and façade, respectively.
The majority of the respondents were satisfied with the thermal performance of their windows (65%) and attic (70%) and wall (72%) insulation (Table 3). A similar percentage of respondents (82%) reported that they did not feel any cold air ingress in their house (not shown in table). Among the 18% who felt cold air ingress, 55% reported that windows were the source of the cold draft.
Table 3: Percentage of respondents (excluding “do not know” responses) reporting their perception of various attributes of existing building envelope components
Attributes Respondent category Window (%) Attic insulation (%) External wall insulation (%) Physical condition Bad 8 (N= 85) 8 (N= 73) 5 (N= 47)
Neither bad nor good 24 (N=257) 20 (N= 183) 23 (N= 220)
Good 68 (N= 737) 72 (N= 669) 72 (N= 681)
Thermal performance
Dissatisfied 12 (N= 127) 9 (N= 84) 7 (N= 74) Neither dissatisfied nor
satisfied 23 (N= 244) 21 (N= 202) 21 (N= 206) Satisfied 65 (N= 681) 70 (N= 656) 72 (N= 731) Aesthetics1 Bad Neither bad nor good 9 (N= 99) 18 (N=188) NA NA 5 (N= 51) 15 (N=166)
Good 73 (N= 787) NA 80 (N= 857)
Cold air
ingress Yes 55 (N=102) 14 (N= 26) 29 (N= 55)
1) Refers to aesthetics of windows and facade, NA = Not applicable, N = Number of responses
Dissatisfaction with existing building envelope components will encourage the adoption of new ones. Respondents would adopt a new building envelope component if they thought that the existing components were in bad physical condition, had poor aesthetics, or poor thermal performance (Table 4). For example, 83% of the respondents whose windows were in bad physical condition might replace them, while only 14% among those who had windows in good condition might do so. Respondents who felt cold air ingress were more likely to adopt a building envelop measure.
Building envelope components were more likely to be adopted as the age of the components increased. For example, about 49% of the respondents whose windows were more than 35 years old would install new windows, but only 18% of those who had windows less than 10 years old would do so (Table 4). We found that respondents were more likely to replace their windows and improve their attic or wall insulation when they had to renovate the façade.
Table 4: Attribute-wise percentage of respondents planning to replace their windows or improve insulation during the next 10 years
Attributes Respondent category Percentage of respondents who plan to
replace windows or improve insulation during the next 10 years1
Window Attic
insulation External wall insulation Physical
condition
Bad 83 (N =
63)
68 (N = 48) 36 (N = 14) Neither bad nor good 53 (N =
118) 37 (N = 55) 17 (N = 27) Good 14 (N = 94) 11 (N = 63) 5 (N = 28) Thermal Dissatisfied 62 (N = 68) 59 (N = 42) 42 (N = 23)
performance Neither dissatisfied nor satisfied 52 (N = 109) 37 (N = 61) 14 (N = 22) Satisfied 15 (N = 93) 10 (N = 59) 5 (N = 31) Aesthetics2 Bad 71 (N = 62) NA 3 41 (N = 13)
Neither bad nor good 54 (N =
86) NA 19 (N = 24)
Good 18 (N =
126)
NA 6 (N = 42)
Cold air ingress Yes 51 (N =
85) 37 (N = 52) 22 (N = 29) No 24 (N = 189) 16 (N = 120) 7 (N = 51) Other Factors Age of the component < 10 years 18 (N = 45) 14 (N = 23) 11 (N = 12) 10 -20 years 21 (N = 31) 20 (N = 29) 8 (N = 10) 20 – 35 years 39 (N = 81) 19 (N = 38) 10 (N = 20) > 35 years 49 (N = 70) 32 (N = 35) 11 (N = 16) Plan for changing external wall Yes 74 (N = 51) 60 (N = 36) 82 (N = 53) No 24 (N = 210) 16 (N = 125) 3 (N = 22) 1) Chi–square tests showed a significant relationship (p ≤ 0.01) between respondents’ perception of the attributes and their plans to replace windows or improve attic or wall insulation. However, the relationship between the age of component and respondents’ plans to improve wall insulation was insignificant. N = Number of responses
2) Refers to aesthetics of windows and facade 3) NA = Not applicable
1.1.11 Awareness of existing building envelope component
If potential adopters did not know about their existing building envelope components, then it is less likely that they would adopt a new measure. Table 5 shows that the majority of the respondents knew about various attributes of their windows, attic and wall insulation. The percentage of respondents who did not know was highest for wall insulation, followed by attic insulation and windows. Respondents who knew about the type, thickness and physical condition of their building envelope component were significantly (p ≤ 0.01 as per chi-square test) more likely to replace the component than those who did not know about these aspects (result not shown in Table).
Table 5: Percentage of respondents’ who “did not know” about various attributes of their building envelope component
Attributes of building envelope component
Percentage of respondents who “did not know” about their building envelope component
Window Attic insulation External wall insulation Type1 0.4 (N = 1229) 8.2 (N=1060) 15.0 (N = 1065) Thickness NA 21.0 (N = 1052) 27.0 (N = 1054) Age 11.7 (N = 943) 17.6 (N = 899) 19.6 (N = 898) Physical condition 0.4 (N =1083) 8.8 (N = 1014) 10.8 (N = 1063) Thermal performance 2.0 (N= 1073) 7.2 1016) (N = 4.3 (N = 1058) 1) Type of building envelope component refers to type of windows and insulation material
for attic and external wall; see Table 1 for common types of components. N = Number of responses. NA = Not applicable.
1.1.12 Perception of energy cost and importance of reducing energy use
Homeowners were more likely to adopt building envelope energy efficiency measure if it was perceived that annual household energy costs were high (Table 6). Chi-square tests showed that the relationship between respondents’ perception of energy costs and their plans to adopt a measure was significant for the installation of windows (p ≤ 0.05) and improved attic insulation (p ≤ 0.01), but not for improved wall insulation.
Table 6: Respondents’ plans to adopt a building envelope energy efficiency measure during the next 10 years, in relation to their perception of household energy costs and the level of
importance that they attribute to reduced household energy use
Factors that may create a need
Respondent category
Percentage of respondents who plan to replace windows or improve insulation during the next 10 years
Window Attic
insulation External insulation wall Perceived share of energy cost in annual income Low 24 (N = 234) 12 (N = 219) 7 (N = 220) Neither low nor
high 28 (N = 379) 20 (N = 355) 8 (N = 353) High 34 (N = 297) 26 (N = 280) 13 (N = 275) Level of importance
to reduce energy use in home Not important 20 (N = 146) 9 (N = 134) 7 (N = 138) Moderately important 27 (N = 194) 18 (N = 188) 8 (N = 182) Important 32 (N = 585) 24 (N = 542) 10 (N = 542)
N = Number of respondents in each category
About 66% of the respondents did not think that their energy costs were high. Still, it was important for about 63% of the respondents to reduce household energy use. The results of Table 6 show that only 32% of the 63%, who consider it important to reduce household energy use would install a window. A lesser proportion would improve attic or wall insulation. Still, respondents who thought that it was important to reduce household energy use were more likely to adopt a building envelop energy efficiency measure than those who did not think so. A significant relationship was found between the level of importance that respondents assigned to reducing household energy use and their plan to replace windows (p ≤ 0.05) or improve attic (p ≤ 0.01) or wall insulation (p ≤ 0.01).
1.1.13 Demographic factors
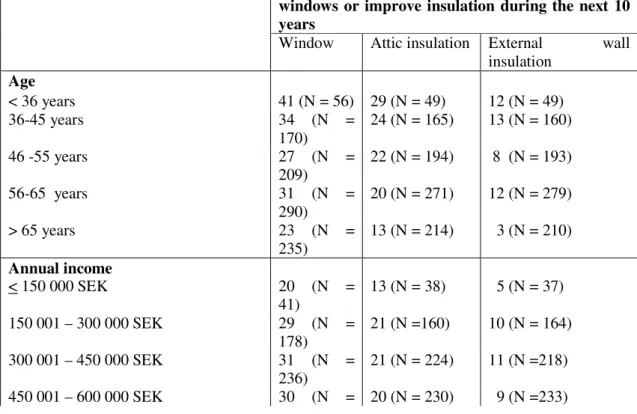
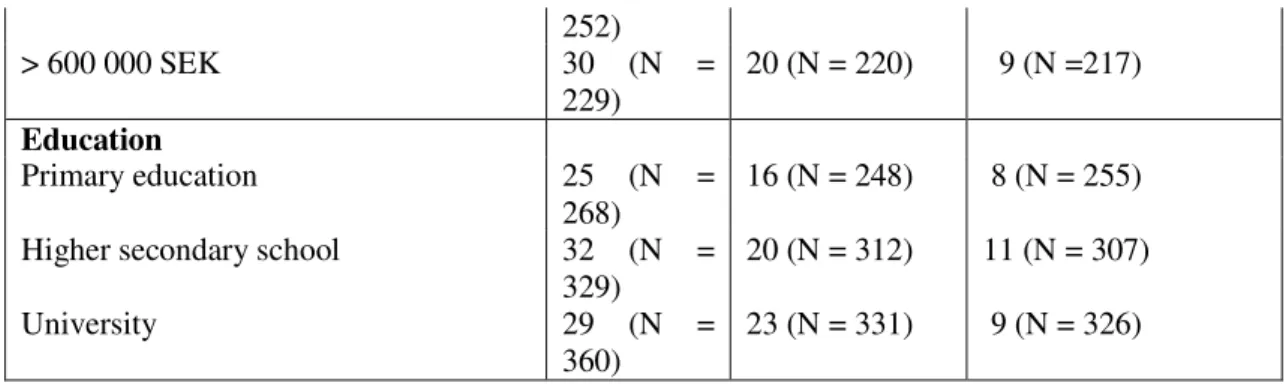
The influence of respondents’ age, income, and education on their adoption of building envelope energy efficiency measures is presented in Table 7. A chi-square test showed that there was a significant relationship (p ≤ 0.05) between respondents’ age and their plan to install a window or improve attic or wall insulation. Younger homeowners were more likely to adopt such a measure. Respondents with higher education and higher income were found to be more inclined to adopt an energy efficiency measure, but the relationship was statistically insignificant.
Table 7: Percentage of respondents in different age, income and education categories who planned to adopt building envelope energy efficiency measures during the next 10 years
Respondent category Percentage of respondents who planned to replace
windows or improve insulation during the next 10 years
Window Attic insulation External wall insulation Age < 36 years 41 (N = 56) 29 (N = 49) 12 (N = 49) 36-45 years 34 (N = 170) 24 (N = 165) 13 (N = 160) 46 -55 years 27 (N = 209) 22 (N = 194) 8 (N = 193) 56-65 years 31 (N = 290) 20 (N = 271) 12 (N = 279) > 65 years 23 (N = 235) 13 (N = 214) 3 (N = 210) Annual income < 150 000 SEK 20 (N = 41) 13 (N = 38) 5 (N = 37) 150 001 – 300 000 SEK 29 (N = 178) 21 (N =160) 10 (N = 164) 300 001 – 450 000 SEK 31 (N = 236) 21 (N = 224) 11 (N =218) 450 001 – 600 000 SEK 30 (N = 20 (N = 230) 9 (N =233)
252) > 600 000 SEK 30 (N = 229) 20 (N = 220) 9 (N =217) Education Primary education 25 (N = 268) 16 (N = 248) 8 (N = 255)
Higher secondary school 32 (N =
329)
20 (N = 312) 11 (N = 307)
University 29 (N =
360) 23 (N = 331) 9 (N = 326) N = Number of respondents in each category
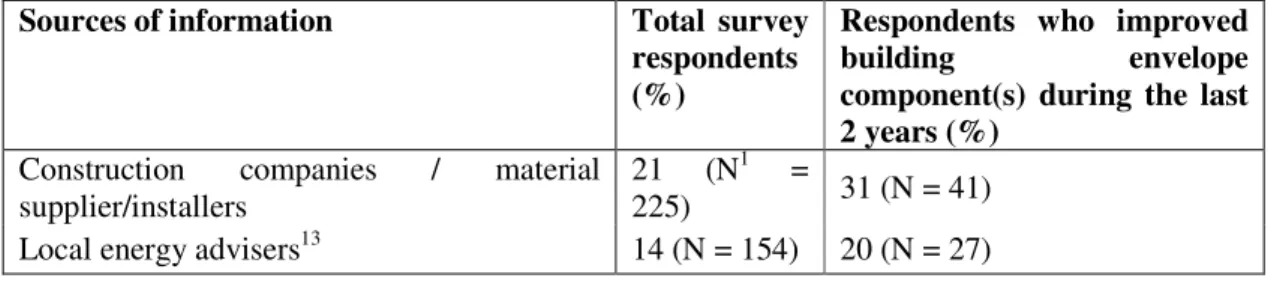
1.1.14 Information source
Most potential adopters rely on interpersonal information in their adoption decisions (Rogers, 2003). We also found that interpersonal sources were the most important source of information in respondents’ decisions to adopt energy efficiency measures. Construction companies, material suppliers and energy advisers were the second and third most important sources of information (Table 8).
Table 8: Level of importance of various information sources as respondents plan to adopt building envelope energy efficiency measures
Sources of information Total survey
respondents
Respondents who improved
building envelope
component(s) during the last 2 years N1 Mean2 N1 Mean2 Interpersonal sources 940 3.58 (0.037) 125 3.66 (0.109) Construction companies/material suppliers 916 3.45 (0.051) 124 3.51 (0.112) Energy adviser 936 3.25 (0.043) 125 3.04 (0.126) Installers/vendors 903 3.13 (0.041) 121 3.23 (0.109) Internet 887 3.04 (0.045) 121 3.19 (0.127) Energy supplier 902 2.98 (0.041) 122 3.03 (0.113) Vi i Villa magazine 924 2.86 (0.037) 124 2.86 (0.110)
Visiting a house to see the
installation 916 2.83 (0.046) 123 2.72 (0.132)
Swedish Energy Agency 900 2.73 (0.041) 122 2.55 (0.101)
Exhibition 907 2.57 (0.040) 123 2.53 (0.112)
Advertisement in TV 901 2.09 (0.033) 119 2.02 (0.088)
Home delivered leaflets 888 1.98 (0.034) 120 1.91 (0.087) 1) N = Number of respondents, Values in parentheses are standard errors
2) Mean values are based on homeowners’ ratings using an ordinal scale of 1 = Not important, 5 = Very important. Hence, an information source with a higher mean value is of greater importance.