Final Project Report
Myoelectric Interface
Emre Kus¸
870908-P239
eks08002@student.mdh.se
Supervisor:
Baran C
¸ ¨
ur¨
ukl¨
u
baran.curuklu@mdh.se
School of Innovation, Design
and Technology
Abstract
The intention of this thesis project report is to control a servo motor by using
Electromyography(EMG) signals in the purpose of learning about bioamplifiers and how
ATMEL AVR Series microcontrollers work.
EMG is the a test that is used to record the electrical activity of muscles. In order to fulfill
our intention an EMG amplifier, an ADC converter and a servo motor controller is build
to be used with the simple mechenical gripper where the control of the gripper is directly
related with the amplitude of the EMG signals taken from the hand muscles. In the
development and USART serial communication part is also added enabling to see the ADC
results in computer.
Contents
1 Introduction 4 1.1 Electromyography . . . 4 1.2 Bioelectric . . . 4 1.3 Amplifier . . . 5 1.4 Electrode . . . 6 1.5 Noise . . . 7 2 Implementation 7 2.1 Analog System . . . 7 2.1.1 Pre-amplifier . . . 7 2.1.2 Filter . . . 8 2.1.3 Envelope Detector . . . 8 2.2 Digital System . . . 9 2.2.1 Analog-Digital Converter . . . 9 2.2.2 Serial Communication . . . 11 2.2.3 Servo Control . . . 11List of Figures
1 Diagram of a typical neuron . . . 5
2 Action Potential . . . 5
3 Differantial amplifier configuration . . . 6
4 EMG Block Diagram . . . 7
5 Preamplifier with Referance Circuit . . . 8
6 Band Pass Filter Consisting of a High Pass and a Low Pass Filter . . . 9
7 Full Wave Rectifier and Low Pass Filter . . . 9
8 Block diagram of the Digital System . . . 10
9 A/DC Test Circuit . . . 10
10 Terminal screen of Serial Watcher . . . 11
1
Introduction
1.1
Electromyography
Electromyography is the technique used to measure and record the muscle response to electrical activity within muscle fibers, muscle stimulation caused by the nerve impulses at rest and during contraction. EMG signals are measured buy the electrodes placed on certain body muscles.
Like all the other electrophysiological signals, EMG signals are not easily observed as they are weak signals in range of 1-100mV [1] peak to peak so an EMG signal needs to be amplified by an amplifier specifically designed to measure it in order to be observed.
The EMG signal is picked up by electrodes and then amplified. Generally more than one amplification stages as necessary in order to eliminate the low and high frequency noises or the other factors that can affect the output data. The frequency of the data is between 0 to 1KHz but the strongest amplitudes are to be found in the 50 to 350 Hz band. [1]
The EMG signal is dependent on many factors since the signal is susceptible to noise interference such as hum, signal acquisition such as clipping and baseline drift, skin artifacts, processing errors, and interpretation problems. [2]
EMG amplitude is also affected by parameters such as electrode placement, electrode orientation, electrode type, inter-electrode distance, skin preparation, skin and electrode gel temperature, subcutaneous fat between the electrode and muscle. [3]
During the measurement if there is no contraction of the muscle while measuring the muscle should be electrically silent, a signal resembling the white noise is seen. [4] When the muscle is contracted, action potentials are appear and depending on the strength of contraction action potentials are increased.
EMG signals can be used to diagnose neuromuscle diseases; neuropathic and myopathic diseases. Other than the clinical applications to diagnose diseases and disorders, EMG signals can be used as control signals for prosthetic devices such as prosthetic arms, hands and lower limbs.
EMG signals are also used to control computers and other devices, EMG based interface devices can be used to control mobile robots, electric wheelchairs. A computer interaction of EMG can be used to control of the mouse pointers and some interactive video games.
In this thesis project EMG signals are tried to use for controlling of a simple hand-shaped gripper with an microcontroller interface.
1.2
Bioelectric
Nervous system is a network of cells that communicate information about an organism’s surrounding and itself. Nervous system can be divided into two subcathergories; the peripheral nervous system and central nervous system.
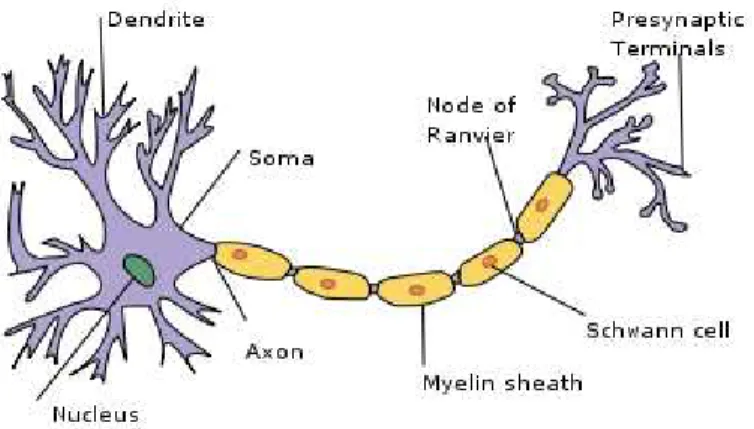
The nervous system is composed of fibers that conduct information to the spinal cord, brain and the other nerve fibers that send information out to different parts of the body. The cells that make up the various parts of the nervous system are called neurons.
A typical neuron is defined with four major parts; cell body, dendrites, axon and presynaptic termi-nals.The cell body of a neuron contains nucleus and is called soma. Axons conduct action potentials where schwann cells insulate axons for a faster action potentials transmission.
In the neuron, pottential difference between inside and outside of the cell membrane is apporximately 60-90mV depending on the specific cell. The cell membrane is positively charged on the outside and negatively charge on the inside. Outside is defined as the ground, 0mV and thus the resting potential is V m = vi−vo =
−70mV . [5]
One of the results caused by the changes in of ions of the membrane are called action potentials.
Cell membrane have some proteins on it that sticks out on both sides of it, some of them are called ion channels which allows ions to flow in or out of the cell.
Figure 1: Diagram of a typical neuron
Figure 2: Action Potential
Na ions outside the cell and K ions inside the cell. This is called resting potential.
A stimulus causes sodium channels to open and the Na ions rush into the cell. The electric potential potential is increased, to almost 40mV. When the inside of the cell gets positive this stage is called depolar-ization.
Right after the depolarization potassium channels are opened and K ions diffuses out of the neuron. This stage is called the repolarization where the cell goes back to its previous condition at resting potential.
1.3
Amplifier
Amplifier is an electronic device that increases the amplitude of the signal. As explained before, the EMG signals are too weak to be measured without amplification. Amplifiers used to process biopotentials are called bioelectric amplifiers. Amplifiers with medium gain, x10-x1000 are mostly used for the recording of ECG waveforms and muscle potentials, EMG.
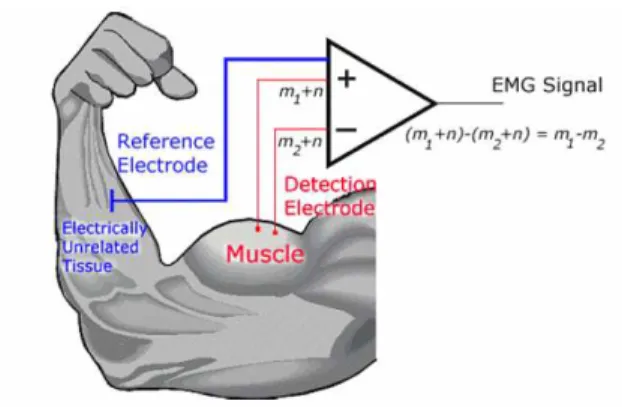
Differential amplifier is used to amplify the EMG signal, as it can eliminate the noise from the signal which is taken from the both ends of the electrodes. The differential amplifier subtracts the signals from each other and then amplifies in order to get rid of the hum. In the Fig.3 a differantial amplifier configuration is seen where ”m” represents the EMG signals and ”n” represents the noise.
The common mode rejection ratio of the EMG must be as high as possible in order to get better subtrac-tion of the hum picked up from the two inputs from the different locasubtrac-tions of body. The hum is approximately
Figure 3: Differantial amplifier configuration
100mV, considerably larger than the EMG signal. As the hum is picked up commonly from both electrodes it is called ’common mode’. The perfect subtraction of the hum is impossible, the need for successful removal the CMRR value must be 10000 or greater. [6]
It is suggested that to have a CMRR value of 90dB in order to sufficiently remove the noise for EMG. [2] The amplifier must satisfy some requirements.
The input impedance of the amplifier must be high enough in order not to lower it, skin impedance must be minimized.
Bioelectric amplifiers must have a very high input impedance as the all bioelectric signal sources exhibit a high source impedance, most of the bioelectric sources have an impedance between 103 and 107 ohm and
the amplifier input impedance must be at least 100times the skin resistance to avoid the attenuation of the signal. [6]
The frequency response bandwidth of the EMG amplifier must be suitable to amplify without attenuation all frequencies present in EMG, which is 10-1000Hz for surface electrodes. [7]
Two of the important parameters in bioelectric amplifiers are noise and drift. Drift is the the change in output signal voltage due to changes in operating temperature and noise, in ths case, is the thermal noise generated in resistances and semiconducter devices.
Instrumentation amplifier is used in the pre-amplification stage of the project to perform the crucial differential signal combination and it is the solution to both high-gain and high-input impedance prob-lems. Instrumentation amplifier consists of three operational amplifiers; two non-inverting followers as input amplifiers followed by a differential amplifier.
1.4
Electrode
There are two types of electrodes used in the recording of the EMG signals; surface electrodes and needle electrodes.
While needle electrodes are inserted through the skin into the muscle tissue, surface electrodes are placed on the surface of the skin. In this thesis project, surface electrodes are used as they are easy to use and can be applied without pain. Surface electrodes come in many varieties mostly characterized by number of contacts.
Even the main object is to obtain the most selective EMG recording, surface electrodes have greater value of crosstalk from other muscles in the region as they have large pick-up area but the global representation of the finger flexor muscles are targeted in the project.
The detected amplitude normally ranges up to 5 mV for surface electrodes and up to 10 mV when using needle electrodes.The cut-off frequency of the surface electrodes vary from 10 to 1000 Hz. [1]As the signals obtained are too low, noise is a big problem and it must be considered in the design of the system. The motion artifact in the electrode skin interface is one of the reasons of noise caused the electrodes, which has
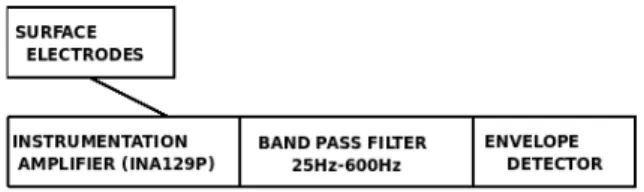
Figure 4: EMG Block Diagram
frequencies 0-10Hz. The use of high-pass filtering, shielded cables, carfully taping to reduce cable movement and mounting the amplifier near the electrodes can minimize this effect.
The electrode placement and location has a big importance in the EMG recording, surface electrodes must be placed parallel to the muscle fibers.[2] The skin must be cleaned and electrode conducting jel must be used for better results.
Reference electrodes must be used near the bony parts.
1.5
Noise
EMG recording can be interferenced by noise from different sources, not only by the noise from the bioelectric generator or active cell but also from the electrical fields that occur around lead cables and electrode. Electrical fields such as power lines, computer monitors, transformers, or even EMG amplifier itself might cause noise that will interference the signal. Because of the electronic components acting as anthennas, recording devices, ambient noises, motion artifacts the design of the amplifier should have been designed considering the these noise factors. [2]
Ambient noise can be generated from any electric device that crates electromagnetic field. The ambient noise can not be avoided, it occurs primarily between the 50-60Hz band. [7]
2
Implementation
The system implemented consists of two major subsystem; analog which is responsible for amplification, filtering and envelope detection, digital which is responsible for digital conversion, serial communication and servo control.
2.1
Analog System
2.1.1 Pre-amplifier
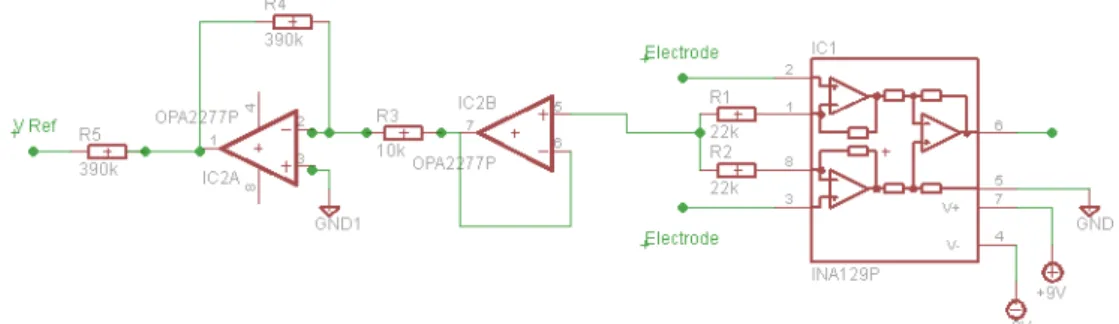
The Burr-Brown INA129P instrumentation amplifier was chosen as the front end amplifier due to its high CMRR at high gain. Differential amplifier in contained in the instrumentation amplifier allows subtraction of the common or unwanted signal from the actual signal but the perfect subtraction is never done. The high the common mode rejection ratio indicates the better subtraction and the CMRR of the INA129P at a gain of 1000 is about 130 dB, is more than sufficient for this project.
A single external resistor sets the gain of INA129P from 1 to 10,000, the resistor is connected between the 1st and 8th legs of the opamp. The gain can be calculated by the following equation.
G =1 + (49, 4kW)
RG (1)
Figure 5: Preamplifier with Referance Circuit RG 2 = 1 2 50kW (Gain − 1) = 1 2 50kW 999 = 25.025W (2)
The calculated value for the R1 and R2 is 25ohms, however the closest value of the resistance avaible is 22 ohms.
After substituting RG/2 = 22W into equation(231231) gives gain of 1122.7272 of the amplifier which is
sufficent for the circuit.
G =1 + (49, 4kW)
44 = 1122.7272 (3)
The design of the body reference ciruit is taken from the Burr-Brown INA129P instrumentation amplifier datasheet. [8]
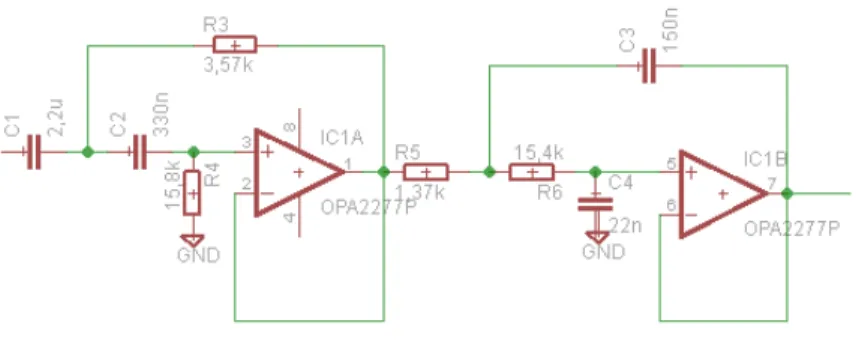
2.1.2 Filter
To prevent the noise that have been amplified by the preamplifier circuit, a band pass filter was applied to the output of preamplfier. Filter also helps to sink any DC current that might cause bias for the signal.
After the initial signal is amplified by the front end amplifier, the signal is passed through a Sallen-Key 2 pole Butterworth high pass filter with a 25Hz cut-off frequency rejecting all the motion artifacts but at the same time letting pass the lower end of the frequency band of interest.
The high-pass filter is followed by a a Sallen-Key 2 pole Butterworth low-pass filter with a 600Hz cut-off frequency in order to band pass the signal.
The gain of the band-pass filter is 1 as the gain of the high-pass filter and the gain of the low-pass filter are both 1.
2.1.3 Envelope Detector
Because of the nature of EMG signals are alternating with many frequency components, the signal must be processed to get a smooth output. In order to accomplish this task a precision full-wave rectifier circuit, which acts like an envelope detector, is used to rectify the signal and obtain the positive part of the voltage waveform after the amplification and band-pass filtering the signal.
Then the envelope detector is followed by a low-pass filter in order to smoothen the ripples in the signal, acting as an integrator. A 2.8Hz cut-off frequency is chosen.
Figure 6: Band Pass Filter Consisting of a High Pass and a Low Pass Filter
Figure 7: Full Wave Rectifier and Low Pass Filter
2.2
Digital System
The digital system, constructed on ATMEL AVR Series ATMEGA16L microcontroller, has three main parts which are responsible for A/D conversion, serial communication and servo control.
STK500 development board and AVR Studio 4 with WinAVR compiler is used in the project. STK500 is a development board designed by Atmel as an evaluation board for its microcontrollers.
AVR Studio 4 is an IDE for writing and debugging AVR applicaitons in Windows operating systems. It comes with the STK500 development board for free.
With the WinAVR extension, it is possible to compile your codes in C language in AVR Studio.
At the early stages of the development no external crystal oscillator was used but during the finalization of the project 16MHz crystal was mounted in the crystal port of STK500.
2.2.1 Analog-Digital Converter
Despite the dominance of the digital devices, our world is still analog by nature. Microcontrollers are able to handle analog data after converting it to digital form. ADC represents the analog voltage applied to one of the ADC input pins by numbers of bits.
ATMEGA16L provides 8-channel 10bit ADC. The number of channels indicates the number of pins supporting the ADC functionality allowing the user attach up to 8 analog sources to the microcontroller. The 8 ADC channels are connected to internal DAC through multiplexer which connects ADC channels to the internal ADC. One channel is passed through the multiplexer to the ADC at a time. [9]
In the project only one channel is used as the EMG built is only one channel.
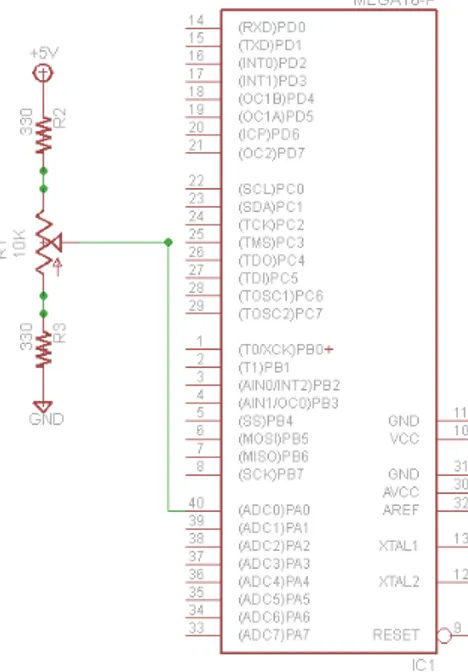
The ADC channels provided on the ATMEGA16 are located on the PORTA pins, which indicates that they are connected to the PORTA header on the STK500 board. As the ADC is 10bits we can read values
Figure 8: Block diagram of the Digital System
Figure 9: A/DC Test Circuit
from 0 to 1023.
n = (210) − 1 = 1023 (4)
By the resolution of 1024, given the 5V full scale power supply we can read the difference in every 4,88mV. 5V
1024 = 4, 88mV (5)
At the early stage of development a 10K potentiometer is wired to 5V source and to ground on the outside terminals and the center terminal is connected to the first ADC channel, PA0, to test the ADC without connecting the EMG to microcontroller.
ADC code written is on the free-running mode which continuously updates the ADC reading the voltage on PA0. First step is to configure the ADC hardware by setting the bits in internal registers for the ADC. After the ADC hardware settings are done then ADC is enabled and analog to digital conversions are started. [10]
ADCSRA |= (1 << ADPS2) | (1 << ADPS1) | (1 << ADPS0); // Set ADC prescalar to 128 ADMUX |= (1 << REFS0); // Set ADC reference to AVCC
ADMUX |= (1 << ADLAR); // Left adjust ADC result to allow easy 8 bit reading ADCSRA |= (1 << ADFR); // Free-Running Mode
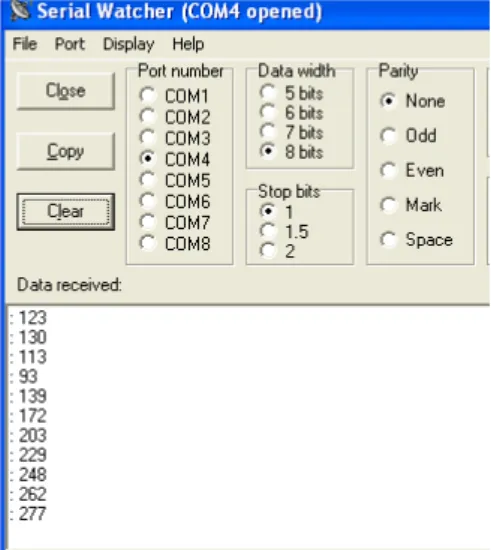
Figure 10: Terminal screen of Serial Watcher
ADCSRA |= (1 << ADEN); // ADC Enabled ADCSRA |= (1 << ADSC); // Start Conversion 2.2.2 Serial Communication
The USART hardware contained in ATMega16L allows the microcontroller to transmit and recieve data serially to and from another AVRs or computers.
USART requires three wires for bi-directional communication,Rx, Tx and GND. In the thesis project done, STK500 development board is connected to the computers USB port by an RS-232 to USB converter.
The aim of the USART used in the project is to see the values gathered from EMG amplifier after the analog to digital conversion.
UBRRL = BAUD_PRESCALE;
// Load lower 8-bits of the baud rate value into the low byte of the UBRR register UBRRH = (BAUD_PRESCALE >> 8);
// Set frame format to 8 data bits, no parity, 1 stop bit UCSRC |=(1 << URSEL)|(1<<UCSZ1)|(1<<UCSZ0);
// Enable receiver and transmitter UCSRB = (1<<RXEN)|(1<<TXEN);
[11] Initilazing USARTis followed by the data transmitting function; while((UCSRA&(1<<UDRE)) == 0);
UDR = Data; //UDR = u8Data;
The results are seen by a terminal program called ’Serial Watcher’. 2.2.3 Servo Control
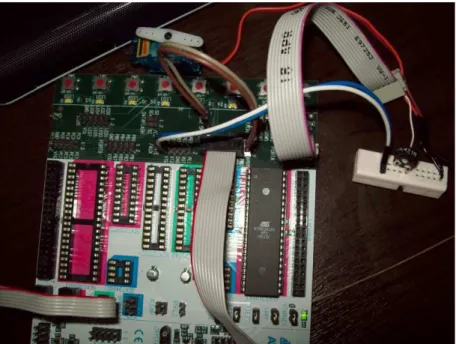
The servo motors have 3 inputs; ground, voltage source and pulse width modulation input signal. PWM is a way of digitally encoding analog signal levels bu using counters, the duty cycle of square wave is modulated to encode a specific analog signal level. It is used to control the angle of the servo.
DDRD = 1 << (5)); //PD5 is assigned as output TCCR0 = 1 << (CS01); //Start Timer 0
Figure 11: Servo Motor connected to the STK500 development kit
ICR1 = 0xFFFF; //Set Max limit for the Timer, ~16ms period on 4MHz TCCR1A = 1 << (WGM11) | 1 << (COM1A1); //Fast PWM, Wave Form output TCCR1B = 1 << (CS10) | 1 << (WGM13) | 1 << (WGM12);
OCR1A = 3000;
Depending on the ADC value the OCR1A value is changing making the servo move clockwise or counter-clockwise.
3
Discussions and Conclusion
Our EMG amplifier works quite well as simulated early on the design stage with little noise.
To reduce an implicit capacitance effect, the electrodes can be placed near the amplifier, which means the amplifier should be located as close to the signal source as possible and also to reduce the ambient noise effect the amplifier circuit can be placed on a printed circuit board and then covered with a metal box acting as a Faraday cage.
By increasing the order of the Butterworth filters used in the amplifier stage stepper roll off and flatter pass band can be obtained for better results.
The analog to digital converter and the serial communication parts were working well without any prob-lems. Some further improvements can be done regarding to the ADC. Even the ATmega16 microcontroller supports enough ADC resolution for this project, for further projects use of another microcontroller with higher bits of ADC can be used for more precise measurements.
The servo motor controller connected to the ADC, converting the analog signal taken from the EMG was aimed to change the angle of the servo motor depending on the amplitude of the EMG signal.
By the adjustment of the amplifier giving zero input signal while the muscles are at rest position, motor drive is intended to turn back to this initial position when there is not any contraction of the muscles.
This project has provided an insight for the bioelectricity and is a start for more projects such as detecting the nerve impulses that are sent to upper limb and then transferring them to the prothesis.
References
[1] David Isaza Andres Herrera, Andres Bernal and Malek Adjouadi. Design of an electrical prosthetic gripper using emg and linear motion approachs.
[2] Saksit Siriprayoonsak. Real-time measurement of prehensile sig-nals. Master’s thesis, San Diego State University, the USA. http://medusa.sdsu.edu/Robotics/Neuromuscular/Theses/Saksit/Saksit.htm.
[3] H.C. Chen. Electromyography (emg) fundamentals and interpretation. 1999. http://www.cyut.edu.tw/ hcchen/downdata/emg-fnd.pdf.
[4] Wikipedia. Electromyography. http://en.wikipedia.org/wiki/Electromyography.
[5] John Enderle, Susan M. Blanchard, and Joseph Bronzino. Introduction to Biomedical Engineering,
Second Edition. Academic Press, 2005.
[6] Joseph J. Carr and John M. Brown. Introduction to Biomedical Equipment Technology, Third Edition. Prentice Hall, 1998.
[7] David M. Thompson. Electromyography. 1998. http://moon.ouhsc.edu/dthompso/pk/emg/emg.htm.
[8] Burr-Brown. Precision, low power instrumentation amplifiers ina129p datasheet. http://www.datasheetcatalog.org/datasheets/270/255497DS.pdf.
[9] Richard H. Barnett, Larry O’Cull, and Sarah Cox. Embedded C programming and the Atmel AVR ,
Second edition. Clifton Park, 2007.
[10] Ken Worster. Newbie’s guide to the avr adc. 2007. http://www.avrfreaks.net/.
Appendix A: ATmega16 Code in C
#include <avr/io.h> #include <avr/interrupt.h> #include <stdio.h> #include <stdint.h> #include <stdlib.h> #include <util/delay.h> #define BitVal(x) (1 << (x)) #define F_CPU 3686400 #define USART_BAUDRATE 9600#define BAUD_PRESCALE (((F_CPU / (USART_BAUDRATE * 16UL))) - 1) char buffer[15];
double adc_voltaj; void USART_vInit(void);
void USART_vSendByte(char Data); void usart_tx_string( char *string); void InitADC()
{
ADMUX=(1<<REFS0); // For Aref=AVcc;
ADCSRA=(1<<ADEN)|(1<<ADPS2)|(1<<ADPS1)|(1<<ADPS0); //Rrescalar div factor =128 }
uint16_t ReadADC(uint8_t ch) {
//Select ADC Channel ch must be 0-7 ch=ch&0b00000111;
ADMUX|=ch;
//Start Single conversion ADCSRA|=(1<<ADSC);
//Wait for conversion to complete ADCSRA|=(1<<ADIF);
return(ADC); }
void USART_vInit(void) {
UBRRL = BAUD_PRESCALE; // Load lower 8-bits of the baud rate value into the low byte of the UBRR register UBRRH = (BAUD_PRESCALE >> 8);
// Set frame format to 8 data bits, no parity, 1 stop bit UCSRC |=(1 << URSEL)|(1<<UCSZ1)|(1<<UCSZ0);
UCSRB = (1<<RXEN)|(1<<TXEN); }
void USART_vSendByte(char Data) //USART_vSendByte(uint8_t u8Data) {
// Wait if a byte is being transmitted while((UCSRA&(1<<UDRE)) == 0);
// Transmit data
UDR = Data; //UDR = u8Data; }
void usart_tx_string( char *string) { while(*string) { USART_vSendByte(*string++); } } int main() { uint16_t adc_result; USART_vInit(); InitADC();
DDRD = BitVal(5); //Program PORTD5 pin as output TCCR0 = BitVal(CS01); //Start Timer 0
ICR1 = 0xFFFF; //Set Max limit for the Timer, ~16ms period on 4MHz TCCR1A = BitVal(WGM11) | BitVal(COM1A1); //Fast PWM, Wave Form output TCCR1B = BitVal(CS10) | BitVal(WGM13) | BitVal(WGM12);
OCR1A = 5000; //1.5mS while(1)
{
adc_result=ReadADC(0) ; // Read Analog value from channel-0 itoa(adc_result,buffer,10);
usart_tx_string((char *)": "); usart_tx_string(buffer); // _delay_ms(200);
if(TCNT0 > 200){ // Process the key press with a delay TCNT0 = 0;
if(( adc_result < 0) && (OCR1A > 1100) OCR1A --; //turn clockwise
if (( adc_result = 0) && (OCR1A > 10000)) OCR1A ++; // turn counter clockwise }
}
return 0; }