VTI rapport 638A Published 2009
www.vti.se/publications
Distraction and drowsiness – a field study
Technical report
Katja Kircher Albert Kircher Fredrich Claezon
Publisher: Publication: 638A Published: 2009 Project code: 40658 Dnr: 2006/0226-26
SE-581 95 Linköping Sweden Project:
IVSS Distraction and Drowsiness
Author: Sponsor:
Katja Kircher, Albert Kircher and Fredrich Claezon Saab, within IVSS programme
Title:
Distraction and drowsiness – a field study. Technical report
Abstract (background, aim, method, result) max 200 words:
The main goal of the distraction and drowsiness field study was to evaluate a system for detecting driver distraction and drowsiness. This report focuses on the system implementation and the algorithms detec-ting distraction and drowsiness.
A vehicle was instrumented with video cameras, an automatic eye tracker and GPS receivers. Further data were read from the CAN bus of the car. The data were logged continuously with high frequency. The log system operated autonomously. Seven participants drove the vehicle during one month each. During the first ten days a behavioural baseline was collected. Afterwards the warnings were activated, such that the drivers received distraction warnings in form of a vibration in the seat when the algorithm determined that they had looked away from the forward roadway too much. A separate algorithm judged whether the drivers were drowsy or not. Questionnaires were administered on three occasions during the course of the study.
No major problems were encountered during the field operational test (FOT), but a number of smaller problems had to be solved. However, in the end of the data collection period the computer installed in the car became more and more unstable, which led to increased data loss.
Keywords:
Utgivare: Publikation: 638A Utgivningsår: 2009 Projektnummer: 40658 Dnr: 2006/0226-26 581 95 Linköping Projektnamn:
IVSS Distraction and Drowsiness
Författare: Uppdragsgivare:
Katja Kircher, Albert Kircher och Fredrich Claezon Saab, inom IVSS-programmet
Titel:
Distraktion och sömnighet – en fältstudie. Teknisk rapport
Referat (bakgrund, syfte, metod, resultat) max 200 ord:
Huvudmålet med distraktions- och sömnighetsstudien var att utvärdera ett system för att detektera förar-distraktion och sömnighet. Denna rapport fokuserar på systemimplementationen och algoritmerna som detekterar distraktion och sömnighet.
En försöksbil utrustades med videokameror, en automatisk eye tracker och GPS-mottagare. Dessutom loggades data från fordonets eget nätverk (CAN). Datamaterialet lagrades kontinuerligt med hög
frekvens. Loggsystemet fungerade autonomt. Sju deltagare körde fordonet under en månad var. Under de första tio dagarna samlades data om vanligt körbeteende utan varningssystem (baseline). Sedan aktivera-des varningarna, vilket innebar att förarna fick en varning i form av en vibration i förarsätet när algorit-men bedömde att de hade tittat bort från vägen för länge. En separat algoritm bedömde om förarna var sömniga. Enkäter fylldes i vid tre tillfällen under studiens gång.
Inga större problem uppstod under försökstiden, men ett antal mindre problem behövde lösas. I slutet på försöksperioden blev logg-datorn mer och mer instabil, vilket ledde till ökat databortfall.
Nyckelord:
distraktion, fältstudie, eye tracking, metod
Preface
This report is the second in a series of three. The first one is the literature review on driver distraction by Kircher (2007), which builds the theoretical foundation for the study described here. In this present report the method and procedure are described in detail, and the method is evaluated for its usefulness in the context of distraction mitiga-tion research. The third part of the series contains results of the study, together with a discussion of the results (Kircher, Kircher & Ahlström, 2009).
The authors would like to thank Henrik Otto (SmartEye AB) for contributing with a description of the real time eye tracker used in the present study (Chapter 4.3), and Serge Boverie (Continental Corporation) for providing the description of the drowsiness detection algorithm (Chapter 5.4).
We thank Arne Nåbo at Saab for trusting us with the conduction of this study, which let us explore new grounds. At VTI we thank Birgitta Thorslund (now ÅF) for helping us with recruiting and informing participants, Lena Nilsson for general support, and Karl Hill, Peter Ståhl and Carl-Johan Ydrevik for fantastic technical support.
Linköping March 2009
Quality review
Review seminar was carried out on 18 December 2008 where Jan Andersson, VTI, reviewed and commented on the report. Katja Kircher has made alterations to the final manuscript of the report. The former research director of the project manager, Lena Nilsson, examined and approved the report for publication on 6 March 2009.
Kvalitetsgranskning
Granskningsseminarium genomfört 2008-12-18 där Jan Andersson, VTI, var lektör. Katja Kircher har genomfört justeringar av slutligt rapportmanus 2008-12-29. Projektledarens tidigare chef Lena Nilsson har därefter granskat och godkänt publikationen för publicering 2009-03-06.
Table of Contents
Summary... 5 Sammanfattning ... 7 1 Introduction ... 9 2 Participants ... 10 3 Vehicle ... 114 Data acquisition system ... 12
4.1 Power module... 12
4.2 Data acquisition hardware ... 13
4.3 Smart Eye Pro ... 15
4.4 Mobile hard disk... 17
4.5 GPS in the instrumented vehicle... 18
4.6 Digital mobile video recorder ... 21
4.7 VGA-FBAS video converter ... 24
4.8 Camera for driver monitoring ... 24
4.9 Monitor, keyboard, mouse ... 26
4.10 Network... 26
4.11 Audio mute box... 26
4.12 Software... 26
5 Inattention and drowsiness detection system ... 30
5.1 World model car... 30
5.2 Inattention detection algorithm... 31
5.3 Distraction warning ... 34
5.4 Drowsiness warning algorithm ... 34
5.5 Drowsiness aarning ... 36
5.6 Inhibitions... 38
5.7 Manual ... 39
5.8 Display ... 39
6 Experimental design and procedure ... 44
6.1 Initial contact... 46
6.2 Middle contact... 47
6.3 Final contact ... 47
6.4 Participant initiated contacts ... 48
7 Log data... 49
8 Discussion of method ... 50
9 Lessons learned ... 52
9.1 Participants ... 52
9.2 Vehicle ... 53
9.3 Design and procedure ... 62
9.4 Data analysis ... 63
References ... 65 Appendices
Distraction and drowsiness – a field study. Technical report by Katja Kircher, Albert Kircher and Fredrich Claezon∗
VTI (Swedish National Road and Transport Research Institute) SE-581 95 Linköping Sweden
Summary
The main goal of the distraction and drowsiness field study was to evaluate a system for detecting driver distraction and drowsiness. This report focuses on the system
implementation and the algorithms detecting distraction and drowsiness. A previous report dealt with the background of driver distraction, the results of the study are presented in a further report.
A vehicle was instrumented with video cameras, an automatic eye tracker and GPS receivers. Further data were read from the CAN bus of the car. The data were logged continuously with high frequency as long as the ignition was on. The log system
operated autonomously and was switched on with the turning of the ignition key. Seven participants drove the vehicle during one month each. During the first ten days the distraction and drowsiness warning system was deactivated, in order to collect a behavioural baseline. After this the warnings were activated, such that the driver received distraction warnings in form of a vibration in the seat when the algorithm determined that they had looked away from the forward roadway too much. A separate algorithm judged whether the drivers were drowsy or not. Three drowsiness levels existed, which led to three different warnings with increasing intensity for increasing drowsiness. The eye tracking system installed in the car afforded real time eye tracking, which is necessary for giving glance direction based or blink duration based warnings in real time.
The participants filled in questionnaires about their driving habits, their attitudes about driver distraction and drowsiness, and their expectations towards the warning system as well as their experiences with the system. A number of questionnaires were
administered on three occasions during the course of the study.
No major problems were encountered during the field study, but a number of smaller problems had to be solved. However, in the end of the data collection period the computer installed in the car became more and more unstable, which led to increased data loss. Again, piloting was shown to be essential, as well as a clear delimitation of the goals and hypotheses of the project.
The obvious potential of the distraction detection system was pointed out by the positive comments of the participants, but having a system which is reliable in all situations and for all drivers is still a difficult task.
Distraktion och sömnighet – en fältstudie. Teknisk rapport av Katja Kircher, Albert Kircher och Fredrich Claezon∗
VTI
581 95 Linköping
Sammanfattning
Det viktigaste målet med fältstudien om förardistraktion och -sömnighet var att utforska ett system som skulle detektera förardistraktion och sömnighet. Denna rapport fokuserar på systemimplementationen och algoritmerna som ska detektera distraktion och sömnig-het. En föregående rapport belyste bakgrunden för förardistraktion och resultaten finns i ytterligare en rapport.
En personbil instrumenterades med videokameror, en automatisk eye tracker och GPS-mottagare. Ytterligare data loggades från fordonets eget nätverk (CAN). Dataströmmen loggades kontinuerligt och med hög frekvens så länge tändningen var på. Logsystemet arbetade autonomt och startade när tändningen slogs på. Sju personer körde bilen under en månad var. Under de första tio dagarna var varningssystemet inaktiverat, för att logga referensdata (baseline). Efter detta slogs varningssystemet på, varpå förarna fick distraktionsvarningar som vibrationer i förarsätet när de hade tittat bort från vägen för mycket enligt algoritmen. En separat algoritm bedömde om förarna var trötta eller inte. Tre olika sömnighetsnivåer existerade, vilka ledde till tre olika varningar med ökande intensitet för ökande sömnighet. Eye tracking-systemet, som var installerat i bilen, erbjöd ögontracking i realtid, vilket är nödvändigt för varningar som ges baserade på blickriktning och blinkduration.
Deltagarna besvarade enkäter som handlade om deras vanliga körbeteende, deras in-ställningar angående förardistraktion och sömnighet, deras förväntningar om varnings-systemen och deras erfarenheter med varningsvarnings-systemen. Enkäterna fylldes i vid tre olika tillfällen under försöksperioden.
Inga större problem dök upp under studiens gång, men ett antal mindre problem be-hövde lösas. Vid de sista körningarna blev datorn mer och mer instabil, vilket ledde till en ökad dataförlust. Även i denna studie visade det sig att förstudier (pilots) var mycket betydelsefulla, liksom en klar beskrivning av hypoteserna och målen i projektet.
Potentialen av ett distraktionsvarningssystem påpekades av de positiva kommentarerna som deltagarna gav, men det är än så länge svårt att leverera ett system som är pålitligt i alla situationer och för alla förare.
1 Introduction
The partners in the project were Saab Automobile, leading the project, VTI, SmartEye, Siemens VDO (later Continental VDO), Scania and IDA at the University of Linköping. The goal of the complete project was to develop and evaluate a real-time distraction mitigation system and to evaluate a drowsiness mitigation system in a natural setting. Due to the reason that the eye tracker used in the study had not been subjected to this kind of long-term field test before, and that the method used was quite new for all partners involved, another goal of the study was to evaluate both the equipment and the method itself. It was planned to instrument one Saab passenger car and one Scania truck with the same distraction and drowsiness warning systems. Due to delays occurring while instrumenting the Scania truck it was decided to treat the two vehicles separately. The focus of the passenger car part was on driver distraction, while drowsiness was more important for the truck study.
This report describes in detail the method used for the passenger car part of the IVSS Driver Inattention and Drowsiness project. Therefore the main focus is directed at the issues around the distraction warning system. The drowsiness warning algorithm is described, but otherwise drowsiness will not be treated within this report. For a description of the truck study the reader is referred to Kovordányi, Kolleger, Claezon and Grandlund (2009, in press).
Previously natural distraction has been studied and assessed in the field, based on video recordings and on crash databases (Klauer, Dingus, Neale, Sudweeks & Ramsey, 2006; Stutts et al., 2003; Stutts, Reinfurt, Staplin & Rodgman, 2001). Distraction mitigation systems have emerged only recently, however, and they have only been investigated in simulators. Those studies showed, however, that it was difficult to attain “true distrac-tion” in an artificial setting (e.g. Almén, 2003; Karlsson, 2005). Distraction mitigation researchers, who performed a series of experiments in different simulators recommend using a field test for further evaluation of distraction mitigation systems (e.g. Donmez, Ng Boyle & Lee, 2006; 2007; Donmez, Ng Boyle, Lee & McGehee, 2006; Zhang & Smith, 2004). It was deemed necessary to choose a setting where the driver is not disturbed by an experimental leader in the vehicle. It was also considered important to let the driver go about his or her daily routines, providing a setting that was as natural as possible. This ruled out test-track and short term studies in real traffic.
These considerations together with the maturation of remote eye tracking systems, which can be operative for a long time without experimenter intervention, led to the decision to perform a distraction mitigation test in the field, using the general methodo-logical setup of a field operational test (FOT), but on a smaller scale than common for this type of test. A detailed literature review on distracted driving with focus on
methods used to assess driver distraction and on eye glance behaviour was conducted by Kircher (2007) in preparation for the study described here.
In this report a detailed description of the method used is given. At first the participants are described, then the vehicle and the data logging equipment is presented, and in Chapter 6 the experimental design is introduced. Finally an evaluation of the method used is made, together with “lessons learnt” from the study, which can be seen as practical tips for researchers interested in conducting similar studies. Detailed technical data can be found in the appendices. The results of the study will be presented in a further report (Kircher, Kircher & Ahlström, 2009).
2 Participants
Due to time and budget constraints it was clear from the beginning that the number of participants would be small. The goal was to run eight drivers, but technical problems with the vehicle causing delays entailed that only seven participants could be run. One way to deal with a small number of participants is to reduce the variance between them as much as possible in order to be able to find effects resulting from the introduction of the warning system. For a methods evaluation, however, it would be desirable to have a large variation between the participants, because this would probably cover a larger range of situations that can cause problems, which would allow a more thorough assessment of the method.
Due to the fact that distraction warning systems are quite new, and have never been assessed in the field before, it was not immediately clear in which respects drivers would need to be homogeneous to reduce the variance between them. Considering this uncertainty and the fact that many other factors like weather, lighting and possibly other outside influences would vary substantially over the course of the study it was decided to opt for the approach to select participants with varying driving patterns, but who had a number of features in common.
The main requirement for participation was high mileage, the goal was to recruit drivers who covered at least 200 km per day. The reason for that was to maximise the data acquisition in the time available for each participant. The participants should not be professional drivers, however, because there is a chance that professional drivers show qualitatively different behaviour than non-professionals, especially with respect to dealing with distraction. Further requirements were that the drivers should be at least 25 years of age, and they should have held their driver’s licence for at least seven years. This should ensure an exclusion of novices.
The remote eye tracking system SmartEye Pro 4.0 works best if the driver’s features are clearly visible, this is particularly important for the corners of the eyes and the corners of the mouth. In order to ensure good eye tracking results the participants should not wear eye glasses, they should not apply heavy mascara and should not be bearded. A beard might cover the corners of the mouth, make-up can make it difficult for the system to find the corners of the eyes, and eye glasses can be problematic, because the frame can occlude part of the eyes, and the reflections in the glasses can disturb the eye tracker. Sun glasses are particularly difficult to handle for the system.
In order to find participants that fulfilled these criteria health centres dispatching district nurses, travelling salesmen and drivers from VTI’s participant database were contacted. Participants and institutions showing interest in the study were given an information leaflet describing the purpose of the study and the requirements for participating (see Appendix 1). The project received some attention by the press, which subsequently led to interested people’s contacting VTI, wishing to participate in the study. In total one district nurse, one travelling salesman, one forest technician, two employees of two different institutes, one university employee and one doctoral student participated in the study.
The participants did not receive any monetary compensation for their efforts. They received reimbursement for fuel, however, when the experimental car consumed more than the participants’ own car. Additionally, they could reduce wear and tear on their own cars, because they used the experimental car for a month.
3 Vehicle
The test car was a Saab 9-3 SportCombi Aero from 2007 with a 2.8 litre engine and automatic transmission with six gears (see Figure 1). It was provided by SAAB Automobile AB. The Saab 9-3, as well as its predecessors Saab 900 and the major model Saab 9-5 are quite common in Sweden.
It would have been preferable to choose a more environmentally friendly vehicle. It is also possible that the relatively high performance specifications encouraged drivers to exhibit behaviour that might not be typical for them otherwise. The vehicle choice could, however, not be influenced by the project partners.
The front passenger airbag was disabled for participants who had child restraints in front. Besides a visible camera behind the passenger seat the car looked just like a standard Saab 9-3.
4
Data acquisition system
The data acquisition system consists of several modules, collecting data both from the own network of the vehicle and from external sensors. A detailed description of the hardware is given in this chapter.
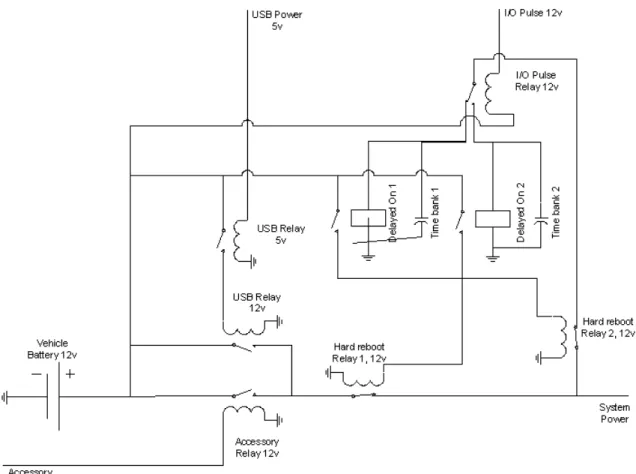
4.1 Power
module
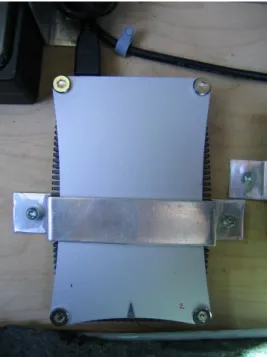
The hardware was mounted in the spare wheel compartment. No hardware (besides the cameras and two small GPS receivers) were visible for the driver. The power system is shown in Figure 2. An important requirement was that the hardware onboard should not draw so much power to discharge the battery, furthermore the voltage had to be very stable and within certain limits. From the car battery the power was led through a control hardware in order to allow for example the computer to shut down in a controlled way when the car was stopped and the ignition key removed, furthermore functions for hard-resetting the computer were present. It is well known that certain hardware components are vulnerable to high and low temperature, as well as humidity and vibrations. For this reason additional cooling fans were installed in order to keep the temperature at acceptable levels, furthermore an active thermostat-controlled heating fan was installed to raise the temperature in cases the car was parked outside in sub-freezing conditions during the night (this was especially important for the hard disks). Humidity was controlled as well with the fans leading air out of the spare wheel compartment. In order to ensure sufficient battery capacity a second full size battery was installed in the car. Voltage spikes arising from the starting motor of the car can cause damage to the computer; these were filtered by the second battery and its protection circuits. All contacts and connectors were proofed for vibration resistance. For safety reasons no 110 or 230 Volt power was in the vehicle, all hardware was running on 12 Volt or lower voltage.
Figure 2 Power logic for the hardware.
4.2
Data acquisition hardware
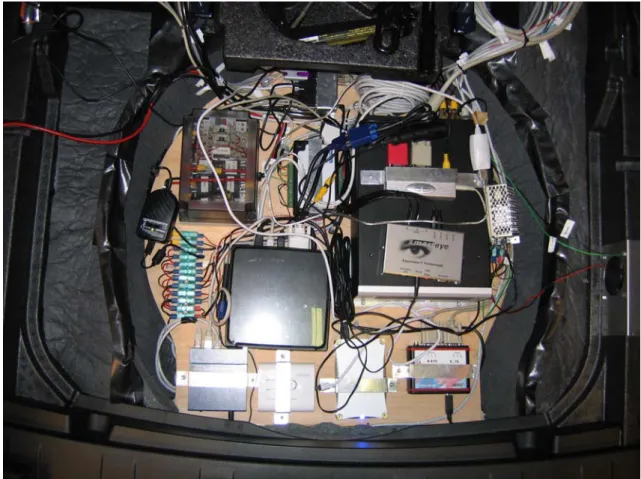
As mentioned the data acquisition system was mounted in the spare wheel compartment of the car, as can be seen in Figure 4. Data was acquired from different sensors: vehicle data from the CAN bus, position data from GPS sensors, video data from cameras and gaze and eye blink data from the eye tracking system. A CAN bus interface collected relevant CAN data, whereas AD-converter digitised other analogue data in the car. Besides the video recordings all data were stored via the computer (USB connections) on an external hard disk. This allowed to replace the external hard disk quickly when a new participant started to drive. The data was stored in simple ASCII files, this was seen as more robust and less resource consuming than opting for real time acquisition in a data base. The computer ran on Windows XP, algorithms and data collection routines were developed in C++.
Figure 4 Data acquisition system in the spare wheel compartment.
4.3
Smart Eye Pro
The gaze and eye lid-tracking system used was Smart Eye Pro 4.0, with two 8 mm IDS uEye USB-cameras fitted with band pass filters to keep interference from sunlight and other external light sources to a minimum. The face was illuminated using two NIR LED arrays mounted near each camera.
A special software update was made that enabled a re-calibration of the cameras based on the head model of the driver.
4.3.1 Hardware
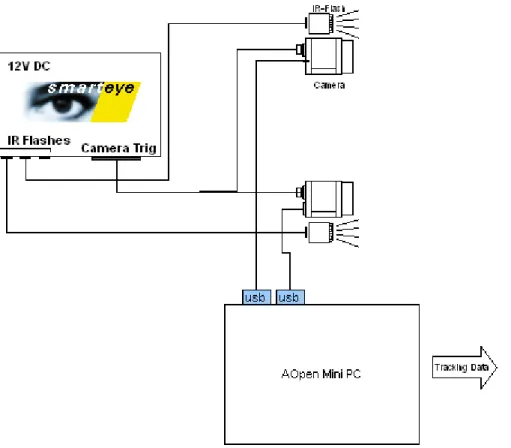
The long term exposure to a demanding vehicle environment and the limited power availability in the car made a regular PC with a frame grabber card and analogue cameras nearly impossible to use. Instead a light weight AOpen 12V MiniPC and uEye-1220 USB cameras were selected. The cameras were chosen because of the ability to run on USB, their durability, low power consumption and their good sensitivity in the NIR spectrum. Due to the limited bandwidth of USB, the cameras were set to run at 42Hz. The illumination and cameras were synchronised using an external processor (cf. also Figure 5).
Figure 5 A schematic overview of the SmartEye Pro system.
4.3.2 Software
Smart Eye Pro is a non-intrusive full 3D head and eye tracking system. It provides head position and rotation, a 3D gaze vector and the eyelid opening in millimetres. For a distraction and fatigue warning system, the eye lid and gaze direction measurements are most important.
The output from the system is an eye lid opening measure, in millimetres and a gaze vector originating in the middle of both eyes. A world model with various areas of interest, such as the dashboard, speedometer and windscreen is defined, and the system outputs which, if any, of the areas of interest the gaze vector intersects.
The intersections, the gaze vector and the current area of interest is then sent to the attention and fatigue detection algorithms over a UDP connection.
4.3.3 Algorithm outline
A 3D head model is calculated using manually marked snapshots from the subjects face in different head poses. The snapshots also provide templates for feature tracking and larger templates for finding the face in the camera image. The head model only needs to be created once for each subject.
When a head is found, each feature point is tracked and the head pose is then calculated using the tracked positions and the previously calculated head model. For subsequent frames the previously tracked and fitted pose is used as starting points for the feature tracking. If tracking is lost, the system will go back to face finding mode until a face is found again (see Figure 6).
Figure 6 Flow diagram of the tracking algorithm.
With the 3D head pose we can find the areas where the eyes and eyelids are located. Using filtering and edge detection we provide input images to our iris and eye lid tracking algorithms. The gaze vectors is built using the position of the eye centre in the head model and the tracked positions of the iris and the eye lid opening is found by fitting an arc to the edges of the eyelids.
4.4
Mobile hard disk
To allow easy handover of log data the vehicle computer stored the data on an external hard drive (Figure 7). Thus it was easily possible to replace the hard drive with a second one when the car was handed over, and between the baseline and the experimental phase, without need to copy files directly from the computer.
The requirements were: − Small design
− Rugged, temperature and vibration resistant construction − Large size (at least 100 Mbytes)
− USB 2.0 of IEEE-1394 connection (possible Firewire 800).
The selected model was a Hitachi Travelstar HTS421212H9AT00, 4200 RPM, 2,5´´, 120 GB.
The 2,5” enclosure was a standard model with Firewire 800, USB 2.0 and DC input connection. External power connection was not needed, as both Firewire 800 and USB carry power to the device. A second swap hard disk was available (with the same enclosure).
Figure 7 The hard disk for log data, mounted in the vehicle.
4.5
GPS in the instrumented vehicle
GPS receivers were needed to log geographical position data and give input to a digital map to record the vehicle position in real time. One receiver was used to log position data directly, the other as input for the digital road map. When the actual position of the vehicle is known, it is possible to acquire information about the road layout like the type of road, the presence of intersections, the speed limit and also about weather conditions off-line. This information allows matching situations for a more detailed analysis. The requirements were:
− Small design
− Rugged, temperature and vibration resistant construction − USB connection
− 1 HZ update rate − SirfIII GPS chip.
Figure 8 GPS receiver.
The GPS receivers were placed close to the window on the left hand side in the rear part of the car (see Figure 9). This guaranteed both a relatively free view to the sky and protection from precipitation.
Figure 9 Placement of the GPS receivers in the car.
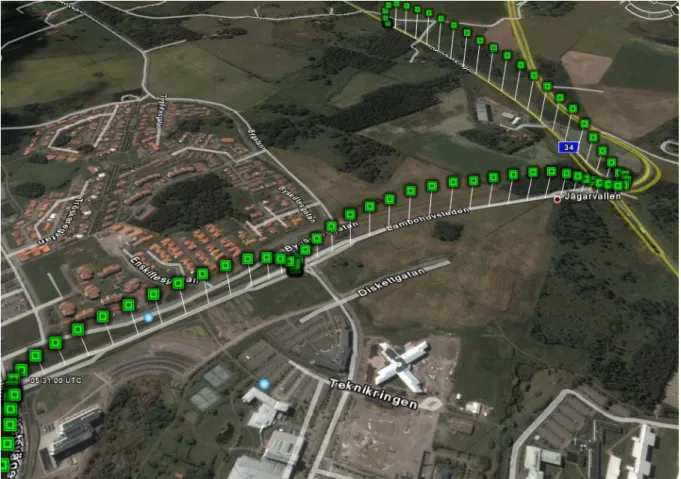
For logging the GPS position a custom program was developed. This program started each time the computer started and logged the GPGGA and GPRMC NMEA data sentences. GPGGA is the GPS system fix data, and GPRMC is the recommended Minimum Specific GPS/TRANSIT data. The sentences are described in Appendix 6. The logging software created a new log file each time the computer was started.
Synchronization with the other log data was possible via the time information, received from the GPS satellites. The computer time was adjusted with the GPS time, too. The raw NMEA data was converted to Keyhole Markup Language (.kml) files to view directly on Google Earth or similar digital mapping programs. A simple freeware pro-gram performed the conversion and displayed the route travelled by the participants on the digital map, complete with speed information. A sample digital map is shown in Figure 10, note that the speed of the vehicle is represented by the height of the green position dots. The street names are also visible in the map. The NMEA data can be used for other purposes as well, such as finding maximum speeds on certain road types, etc.
Figure 10 GPS NMEA position file displayed in Google Earth.
The second GPS receiver was used to update a digital map, which was recorded via the video recorder. Microsoft Autoroute was used to display the real time GPS position. This was visualised full screen, and the video signal was directly recorded by the video logger, see figure below. The digital map was always centred around the vehicle position, which is represented by the red dot in Figure 11.
Figure 11 GPS real time position information displayed on MS Autoroute digital mapping software.
As the video recorder can act as a web server it was planned to send the mapping data in real time, such that they could be seen any web browser or directly on computers
connected via remote terminal. However, due to technical problem with the wireless connectivity of the vehicle via 3G/GSM modem this was not possible.
4.6
Digital mobile video recorder
The digital video recorder stored four video inputs: computer screen, real time map (GPS position), vehicle front view, and driver.
The requirements were:
− Digital hard disk drive recorder − Long time recording (over 20 days) − Full stand alone operation
− Mobile hard drive recorder, rugged construction for in-vehicle use − Programmable settings for recording
− Possible to export videos in common format (for example avi or mpg) − Local support (in Linköping or at least Sweden).
Figure 12 Digital video logger.
The space needed for recordings on the hard drive is dependent on: − frame rate (frames per second)
− bit rate (image recording quality) − compression technology
− number of cameras
− audio recording (yes or no) − colour or b/w image − content of image − duration of recording.
In the present field test the 120 GB hard disk was sufficient for recording typical driving during the baseline respectively treatment phase. A second hard disk was available in order to allow for fast replacement when needed. Usually the hard disk was replaced during the shift from baseline to treatment phase. A USB enclosure allowed to connect the hard disks to a computer.
Figure 13 Video recording, actual example from test drive (driver’s face blurred for anonymisation purposes).
It was possible to jump directly to special pre-defined events in the videos, for example a distraction warning. On the upper left hand screen of the quad screen the outside scene in front of the car was visible, on the upper right hand screen the driver was filmed over the shoulder, on the lower left hand screen a map of the surroundings with the current position and a trace was shown, and on the lower right hand screen the view of the two eye tracker cameras, the drowsiness status as judged by the algorithm and the
inattention and drowsiness monitoring display were shown (see Figure 13). The display is described in more detail below.
The recording frequency and the disk space distribution for the four different views can be found in Table 1.
Table 1 Recording frequency, disk space distribution and available continuous recording time for the video logger.
camera target percent disk
space allocated recording frequency available continuous recording time
camera 1 outside scene 27% 5 Hz 1w5d
camera 2 cabin 38% 5 Hz 1w5d
4.7
VGA-FBAS video converter
In order to record the computer video signal in the digital video recorder a VGA-TV video converter was used.
The requirements were: − Small design
− Rugged, temperature and vibration resistant construction − Supported resolution minimally 1280*1024 pixels at 50 Hz − to 12 V power supply
− FBAS compatible video output.
The selected model was a Grand Hand View II VGA to TV converter (see Figure 14).
Figure 14 VGA to TV video converter.
4.8
Camera for driver monitoring
A camera to monitor the driver was installed above the right back seat. The view is visible in Figure 13. A camera with IR LEDs for night use was found to disturb the system, as mechanical relais control the IR lights (audible to the driver each time IR is switched on), furthermore the camera registered the IR light from the eye monitoring cameras. Thus a high sensitivity camera without IR lights was used. The camera is able to work at night time.
The requirements were: − Small design
− Rugged, temperature and vibration resistant construction − FBAS video output, 5, 6 or 12V operation
− High resolution and light sensitivity − Lens with variable zoom.
Figure 15 Camera for driver monitoring.
For safety reasons the mounting of the camera had to be secure enough to avoid loosening even in case of an accident. A passenger seated on the back seat on the right hand side should not be able to move the camera, rotate lenses or disconnect cables. The camera was mounted behind the passenger seat under the roof of the car (see Figure 16). It afforded a view of the driver’s body and hands from over his or her shoulder (see Figure 17).
Figure 16 Placement of the cabin camera under the roof of the car behind the passenger’s head rest.
Figure 17 View of the in-car camera observing the driver.
4.9 Monitor,
keyboard,
mouse
A standard computer keyboard and mouse were used. The monitor was a 12 V operated TFT 17” screen, with option to connect VGA and FBAS video. This allowed to connect the computer and to control the camera outputs directly. Computer, keyboard and mouse were only installed when the experimenter met the participant, not while a participant was driving it during the baseline and the experimental phase.
4.10 Network
It was planned to connect the vehicle’s computer to a network accessible via standard 3G or GPRS services, this was not possible due to technical problems. A standard network switch was installed, which connected video logging equipment, computer, and 3G modems. Furthermore a remote desktop application allowed using the car’s compu-ter via a desktop client.
4.11 Audio mute box
In order to disable the audio warning messages manually during the base line drive a mute box was installed, which muted the audio input to the speaker. The mute box had a simple switch which operated a relay to disconnect the audio input to the speaker.
4.12 Software
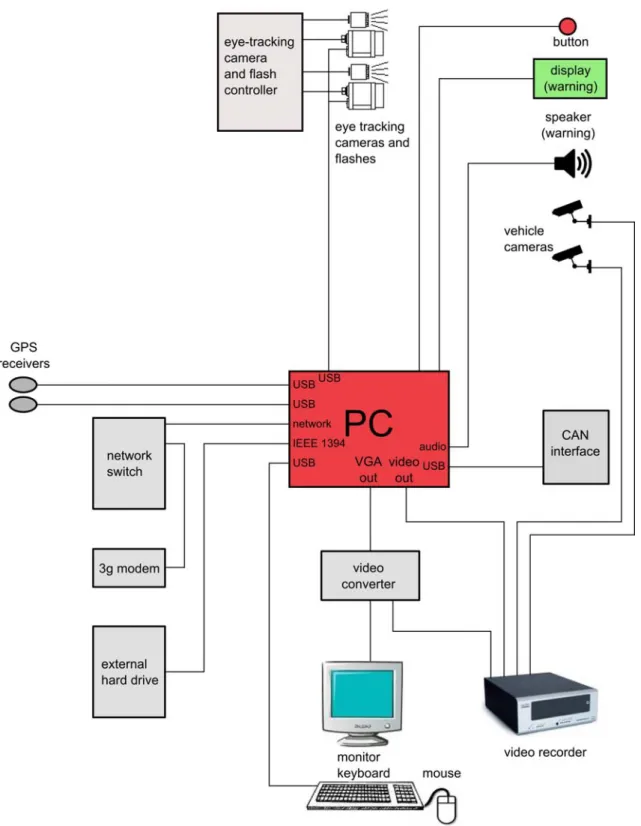
The computer ran on Windows XP SP2. The software system developed for the project consisted of several separate console programs written in standard C++ using distribu-ted software architecture (figure 1). The modules were compiled into separate execu-table binary files and communicated with each other using a UDP peer-2-peer network library called INet, which enabled scalability and possibility to share CPU load over several computers. UDP is often preferred in time sensitive applications as it is much faster and dropped packets are preferable to delayed packets, but it also implies careful consideration of data integrity due to this. This was handled with a ring ordered
ordering was broken. The network library acted as a gateway and translator of messages between the different communication standards used by the eye tracking software, the vehicle CAN bus, the I/O card, and the drowsiness detection system. Each data signal from the different modules was translated into a common set of signals, which in turn was available for all modules running on the local network. During the iterative process of developing the inattention algorithm some of the signals were simulated by Saab Driving Simulator, creating a real time test bench mixed with real and simulated values.
Figure 18 A schematic overview of the distributed architecture.
4.12.1 Configuration files
XML files were used to enable easy configuration during the design phase. Each module had one configuration file describing its INet communication settings in terms of module names and port settings. The modules had several individual files which were algorithm specific and were used to tune the different algorithms during the test phase. Some of the configuration files were altered during the experiment to handle the difference between the baseline period and the period when warnings were activated. 4.12.2 Data logging
The data logging functionality was distributed between all the modules and every input- and output signal was written to one ASCII file per module. The data were logged in a pre-determined frequency and each variable was upsampled to the highest working frequency of the module. Each log row was marked with a common time stamp, enabling synchronisation of data in the analysis phase. The upsampling was made on non time critical values not affected by distortion, while time critical values as eye tracking data and algorithmic output were logged in its original frequency. Apart from raw data input and algorithmic data, each module also logged special events as fault codes, inhibited warnings etc. The data logging algorithm had its own thread inside of each module, working in parallel with the main function utilizing thread safe message passing methods.
4.12.3 DrowsyServer
This server application was responsible for the communication between SDM, Siemens Drowsiness Module and the rest of the system. The SDM application was implemented by Siemens VDO and had a socket communication with a simple API for sending and receiving data to the server application (Figure 18). The server application provided eye tracking data to SDM from SmarteEye Pro at a rate of 42 Hz, and drowsiness output on INet from SDM at a rate of one new value every 30th second.
Figure 19 API overview for SDM client and server communication.
4.12.4 Inattention Decision Program
The Inattention Decision Program implemented the inattention algorithm described in section 5.2. The main inputs for this program were eye tracking data from SmartEye Pro and vehicle data from the CAN bus.
4.12.5 I/O Controller
The I/O Controller program communicated with a USB connected Input/Output device. The I/O device had 8 digital output ports and 8 digital input ports. The output ports were connected to the haptic motors which were used to warn the driver for inattention, to the Power Module for the required I/O pulse and to the video logger for annotation of special events. The input ports were used for the drowsiness acknowledge button which the driver pressed to confirm a drowsiness warning.
4.12.6 SmartEye converter
SmartEye Pro uses either UDP or TCP protocol to send its data to third party programs. Here the UDP settings were chosen and SmartEye Converter converted the received UDP data into INet data at 42 Hz.
4.12.7 Information display
The program was developed to give a real time visual representation of the system and its internal states. This was extensively used during the design phase and provided a powerful tool for developing the warning strategies. The program used openGL for fast drawing of data and statistics. See section 5.8 for more details regarding the Information Display.
4.12.8 CAN_Inet
The program monitored signals on the vehicle CAN bus through a USB connected CAN interface and forwarded them onto INet in combined packets. The signals were in some cases scaled and an offset was added to the original value. The selection of signals to be monitored were carefully chosen and configured through an XML configuration file. The program used a development library from Vector (Vector Informatik GmbH, Stuttgart, Germany), the company providing the CAN interface hardware.
4.12.9 Warning control
The program gathered all available information on INet and used rules to decide whether to warn and how to warn the driver at each given moment. The rules were based on simple if-then-else logic and fully configurable with three XML files.
<!‐‐ Speed is too low ‐‐> <Rule name="Low Speed">
<Speed lower="1" higher="0" equal="0">50</Speed> </Rule>
The above code snippet shows an example rule, which says that a warning should be filtered if the speed is lower than 50 km/h. See section 5.6 for more information regarding inhibition of warnings.
4.12.10 WinPos
This program moved every module into its correct position on the two screens connected to the computer. This precaution was made to ensure that the video data looked the same and that nothing got obscured by an irrelevant dialogue window.
5
Inattention and drowsiness detection system
The inattention and drowsiness warning systems were both based on real time eye tracking data, which were provided by the SmartEye system. Otherwise, both systems worked independently of each other. The drowsiness detection algorithm was developed by Siemens VDO, later Continental Cooperation. The distraction warning algorithm was developed jointly by Saab Automobile and VTI.
5.1
World model car
The car is subdivided into 15 different zones, which are the windscreen, the right front window, the left front window, the right rear view mirror, the left rear view mirror, the centre rear view mirror, the dashboard, the speedometer, the middle console, the glove box, the left front door, the right front door, the floor of the car, the foot area and the roof. Zones behind the driver’s seat are not defined, because glances of the driver behind this line will not be picked up by the eye tracker and recorded as lost tracking instead (Figure 20).
Figure 20 The world model of the vehicle, seen from behind the driver. The white rectangles determine the different defined zones, which were used for the algorithm. The green circle shows the position of the head. The yellow dots demarcate the cameras. The red line from the head through the windscreen indicates gaze direction, the blue dot indicates the intersection point between gaze direction and windscreen.
As long as the driver’s gaze is directed through one of the windows and not at the mirrors and lies at the same time within 90° forward, the driver is considered to be
looking at the “field relevant for driving” (FRD, see Figure 21). The rear-view mirrors and the speedometer are outside the FRD, but they are not considered to be completely irrelevant for driving. The literature indicates that the mean duration of glances to these targets is approximately 0.6 to 1.0 s (see e.g. (Kircher, 2007)). For the present study it was decided not to assume that the driver is attentive when he is looking at the those targets for the duration of one second or less, in order to account for the safety relevant aspect of checking the mirrors and the speedometer briefly. Prolonged glances of more than one second will, however, lead to the assumption that the driver is inattentive.
Figure 21 The ”Field Relevant for Driving” as seen from above, provided that the driver looks through a window.
Glances at all other zones lead to the immediate assumption that the driver is not attentive to driving at the moment. These assumptions are the foundations for the inattention detection algorithm, which is described in more detail below.
5.2
Inattention detection algorithm
One task within the project was to develop a distraction detection algorithm based on the initial work done by Almén (2003) and Karlsson (2005) supported by Saab
Automobile. So far the algorithms that were found in the published literature (Donmez, Ng Boyle & Lee, 2007; Victor, 2005) were not deemed to be validated enough to be seen as a promising candidates for the present project. An algorithm based on a world model of the vehicle was assumed to be more exact than more general approaches. The distraction detection algorithm developed here is based on the notion that both long single glances and repeated glances are detrimental to traffic safety. This is documented extensively in the literature (e.g. Kircher, 2007; Lee, McGehee, Brown & Reyes, 2002; Tijerina, Parmer & Goodman, 1999; Tsimhoni, 2003; Wikman, Nieminen & Summala, 1998).
For the algorithm it is assumed that the driver has a buffer of two seconds which can be spent looking at targets outside the field relevant for driving. Two seconds were chosen, because this value is often cited as critical for single glances (for a summary see
Kircher, 2007). Additionally, in the 100-car study it was shown that accumulated glances away from the forward roadway of more than 2 s within a window of 6 s led to
When the attention buffer is empty, the driver is considered to be visually distracted. The buffer is filled when the driver looks at the FRD and decreased when the driver looks at other targets, according to the rules described in the following sections.
Warnings are given when the driver is considered to be distracted and a number of other pre-conditions are fulfilled, that are described further down.
When the driver looks at targets that are completely irrelevant for driving safely, like the radio, the glove box, the car floor, etc., the buffer is decreased immediately with a factor of one, that is, for each second spent looking at something outside of the FRD, the buffer is decreased with one second. This way, a glance outside of the FRD that lasts for two seconds leads to a warning when no inhibition is active.
While driving it is important, however, to check both the speedometer and the rear-view mirrors. This was shown empirically with data from the 100-car study, that predict a lower crash-involvement for drivers that scan the mirrors and the speedometer (Klauer, Dingus, Neale, Sudweeks & Ramsey, 2006). The average glance duration to mirrors and speedometers lies at around 0.8 to 1.2 s, with minor variations between targets and studies (for a summary see Kircher, 2007). For the present algorithm it was decided to allow glances to the mirrors and the speedometer that last for one second before the attention buffer is decreased. It was assumed that the average glance duration to those targets reflects the time that is needed to obtain information that is relevant for driving. One second was chosen as an approximate average of the values reported in the
literature. During this second, while the glance rests on one of the mirrors or the speedometer, the attention buffer remains at the current level. Longer glances to those targets, however, are assumed to be unnecessary and an indication of visual driver distraction. Therefore, the attention buffer is decreased with a factor of one as soon as the glance time to the mirrors or the speedometer exceeda one second.
When the driver looks back to the FRD, the buffer is increased again, also with a factor of one. There is, however, a 0.1 s latency phase, in which the buffer remains at the current level, before the increase is initiated. This latency phase is meant to reflect the adaptation phase of the eye and the mind to the new focusing distance and the driving scene. As soon as the driver looks away from the FRD again, the buffer is decreased again. Thus three glances of one second each would lead to a curve like the one in Figure 22.
0 s -1 s -2 s -3 s -4 s -5 s -6 s -7 s -8 s -9 s buf fer 0 s 2 s glance to FRD glance away from FRD glance to speedometer/mirror
time
Figure 22 Representation of the development of the attention budget for three conse-cutive one-second glances away from the field relevant for driving, marked red, with half-second glances back to the field relevant for driving in between. Between -1.8 s and 0 s a 1.8-s-glance to the mirror or speedometer is shown.
Starting from the left, which is ten seconds into the hypothetical driver’s past, the driver has a full attention buffer. About 8.75 s into the driver’s past he looks away from the FRD for one second, indicated by the red bar. The buffer is decreased with one second. When the driver looks at the FRD again, which is indicated by the white bar, a 0.1-la-tency-period passes before the buffer is increased. Then the driver looks away from the FRD again, and so on. At 5 s into the driver’s past the buffer is empty. When no inhi-bition is active, the driver receives an inattention warning. After having received the warning 0.4 seconds pass until the driver looks at the FRD again. His next glance away from the FRD is at either a mirror or the speedometer, indicated by the green bar. There-fore the buffer is not decreased immediately, but first after one second has passed. If eye tracking is not available, but head tracking is still possible, the algorithm is based on the “nose direction” of the driver. If the driver’s nose is directed at a point within 90° forward and higher up than 22.5° downward, the driver is assumed to be attentive. Also here the latency phase for buffer increase is 0.1 s and the increase factor is one.
If tracking is lost completely, the attention buffer change depends both on the buffer value and the head direction angle at the time when tracking is lost. If the buffer value lies below 0.4 s when tracking is lost the buffer is decreased further with a factor of one. If the buffer lies above that value it remains at its current value in case that the head direction angle when tracking was lost was within 20° of forward. If the head direction angle lies outside of this value the buffer is decreased with a factor of one.
For the present study it was decided to settle on the 15 zones named in Chapter 5.1. A subdivision of the vehicle world model into too small zones would not necessarily increase accuracy, because the eye tracking system is not that accurate especially in the zones that are far away from centre forward. No results with respect to eye tracking accuracy based on automatic gaze direction tracking were so far reported for studies of longer duration. For the present study a first evaluation of the eye tracking quality with respect to glance direction is reported in Kircher, Ahlstrom and Kircher (2009,
5.3 Distraction
warning
The distraction warning consisted of a vibration in the driver’s seat. Four actuators were integrated into the driver’s seat. Two were positioned in the frontal part under the driver’s legs, and two were placed in the rear half of the seat, slightly further to the sides. When the attention buffer reached zero and no inhibition was present, all four actuators started vibrating at the same time. The vibration could easily be felt both on asphalt and on gravel roads. The vibration stopped when the driver looked to the “field relevant for driving” again, or at the latest after two seconds.
Before settling on this solution, different other approaches for warning the driver were discussed. Visual signals were excluded, because a visually distracted driver might not notice a visual cue. Additionally, it was deemed to be important to only inform the driver, but not the passengers, about the occurrence of driver distraction. Therefore, auditory warnings were excluded, too. Both a vibrating seat and a vibrating seat belt were seen as viable alternatives. Especially due to the fact that a truck with the same instrumentation should be run in parallel, it was finally decided to opt for a vibrating seat, as truckers are known not to wear the seat belt as frequently as passenger car drivers do. A vibrating seat was considered to be able to reach practically all drivers, regardless of how distracted they were.
5.4
Drowsiness warning algorithm
The main contribution of Siemens/Continental VDO to the study was the provision of the drowsiness warning algorithm. This decision had been made before the project was started. During the planning phase of the project no other alternatives to this warning algorithm were discussed.
The drowsiness warning strategy uses the eyelid motion signal in order to provide an on-line diagnostic about the driver state.
This algorithm includes two main steps: o The blink detection and classification
o The diagnostic that’s provide de various warning levels. 5.4.1 Blink characteristic parameters
A typical spontaneous blink for an alert person presents 3 phases (see Figure 23). o a closing phase (the eyelid goes down)
o a closed phase (the eye is shut)
o an opening phase (the eyelid goes up).
Short Blink Long Blink 400 ms 200 ms Open Closed Opening Closed Closing Amplitude
The closing phase of a normal blink is shorter and faster than the opening phase; it takes about 60 ms with a maximum velocity of approximately 350 mm/sec. The opening phase takes about 120 ms with a maximum velocity of 150 mm/s. The maximum velocity and durations of eyelid closing and opening do not depend on the starting lid position. A typical blink duration of an alert driver is around 200 ms. Drowsy drivers exhibit long blinks (typically above 300 ms) while drivers getting sleepy can exhibit very long blink (typically above 600 ms).
The blink amplitude of an alert person, with eyes wide open, is characterised by a maximum value of 10 mm. The amplitude can be much lower for some eye morpho-logies or also during day driving conditions when the driver partly closes his/her eyes to reduce the light input.
5.4.2 Blink detection
The objective of the blink detection algorithm is to detect the blinks to measure their durations and of course to reject artefacts as looking at dashboard patterns.
The blink detection process looks for specific patterns within the given eyelid signals. The opening signal is processed first to determine an open eye reference (base line). A transition from the upper part of the base line to the lower part is then considered as a start of the closing phase of a potential blink. Finally various shape criteria are applied to decide if a potential blink is a blink. The following main criteria are applied:
Steepness of the closing and opening phase: Each phase must last at least 3 samples. Minimal blink duration: A blink is rejected if its duration is lower a given threshold (in ms).
Maximal blink duration: To take into account as much as possible very long eye closure the maximal duration is set to a max threshold.
A minimal and maximal Amplitude: of respectively 5 pixels and 20 pixels are considered.
Symmetry: The test of symmetry compares the opening values of the eyelids at the beginning, the end and for the minimum of the blink signal. The blink is rejected if the ratio of the higher edge of the blink and the lower edge is higher than a fixed threshold (typical value is 20%).
Figure 24 Results for the test of symmetry.
The drowsiness warning algorithm delivered a new classification of the drowsiness state of the driver every 30th second. Four different levels of driver state exist (see Table 2).
Table 2 Different levels of driver drowsiness as determined by the drowsiness warning algorithm.
level driver state
0 alert driver
1 slightly drowsy driver
2 drowsy driver
3 very drowsy driver
In order to reduce the likelihood for false alarms, which can occur for example when the driver is squinting due to sun glare, an “oscillation avoidance algorithm” was applied before sending a warning to the driver. This implies that in order to obtain a warning on a certain level above 0, this level or a level above needs to be delivered at least twice within five consecutive state classifications. As soon as a lower level was reported, the driver state classification was reset to this level, however.
5.5 Drowsiness
warning
The drowsiness warning was given in three stages related to the current drowsiness classification. On each classification level the driver had the possibility to press a confirmation button, acknowledging the warning (see Figure 25). This led to a delay for the next warning on the same level, in order to allow the driver to find a suitable loca-tion to rest. The drowsiness classificaloca-tion of the driver, the resulting warning, and the consequences when the driver presses the confirmation button are described in Table 3.
Table 3 The drowsiness classification of the driver, the resulting warning, and the rules for the repetition of the warning.
display sound repetition
level 0 (alert) level 1 (slightly
drowsy) “Trött?” “Drowsy?” discreet beep message disappears after 15 seconds and appears again after 30 min at the earliest if the same drowsiness level is present button pressed: message disappears immediately, and appears again after 30 min at the earliest if the same drowsiness level is present
level 2
(drowsy) “Du är trött” “You are drowsy”
discreet beep voice: “Du är för trött för att köra!” ”You are too tired to drive.”
beep and voice message repeated once per minute as long as same drowsiness level present
button pressed: text and voice message presented again after 5 min at the earliest if the same drowsiness level present level 3 (very
drowsy) “Du somnar snart” “You will fall asleep soon” loud beep voice: “Du är farligt trött! Stanna snarast!” ”You are dangerously tired. Stop soon!”
beep and voice message repeated once per minute as long as same drowsiness level present
button pressed: text and voice message presented again after 5 min at the earliest if the same drowsiness level present
A supplemental speaker was installed to output the audio warning messages. Ideally this would have been integrated into the vehicle audio system. The speaker used was a standard active computer speaker (mono operation) with direct input from the vehicle computer. It was mounted behind the rear seat line. The same safety consideration as for the camera for driver monitoring applied here.
The car had no built-in display, therefore a VFD/LCD-display was mounted in the cockpit. The display was connected via USB and was controlled by the Warning Control Program. ELFA had a suitable LCD or VFD display with 2*20 characters (Swedish Alphabet supported). The display was USB-controlled and measured 98 x 60mm. The display required some wiring, an enclosure and a mount.
It was decided to choose both visual and auditory warnings for the drowsiness system in order to include some redundancy, especially on the more severe drowsiness levels. It was also seen as an advantage if possible passengers realise that the driver is critically drowsy, because they might influence the driver to take a rest. Furthermore, it was decided not to use the same mode for the distraction and the drowsiness warning system, such that they could be completely separated from each other. Therefore, no haptic warnings were issued for the drowsiness detection system.
Figure 25 Participant presses confirmation button (photo: Tedd Soost).
5.6 Inhibitions
In order to avoid false alarms the warnings were inhibited under the conditions described in Table 4. This means that the warnings were registered in the logfiles as inhibited warnings, but they were not sent to the driver. Most inhibitions applied for both the distraction and the drowsiness warning system, some where specific for only one of the systems.
Table 4 Inhibition criteria for drowsiness and distraction warnings.
variable threshold motivation
speed < 50 km/h (inattention) Below 50 km/h gaze behaviour is not very uniform. The gaze is often outside the FRD without the driver’s being distracted.
< 5 km/h (drowsiness) Drowsiness warnings are inhibited below 5 km/h in case that the driver remains in the seat with engine on to take a nap – no drowsiness warning should be given in that case.
direction indicators on Changing lanes and turning can include planned glances outside the FRD.
gear reverse Reverse engaged means that the
driver should look over the shoulder. brake pedal pressure above 75 No warning should be given while
driver is braking, in order not to interfere with critical driving manoeuvres.
For the Saab the brake pressure is measured in 75-kPa-steps. Because vibrations can cause the sensor to show 75 without the brake being pressed, the threshold is set above 75.
steering wheel
angle > 20 for speeds 50-90 km/h > 10 for speeds > 90 km/h No warning should be given while the driver is engaged in substantial changes of direction, in order not to interfere with critical driving
manoeuvres.
StwAngle depending on speed. lateral acceleration > 5 m/s2 No warning should be given when
the vehicle makes strong
movements, in order not to interfere with critical driving manoeuvres.
5.7 Manual
Each driver received a user manual describing the distraction and drowsiness mitigation system after having completed the baseline phase. The manual was placed in the car for reference. The participants were informed about the existence of the manual, but they were not specifically instructed to read it. A copy can be found in Appendix 5.
5.8 Display
One of the four displays on the quad screen showed some statistics of the current trip. This information is an aggregation of the text log data and is mostly meant to help the
extensively during the development phase of the distraction detection algorithm, and during test runs when the data acquisition system was monitored for correct
performance. During the study phase the monitor that showed this display was disconnected and removed from the vehicle.
14:12:16,20
01:42:21,60
81.3 %
73.5 % 98.9 %
10 30 50 70 90 110 130 150Figure 26 Schematic picture of the data sector of the fourth field in the video logger.
The left hand side of the picture provides continuous information on some variables, and some additional information. The four boxes on the right hand side provide some histogram information, but also some continuous information. In Table 5 the informa-tion in the figure is explained.
Table 5 Explanation of the symbols and graphs in Figure 26. variable description
time of day The timer on the upper left hand side. duration of
trip The timer on the right hand side. direction
indicators The boxes in the upper corners of the left field, the left one is currently orange, i. e. “on”. Whenever a direction indicator is on, the corresponding field is illuminated.
This info provided because direction indicators are warning inhibitors. speed The thick black line on the left hand side documents speed over the last
10 s. The most recent value is on the right side of the diagram. The displayed speed range goes from 0 km/h to 150 km/h. The first reference line lies at 10 km/h, and then with 20 km/h difference upwards (“odd” numbers are used due to the Swedish speed limits, which most often lie at 30, 50, 70, 90 and 110 km/h).
drowsiness
algorithm The thin blue line just below the timers indicates the current drowsiness level, as presented to the participant. No colour means “alert” (level 1), light blue means “slightly drowsy” (level 2), middle blue means “drowsy” (level 3) and dark blue means “almost asleep” (level 4).
drowsiness
history The last six drowsiness levels are colour coded in the lower right hand corner of the graph (fourth quadrant); grey meaning alert, from light blue to dark blue increasing drowsiness, the confidence level is coded by either a red cross (0) or no red cross (1). Thus, the last 3 minutes of drowsiness estimation are visible, the most recent is furthest to the right. drowsiness
warning The blue line reaching down from the drowsiness algorithm indicator marks a drowsiness warning. Repeated warnings look similar. Colour coding similar to “drowsiness history” and “drowsiness algorithm”. For an inhibited warning the colour coding is grey.
drowsiness
warning count The histogram in the fourth quadrant on the right side of the display counts drowsiness warnings for each level separately. Repetitive warnings are counted, too. For the black parts of these boxes refer to “drowsiness acknowledge count”.
The percentage of time which the driver has been alert up to the current time is presented as clear text in the same quadrant. In the example presented here the driver has been alert 98.9% of the time on this trip. drowsiness
acknowledge The black line coming down from the drowsiness algorithm indicator marks the press of the drowsiness acknowledge button. drowsiness
acknowledge count
The black box within each drowsiness warning count bar in the drowsiness quadrant counts how often the drowsiness acknowledge button was pressed for each separate level.
data loss
Continuation of Table 5. inattention
algorithm The graph underneath the speed graph on the left hand side of the display shows continuously how the time budget developed over the last 10 s, the most recent value appears on the right side. The “height” of the value indicates the status of the time budget, the history allows to judge whether it is increasing, decreasing or stable. The range is from 0 s to 2 s.
The inattention algorithm result (y-value of the graph) is indicated no matter which data quality level is presently used (also for data loss situations).
glance quality The glance quality is colour coded in the attention algorithm display. As long as eye tracking is present, the graph is green, when only head tracking is present the graph is grey (data loss is black, see below under “data loss glance”).
data loss
glance The separate black bar in the inattention warning count quadrant indicates the percentage of data loss for glance direction for the current trip (the grey field indicates presence of head direction tracking, but loss of eye direction tracking).
inattention warning
The red bar going up from the inattention algorithm display indicates that an inattention warning has been issued to the driver (when the time budget reached 0 s). The width of the bar indicates how long the warning was “on”. Inhibited inattention warnings are colour coded grey.
inattention
warning count In the first quadrant (on the right side of the display) an inattention warning count is displayed. The grey count are inhibited warnings, the red count are issued warnings.
Inhibited warnings are counted when a warning would be issued, but the inhibition algorithm stops this warning from being presented to the driver (if the reason for the inhibition is not “baseline driving”; on the display both baseline and experimental phase are treated alike).
eyes off FRD The lowermost display on the left hand side displays glance direction. As soon as the driver’s glance is registered elsewhere than on the FRD this is colour coded. Data loss is indicated in black (or cf. data loss indication for inattention algorithm display). One colour coding (green) for fields that are outside FRD but driving related (mirrors, speedometer), another colour (red) for everything which is not driving critical (e.g. stereo, etc.). Side windows are treated like mirrors and speedometer in colour coding (corresponding to the treatment in the algorithm).
Continuation of Table 5. long glances
count The second quadrant on the right side of the display shows a “long glances count” histogram based on the glance direction (as used in the “eyes off FRD” field). Each glance above a certain duration is counted. The colour coding of the bars corresponds to the colour coding in the “eyes off FRD”-field furthest down in the left display.
The percentage of glances off FRD that are shorter than the critical values presented here as histogram bars is given in clear text in the same quadrant. The total percentage of glances away from the road per trip is not given on-line.
Borders for glance durations: .8 s; 1.2 s; 1.6 s; 2.0 s; 2.4 s; 2.8 s. One count for one crossing of a critical border (obviously only border crossings with increasing values). All border crossings are counted, i.e. a glance of 2.6 s will count in all bins underneath as well.
Long glances are not counted when the speed equals zero.
2 in 6 count The quadrant in the lower left hand corner of the right part of the display shows data related to the “accumulated 2 s off FRD” notion as suggested by VTTI. The counts are either “border crossings” on their way up or “spot counts” 6 s after a border crossing if the value is still or again above the critical level.
The percentage of glance-off-FRD time within 6 s intervals that lies underneath the lowest critical value indicated with histogram bars is presented in clear text in the same quadrant.
Borders 2 s, 3 s, 4 s, 5 s. Whenever one border is crossed it cannot be incremented again within the next 6 s. After 6 s the value is compared to the border again, and if it is (still or again) higher than the border in question, another increment is made and the increment inhibition time set to 6 s.
2 in 6 accum.
display The lower part of the field (the horizontal yellow bar) indicates which accumulated percentage of the past 6 s window (full length of the horizontal bar) the driver has looked away from the FRD. Black indicates the amount of data loss in the last 6 s. For getting an impression of how the glances are distributed across the last 6 s view the “eyes off FRD” field from “now” until the yellow line, which indicates “6 s ago”.