Barriers to and drivers for change - analysing causes for
improvement potential in the building supply system in Dar
es Salaam
Raine Isaksson - PhD, Senior Lecturer, Gotland University, raine.isaksson@hgo.se, 621 67 Visby, Sweden
Neil Taylor- BSc, Intec Services Pty Ltd, ntaylor@pipeline.com.au Jacob Hallencreutz -Tech Lic, Luleå University of Technology, jacob.hallencreutz@implement.se
Abstract
Business excellence needs constant reinvention with current challenges being such as how to integrate Learnability, Innovability and Sustainability. This paper looks at learning based on Innovation Action Research with focus on process innovation with the purpose of
highlighting sustainability challenges in business core processes. A system based process model in combination with sustainability indicators is used to describe a value network and the existing potential for improved sustainability. A qualitative method for specifying generic causes for the existing improvement potential is used to discuss barriers and drivers for change. Results indicate that quality methodologies can be used as a powerful support for sustainable development.
Key words
System analysis, cement, building materials, development in Africa, business excellence, process improvement
Paper type
Research paper
Introduction
The global challenges of satisfying the needs of this generation without ruining them for the coming generations are monumental. The challenge is to make best use of all resources, while still leaving them practically intact for coming generations. This requires improvements and innovations both for processes and products. In work for sustainable development it should be feasible to use TQM and there should be good synergies, (Isaksson, 2006). Methodologies and tools used for quality improvement should also be suitable for improving sustainability of processes and products. The process view can be applied on different levels starting from small sub-processes to processes covering entire organisations and supply chains, (Isaksson & al., 2010). Isaksson & Taylor (2006) propose in the Process Improvement Program the use of a system model and a set of chosen performance indicators to assess improvement potential in organisations with the assumption being that when opportunities can be clearly demonstrated they will act as drivers for change. The underlying assumption is that many processes, organisations and supply chains are not aware of their existing improvement potential. This view is based on the common statement that systems do not understand themselves. When in the picture you cannot see the full picture. Using the process view in combination with generic performance indicators is one way of highlighting improvement possibilities in systems with low process management maturity, (Isaksson, 2006), (Isaksson et al., 2008).
The construction and use of buildings plays an important role in the context of sustainable development. Buildings in many countries consume up to 40% of all energy used and are responsible for up to 40% of global man made CO2 emissions, WBCSD (2008). Estimates from major building companies put 80-90% of the building growth to the Third World. This indicates that from a sustainability perspective, more effective management of the building supply chain in Third World countries is of great importance for reducing carbon emissions.
Isaksson & Taylor (2009) report a substantial improvement potential in reduced costs, improved customer value and reduced carbon emissions in the building material supply chain in Dar es Salaam. The study uses the generic improvement process proposed in Isaksson (2006) and covers mainly the first two stages consisting of diagnosis of improvement potential and of the analysis of causes for the potential. The case study shows that even if reasonably simple solutions with good payback for realising both the commercial and environmental potential exist, change is slow. This means that root causes for the low rate of change need to be analysed in more detail. The results from the study could be seen as typical for many developing countries, particularly those in the Sub Saharan Africa. This makes it interesting to look in more detail at the analysis of causes and to what extent these causes could be generalised for the purpose of later finding generic actions for improvement. For qualitatively assessing causes for potential in a process or an organisation a checklist based on 9Ms can be used, (Garvare & Isaksson, 2005), (Isaksson et al., 2008).
This study aims at further developing the method for the qualitative analysis of causes for improvement potential, with particular focus at the supply network level but seen in a sustainability context. Another aim is to use the model for identifying typical barriers to and typical drivers for change in a Third World context. The previous diagnosis of improvement potential in the Dar es Salaam building supply network is also reviewed to further strengthen the methodology for diagnosis. Additionally the results are discussed in the context of sustainable development.
Methodology
The building material supply chain in Dar es Salaam is used as a typical example for Third World building activities. It is particularly relevant for the situation in poor countries in Sub Saharan Africa. The city of Dar es Salaam is growing quickly and is currently estimated to have some 4 million inhabitants. Figures are not reliable but the population has doubled or possibly even tripled during the last 20 years. Most likely the rate of growth will continue at least at the same pace. This makes sustainable building in the studied supply network highly relevant. The supply chain is analysed using a process based system model presented in Isaksson (2006) and Isaksson & Taylor (2006). The operative part of the model - improving processes - is described with the steps:
• Diagnosis of improvement potential
• Analysis of causes for the existing improvement potential
• Finding solutions
• Implementing solutions
• Fixing solutions into the organisation and evaluating improvement process Focus here is on the analysis step. In Isaksson & Taylor (2009) a diagnosis of the Dar es Salaam building material supply chain is presented together with a first analysis based on a 9M methodology, (Garvare & Isaksson, 2005). The different Ms represent typical causes for
the potential and include areas such as Management, Manpower, Measurement etc. (see Table III).
Here, the 9Ms are further reviewed based on Innovation Action Research (IAR), (Kaplan, 2008). A 10th M called Mission has been added during this work. The empirical data for the analysis has been collected mainly during a two week visit to Dar es Salaam in March 2010 although information from two visits in 2009 has also been used. Information has been mainly collected through interviews of stakeholders and participatory observation of the processes involved. The participatory observation includes active test work with block makers in co-operation with technical support from the cement manufacturer. Data compiled has been analysed using the system model and the 10M analysis. Based on the IAR methodology the models used have been further developed during this process. Concrete block production has been used to exemplify the main building supply network in Dar es Salaam because
approximately 60% of cement sales goes into block-making. Further, the one family single storey house has been studied. According to estimates from the cement manufacturer and their marketing director, half of the cement would be used for one family houses.
Theory Background
Managing SupportingResources – 10M
Drivers
Output
Outcome
Marketing
Producing
Improving processes and use of resources
Measuring performance
External resources
Input
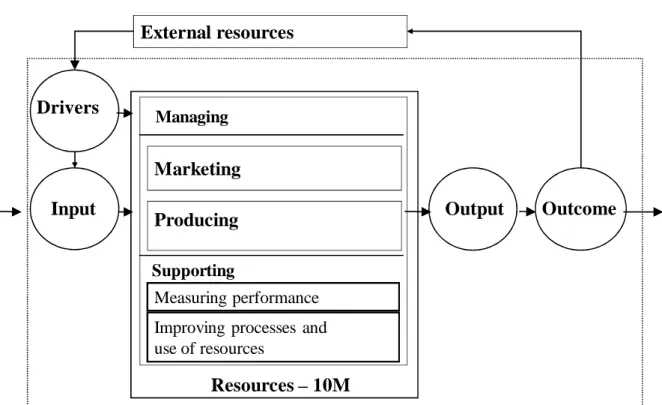
Figure 1. Process based system mode proposing some generic sub-processes. Adapted from Isaksson et al. (2008).The tenth M is defined as Mission.
The process based system model can be used to describe any organisation and it should also be possible to use it to describe a supply chain or a supply network, (Isaksson et al., 2008). In Figure 1 the system model is described with resources identified using the 10Ms.
The system model gives a snapshot in time of the studied system with the purpose of identifying all relevant elements. As a first step to identify possibilities the Output
performance can be compared to benchmarks. One challenge is to identify the most relevant Key Performance Indicators (KPI). The value per harm concept can be used to present the
Output from the system as living space per cost and as living space per carbon emissions, (WBCSD, 2000), (Isaksson & Steimle, 2009), (Isaksson et al. 2010). This is with focus on the customer and nature as two of the most important stakeholders in a sustainability context.
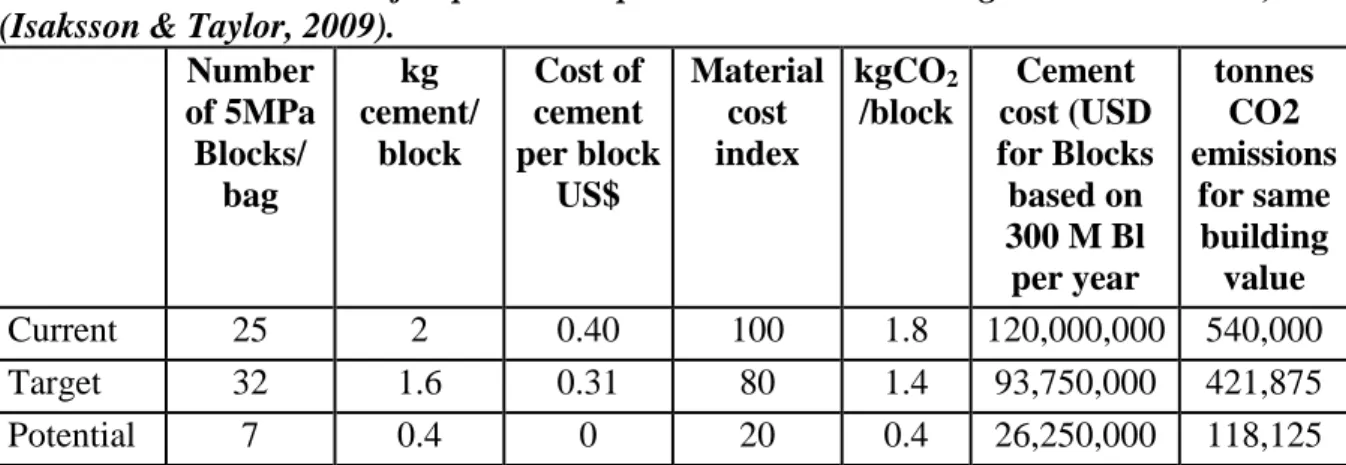
The value per harm concept can also be used for the sub-processes. For cement manufacturing the KPIs would be strength x tonnes per price and strength x tonnes per carbon emissions, (Isaksson, 2007). For the block makers the KPIs could be number of blocks of a defined quality (5MPa) produced per bag of cement and number of blocks per tonne of carbon emissions. The customer value really is the block quality per price, but this correlates quite well with how many blocks can be produced. Cement use is the cost driver for blocks. Therefore it is easier to use the number of blocks per cement bag as a simple KPI. In Table 1 the average assessed improvement potential for block makers in Dar es Salaam is presented. Results show that with an increase of 30% more blocks of the same quality from a bag of cement the costs for the producers could be reduced by almost 30 MUS$ per year and the carbon emissions could be reduced yearly by more than 100 000 tonnes. Alternatively 30% more blocks could be produced for the same carbon emissions. This presents a clear synergy for improvements in the core process and simultaneous reduction of environmental harm.
Table I. First assessment of improvement potential in block making in Dar es Salaam, (Isaksson & Taylor, 2009).
Number of 5MPa Blocks/ bag kg cement/ block Cost of cement per block US$ Material cost index kgCO2 /block Cement cost (USD for Blocks based on 300 M Bl per year tonnes CO2 emissions for same building value Current 25 2 0.40 100 1.8 120,000,000 540,000 Target 32 1.6 0.31 80 1.4 93,750,000 421,875 Potential 7 0.4 0 20 0.4 26,250,000 118,125
The effect seen from the customer perspective is even greater if possible improvements in the cement quality are also considered. The main cause is strength variations that today are not being perceived because the block making processes are even more variable.
Table II. Quality and environmental potential in the Dar es Salaam supply chain from cement raw materials to concrete blocks for producing the current 300 million blocks per year, (Isaksson et al., 2010).
Cement use Cement-
cost M US$ CO2 – emissions Tonnes/year Comments
Actual 600 000 120 540 000 Assuming current quality
and price of cement
Benchmark 340 000 68 300 000 Improved quality of cement and blocks with current price
Potential -240 000 52 200 000 Cement production would
probably not be reduced if prices were lowered
If cement quality could be produced consistently to a world benchmark level then this could further increase the number of blocks per bag. In Table II an assessment of the combined potential for cement and block improvement is presented. Table I and II present a first diagnosis based of the potential measured as Output. The diagnosis for potential forms the first step of “improving processes” of a generic improvement process indicated in Figure I as a support process. The system model can be applied at different levels with a box in box principle, which means that the improvement process can also be described using the same model, see Figure 2.
With an indication of a substantial improvement potential based on the first diagnosis it is worthwhile to continue with the work consisting of an analysis.
Management
Processes Leading change Perceived
need for improvement
Improved processes
Support Processes Applying methodologies and tools (using internal resources) Operative Processes
Establishing a sense of urgency Creating the Developing goals and strategies guiding coalition
Interest in improve-ment
Creating interest for change
Improving processes Fixing Improvements and assessing Implementing solutions Finding solutions Analysing root causes Diagnosing the potential for improvement Improving performance Resources
Management – Competence for leading change Manpower – Competence of consultants
Method– Methodologies and tools for TQM-SD improvement including process templates Measurement – Measurement systems for change
Machine – IT and computer power Milieu – Working environment for improvement group
Material – Maturity of process to be improved including personnel to be involved Means – Money and time available for improvement
Market – Customer interest and expectations
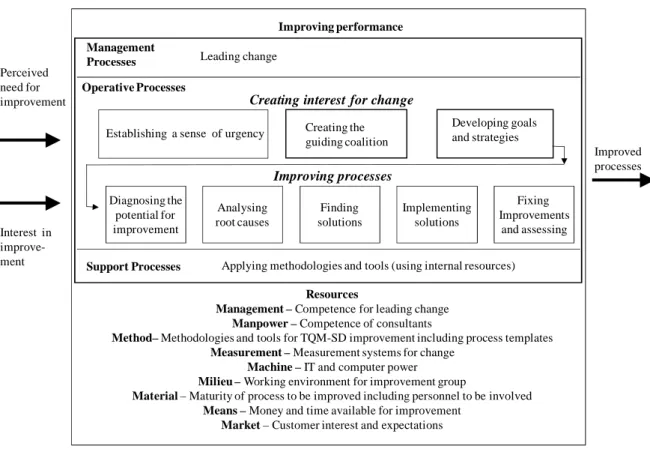
Figure 2. Generic improvement process consisting of two main parts, creating interest for change and improving processes, adapted from Isaksson (2006).
The improvement potential as such should also serve in creating a sense of urgency for change, as identified as the first prerequisite for change in Figure 2. Results to date have been presented to the main cement producer and one block maker in the region as well as to
contacts within the Dar es Salaam University. The purpose has been to attract more interest for further research. There has been no direct feedback to the assessed potential, but attitudes towards further work have so far have been positive among local stakeholders. The work has also been used as input for research applications to the Swedish International Development Aid (SIDA), but has so far not attracted any interest. Based on these experiences it seems that establishing a sense of urgency for change might require much more than coming up with possibilities for saving money and the environment.
In the improvement process the diagnosis is followed by an analysis of causes to the existing potential. In Table III results from the previous assessment are presented. The 9Ms in Table
III describe the resources within the defined system. Additionally the system model in Figure 1 identifies external resources. These could be such as the general country infrastructure, support for development, level of corruption, level of educational level etc.
From a model point of view the external resources have not been described in any detail. It could be possible to use a similar set of Ms for the external resources as has been used for the internal resources. The Ms presented are only superficially defined, which could lead to a risk of overlapping between them. The Ms have an origin in the 7Ms, which is a version of the Fishbone diagram, (Bergman & Klefsjö, 2003). There is no formal validation of the Ms actually representing all critical elements in a studied system. The original intended use for the Ms was to act as criteria in a simplified Business Excellence Model with additions for Ms like Machine, that make the assessment more related to the system studied, (Garvare &
Isaksson, 2005). With a preliminary review of the Ms it should be possible to assign priorities and then focus on work with the chosen Ms. This analysis can be improved by not only
looking at the level of performance but also assessing the criticality of the M. Additionally it should be possible also to add the complexity of change needed. The resulting method could be seen as a help to identify the easy wins or “low hanging fruit”. When Ms that could be worked with have been identified, the next step is Finding Solutions, see Figure 2.
Table III. Preliminary analysis of the causes for improvement potential in block making supply chain in Dar es Salaam, (Isaksson & Taylor, 2009).
M – parameter
Criteria & comments
Management Policies, goals and strategies for improving supply chain performance and block manufacturing - these do not seem to exist. The assessed
improvement potential is not apparent to management.
Method The supply chain is not managed as an entity. The actual method for block making does not follow best practises.
Manpower Basic competency for block making exists, but the methods followed are not best practise.
Measurement Maturity of measurement system and communication of performance results is low or non-existent. There is very little objective measurement of block making quality performance.
Machine Adequacy of equipment and premises for the intended use - Many of the mixers seen were far from ideal. Lack of understanding of best practise production could result in negligence of equipment.
Material Methods for controlling incoming material. This is a problem mainly for the sand but also for the aggregates (mostly limestone) were content of humus, clay and humidity varies. Lack of specifications and control. Milieu Level of physical and social working environment. Hard working
conditions. Potentially unsafe working conditions and practises. Market Customer base, competition and general development. Market is
increasing for blocks and for professional block makers.
Means Availability of funds for operations and investments. With good sales there should be financial means for development. Two of the five block makers were investing in new equipment and one was extending business into ready mixed concrete production.
As already indicated in Figure 1 a tenth M called Mission has been added and was at use at the start of the current work. The argument for using this is that without a purpose or clear
meaning for all of the stakeholders it will be difficult to advance as a system. This would indicate that a clear mission shared by key stakeholders would be an enabler and resource for developing the system.
10 M Analysis of causes for potential
The analysis of the 10 system internal resources is based on a qualitative analysis of all data gathered during 2009-2010 visits. Each M is shortly described. The template M has been adapted to the system studied. The resource is discussed at the supply network system level and to some extent at the level of some of the key stakeholders like the cement and block producers.
Market – main stakeholders and stakeholder requirements
The most important stakeholders in the building supply network are the individual house builders followed by other customers, the shareholders, competition, management, employees and society. Market is increasing for blocks and professional block makers and also towards larger scale production. Building needs are growing. Dar is estimated to have 4 million inhabitants and is growing fast. Half of the houses built are single family houses built with blocks. Cement competition is limited and although there is some importing the cement prices are relatively high at some 180-200 US$/tonne. World benchmark price in a well functioning market would be expected to be about 80 US$/tonne. The expected increase in market
opportunities could be a driver for change.
Mission – Building network purpose, choice of product and targets There is no overall purpose of the building network. The purposes of the individual
organisations are short-sighted and based on making money. The largest player, the cement manufacturer has been through turbulent times with the threat of being sold and has had major changes in management. The company forms part of a multinational group and relies on policies and directives issued under distance control. The official focus of authorities has not been studied but during visits to Dar es Salaam University and in interviews with people working within the supply network, nothing has surfaced to indicate that there would be any particular priority in improving the supply network. With no clear mission or purpose among the different stakeholders the risk of sub-optimisation is high. The chosen targets for cement strength, concrete blocks strength and house structural requirements are based on historical practises, which might not be relevant for current needs. In the short term the cement
manufacturer seems to be the only stakeholder with the competence and resources that could have the required credibility to gather key stakeholders for a discussion of the mission. This, however, requires that there is an interest from company head office, which could be seen as an external resource for the system. At the local level defining the mission would involve a definition of product specifications. These should be designed based on the customer and the general supply network capabilities and needs. The current product specification is more or less of historical origin and relating to the standards used. Block makers would need to define block performance better to suit the different customer categories and especially the builders of single storey family houses. This would require understanding of structural strengths needed and suitable solutions for concrete blocks. A particular problem here is that the customer specifies a solid block whereas a hollow block would be both better for insulation and cheaper. Going from solid blocks to hollow blocks could possibly save another 30% of cement use on top of the earlier mentioned improvements. This means that walls for single storey family houses could possibly be produced with only about 40-50 % of the cement currently used. This would require co-operation with vocational training institutes and authorities responsible for building design. With business as usual, the building activity will continue in its current resource wasting form. With an increase in living standards more
people will start using air conditioning in the poorly insulated houses. Energy generation is already a problem and blackouts are common. By defining a supply network with a mission of providing cheap and energy efficient housing, the future increase in energy consumption related to the system could be more than halved.
Management – Vision, strategies and objectives for carrying out the mission As there is no mission at the level of the supply network there are no common policies, strategies or objectives. The cement manufacturer has strategies set by the owner. Based on observations made this appears to be a strategy with rather short focus looking at monthly, quarterly and yearly results, using the profit as main KPI. The prevailing mental model would still be that the market will buy the product if it can be produced, indicating little focus on customer needs and more focus on tonnes produced. The marketing director of the main cement producer has clearly espoused the view that when the block makers do well, the cement plant does well. His opinion is that it is important to support block makers in the work to increase the number of blocks from a bag. However, there are still many others whose first reflex is that if block makers use less cement per block they will buy less cement. The
strategy for support to customers still needs to be clarified and improved. Block makers are there to make money and some of the larger ones also appear to be there to boost the status of the owner. Among the block makers there seems to be an interest for improvement and an acknowledgment that help is needed. The cement plant has already organised popular seminars for block makers where the basics of making blocks have been presented. Means - Availability of funds for operations and investments
The availability of funds forms an important resource to support operations. Generally money is tight in the supply network. Development aid does not seem to be going to this sector. The international organisation to which the main cement producer belongs has been in a cost saving mode during the last two years. Two of the five block makers were investing in new equipment and one was extending business into ready mixed concrete production. With a good market there seems to be money for investments. The banking structure is still weak and it is not easy for entrepreneurs to get loans.
Method – Organisation of the mission
The supply chain is not managed as an entity. There is little system and process
understanding. The traditional company based functional organisation is the dominating one. Cement manufacturing processes have not been optimised with the result being variable quality and increased costs all translating to Cost of Poor Quality and Sustainability, see Isaksson (2005) on the link between CPQ and sustainability. The management mode has changed towards more delegation with a flatter organisation. Still, the organisation has its fair share of distance support and intervention, which seems to be a mixed blessing. The actual method for block making does not generally follow best practises. There is no proper standardisation of product performance and there is no block makers association to agree upon any common requirements. The present building rules and regulations do not seem to be optimal for building one family houses. Official requirements seem to ask for high safety margins leading to a widespread disregard of rules, which in its turn could mean that unsafe houses are built. The housing quality variability is probably quite extreme.
Manpower – Competence compared to requirements
There is little managerial competence related to the supply network levels. Cement plant personnel generally have a reasonable level of competence at all levels. This is a result of more than 40 years of cement production. Basic competency for block making exists, but the methods followed are not best practise. Vocational training institutes do not seem to have up to date equipment for proper training. University education within the field exists. The
existing competence is to some extent insular with good knowledge in some fields but lack of understanding of the bigger picture.
Measurement – How is mission performance measured and controlled? Maturity of measurement system and communication of performance results is low or non-existing at the level of the supply network. Cement manufacturing is generally well
monitored, but the measurement system does not explicitly measure customer value. Also, the value per harm measurements are missing. There is very little measurement of block making quality performance.
Machine - Adequacy of equipment and premises for the intended use
Investments in new cement production capacity have been carried out. This has improved quality and energy efficiency. For block making many companies are investing in new equipment. Still, many of the mixers seen have been far from ideal. Lack of understanding of best practise production could result in negligence of equipment. Technological development is driven by small entrepreneurs buying equipment mostly from China – old but robust technology. There is no identified technical support
Material – How is input managed?
At the supply network level there are some problems with available materials, such as good quality sand for block making. At the cement plant level there are some problems with raw materials like gypsum and an iron additive. The main raw material, limestone, is present in large quantities. To assure supply for increased capacity, reserves should be reassessed, which is in process. There are no actual methods for controlling incoming material for block making. This is a problem mainly for the sand but also for the aggregates (mostly limestone) were content of humus, clay and humidity varies. Generally there is a lack of specifications. Sand could possibly be substituted by other materials. But since there seems to be little product development in the field, change is slow.
Milieu - Level of physical and social working environment
Generally the supply network is characterised by hard working conditions. Many employees in cement manufacturing and block making are casuals, with limited rights. There are many hazardous and unsafe working practises.
Summary of 10 MS – importance, performance and complexity
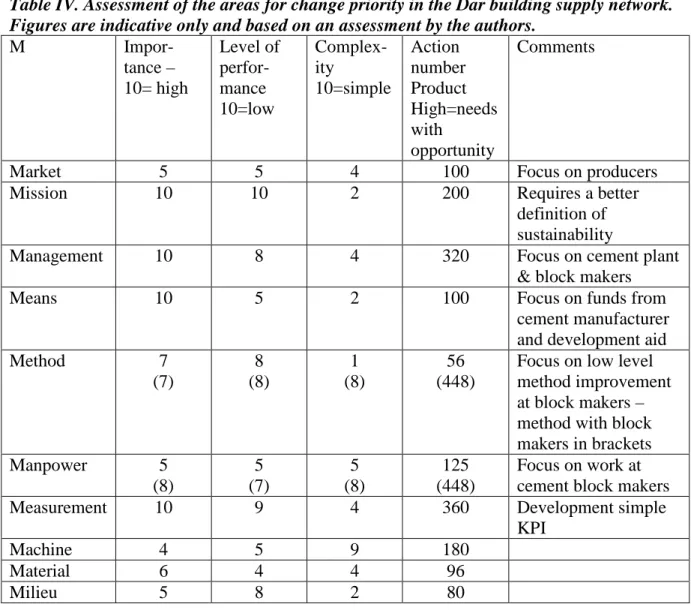
An assessment of the supply network need for change importance, current performance and complexity of change is carried out, see Table IV. The importance is assessed from 1 to 10 with 1 being the lowest level of importance and 10 the highest. The level of performance is assessed with 1 being a high level of performance and 10 a low level. The product of these two parameters indicates the needed urgency for change. The higher the product is the higher the need. The complexity of carrying out change ranges from 1 corresponding to a high level of complexity and 10 to a simple change. The higher the product of the three indicators – the action number – the higher the priority. If the needed urgency is high in a complex system, this could be taken as a sign of barriers.
The complexity of change at the level of the supply network makes it a better strategy to start with bottom up improvement focusing on stakeholders where there is a clear interest. With block makers quick improvements could be produced creating more drivers for change. These results could be used to convince other block makers and possibly also cement plant
management of the importance of change. In parallel the measurement system should be developed with the purpose of more clearly demonstrating opportunities for change.
Table IV. Assessment of the areas for change priority in the Dar building supply network. Figures are indicative only and based on an assessment by the authors.
M Impor-tance – 10= high Level of perfor-mance 10=low Complex-ity 10=simple Action number Product High=needs with opportunity Comments
Market 5 5 4 100 Focus on producers
Mission 10 10 2 200 Requires a better
definition of sustainability
Management 10 8 4 320 Focus on cement plant
& block makers
Means 10 5 2 100 Focus on funds from
cement manufacturer and development aid
Method 7 (7) 8 (8) 1 (8) 56 (448)
Focus on low level method improvement at block makers – method with block makers in brackets Manpower 5 (8) 5 (7) 5 (8) 125 (448) Focus on work at cement block makers
Measurement 10 9 4 360 Development simple
KPI
Machine 4 5 9 180
Material 6 4 4 96
Milieu 5 8 2 80
Barriers to and drivers for change
Barriers and drivers could in many cased be viewed as being on the same continuum. As an example management commitment could be a driver and lack of management commitment a barrier. On the other hand barriers and drivers could be seen as opposing forces as in a force field analysis. The results from Table IV can be used to identify barriers and drivers. A high number for the product of Importance and Performance indicates a need. If the complexity to improve Performance is high (low figure), then there is a barrier. On the other hand when the action number is high there are needs coupled with opportunity, which means that
development in these areas could become drivers. Below is a discussion based on an interpretation of Table IV results.
Mission not defined
The high importance results from the analysis in Table IV indicate that understanding the building supply network mission is the greatest barrier (100). The reason of this could be a general lack of system understanding by all stakeholders. Apart from problems with understanding how systems work there could also be a problem in understanding what sustainable development is. Isaksson & Steimle (2009) claim that sustainability reports based on the Global Reporting Initiative (GRI) guidelines do not present a clear picture of how sustainable the reporting organisation is. The Cement Sustainability Initiative of the World Business Council for Sustainable Development (WBCSD) promotes the GRI guidelines. All
leading global cement companies follow these recommendations. One problem with the GRI guidelines is that they do not clearly define what sustainability is, but only present a number of indicators to be monitored. The WBCSD works with the Eco Efficiency defined as value per harm. However, the value is not the stakeholder value but only the sales or the shareholder value. The core process is excluded from the assessment. This means that producing tobacco or land mines can be reported as a sustainable activity. This also means that low quality cement could be sold at a high price and still be reported as sustainable. The missing link is that costs of poor quality are not part of the GRI sustainability reporting, (Isaksson, 2005). When costs of poor quality are forwarded to customers by increasing the price, this is recorded as increased economic sustainability. It could be that the main barrier for increased sustainability is that sustainability has not been properly defined. Here a comparison with quality could be done. Quality could be defined as doing the right thing (perfect product) in the right way (perfect process). This would present quality as the ratio of customer value per price. A perfect process gives the lowest cost and enables the lowest price with retained profit. Sustainability could be defined as maximising stakeholder value per harm, (Isaksson &
Steimle, 2009). Both value and harm would be defined for the system. Examples of harm are product price and carbon emissions.
Measurement system missing
The level of improvement potential most likely has an inverse correlation with the measurement system maturity, (Isaksson & Hallencreutz, 2008). Without proper
measurements decisions are not based on facts so performance is more likely to be negatively affected by sub-optimal solutions Provided agreed measurements on sustainability are made, for example based on value per harm, it would be possible to provide facts and data to
identify existing opportunities. These facts could then act as drivers for creating management interest. With agreed measurements it should be possible to raise the interest among aid organisations to provide funding for development.
Management – nobody owns the problem
The supply network has not been defined and there is no obvious stakeholder with the overall responsibility. Assuming that the indicated potential is correct and that currently little is done to realise the potential, who should act differently? Formally the responsibility lies with the local and national authorities to manage the development of the city. Who is responsible for sustainable development? We have national commitments to different UN declarations and we have corporate commitments with ethical codes and adherence to Global Compact. Individuals are indirectly having commitments both as citizens and as employees. How about the research society? If sustainable development is the challenge of our age but we focus on other things, how ethical is this? Companies, aid organisations and authorities would need a better definition of what sustainable development is. In order to manage change we need to understand the problem, define it, measure it, communicate and lead change, (Isaksson & Hallencreutz, 2008). The core problem could be outside of the studied system in the external resources that do not provide clarity in how sustainability should be viewed, see Figure 1. We can only speculate, but there may be considerable vested interests in not relating sustainability and the core process. With focus on more peripheral things like welfare contributions and plant beautification many companies can continue the business as usual with a minimal effort of greenwashing.
Bottom up improvement with method development as driver
Drivers for change at the level of the supply network are weak. Looking at the different stakeholders, cement manufacturing and block making could form areas where improved methods could demonstrate synergies between economic, social and environmental
improvement by making better use of resources. However, for cement manufacturing the main resource is an external one in the form of head office policies. Without clear indications from head office the local plants have limited possibilities to focus on sustainability. Still, within the actual frame, some development is feasible. The cement plant is the most powerful stakeholder and with some commitment from key persons there could be a measurable effect especially in the co-operation with block makers. The block makers are small entrepreneurs with limited resources, but among them there are those that have an interest in improving performance. If good examples can be created at this level and these can be communicated more widely then improved block maker performance could be a driver for change.
Manpower education as a driver
With solid examples that prove the validity of the value per harm concept there should be material for educating different stakeholders. This education could be both vocational training of operators and competence development of specialists and managers. Here, stakeholders could be employees and management from cement plants and block makers but also official aid organisations and nongovernmental organisations.
Conclusions
The 10M checklist seems to give good basis for identifying barriers and drivers for the identified improvement potential in the Dar es Salaam building material supply network. Barriers identified are lack of Mission, Measurement and Management. Possible drivers are the creation of an agreed measurement system and focusing on performance improvement of cement manufacturers and block makers, especially through increased education.
The discussed causes explain to some extent why development is reasonably slow in spite of obvious improvement possibilities. The main barrier is related to external resources where the research community has not been able to provide agreed operational definitions of what sustainable development and sustainability really are. Without agreed definitions none of the stakeholders have any clear responsibility or mission. Or, in other words, business as usual becomes an acceptable alternative. Drivers for sustainable change could be created provided an agreement of how sustainability is measured. A proposed indicator for the studied system is based on the value per harm concept. Indicators for the system could be such as living space per price and living space per carbon emissions. A more thorough review of the system presenting current performance compared to best performance would most likely confirm the current indications of an important improvement potential. If this can be presented in terms of an agreed way of performance measurements then this could be a powerful driver for
companies, authorities and aid organisations. The main barrier here could be the generally used GRI guidelines that do not require measurement of customer value and therefore cannot be used for measuring stakeholder value compared to stakeholder harm.
Discussion
The 10M analysis carried out on the building supply network in Dar es Salaam is only indicative and would need more data gathering to present a full picture. The assessment done in Table IV is based on the authors’ interpretation of available data. The presentation is mainly to be seen as an example. The validity of the method could be improved by specifying the M criteria more clearly and then carrying out a consensus discussion with stakeholders. However, many of the observations are obvious from a brief review; like that there is no effective overall sustainability management or measurement of the system.
Some of the results could be generalised. The lack of an agreed operational definition for sustainable development is a general and global problem. Since the definition could be seen to create the foundation for a system mission and system management it could be expected that building material supply chains globally are not managed as a system for improving
sustainability and that the responsibility that global building material companies should take, is not taken. From a perspective of business ethics it could be argued that a company that can create more stakeholder value for less harm, should do it, (Isaksson et al., 2010).
The 10Ms have not been tested at the level of external resources described in Figure 1. However, in the analysis of the studied system with 10Ms, it can be seen that the same resources seem to be relevant at a higher system level. Similarly the 10Ms can be used to describe a system at a lower level like the system of block making. At this level many of the network resources can be seen as external resources from the perspective of the block makers. This indicates that the 10Ms could also be used to categorise external resources in the system model.
Business Excellence could be seen as good management of all stakeholder needs, (Garvare & Isaksson, 2001). Process management and other methodologies and tools from Quality Management should also be effective in improving sustainability performance. This suggests that quality professionals both could and should participate in doing work that increases our understanding of how sustainability could be improved – more focus on learnability and innovability for increased sustainability.
References
Bergman, B. & Klefsjö, B. (2003), Quality from Customer Needs to Customer Satisfaction. Second Edition. Studentlitteratur, Lund.
Garvare, R & Isaksson, R. (2001). Sustainable Development: Extending the Scope of Business Excellence Models. Measuring Business Excellence, 5(3), 11-15.
Garvare, R & Isaksson, R. (2005). Organisational Sustainability Management through Minimised Business Excellence Models, Proceedings of the Third International Working
Conference -TQM –Advanced and Intelligent Approaches, June 1-3, Belgrade, Serbia.
Kaplan R. S. (1998). Innovation Action Research: Creating New Management Theory and Practice. Journal of Management Accounting Research, 10(March), 89-118.
Isaksson, R. (2005). Economic sustainability and the Cost of Poor Quality. Corporate Social
Responsibility & Environmental Management, 12, 197-205.
Isaksson, R. (2006). Total Quality Management for Sustainable Development – process based system models. Business Process Management Journal, Vol. 12, 5, 632-645.
Isaksson (2007). Product quality and sustainability in the cement industry – Proceedings of
the 12th International Conference on Cement Chemistry, Montreal, Canada, July 8-13.
Isaksson, R. & Hallencreutz, J. (2008). The Measurement System Resource as Support for Sustainable Change. The International Journal of Knowledge, Culture & Change
Management, Vol 8, 1, 265-274.
Isaksson, R. & Hallencreutz, J. & Garvare, R. (2008). Process Management and System-Thinking for Sustainable Development. The Theories and Practices of Organizational
Excellence: New Perspectives. Chapter 8, 205-232. (Ed. K.J. Foley et al.), Consensus
Books, Sydney.
Isaksson, R. & Johansson, P. & Fischer, K. (2010). Detecting Supply Chain Innovation Potential for Sustainable Development. Accepted for Journal of Business Ethics.
Isaksson, R & Taylor, N. (2006). The Process Improvement Program. Proceedings of the 9th
International Conference on Quality Management and Organisational Development,
9th-11th August 2006, Liverpool.
Isaksson, R. & Taylor, N. (2009). Drivers for sustainability–Making better use of cement in Dar es Salaam. Proceedings of the International Conference- quality and service sciences, 12th QMOD and Toulon-Verona Conference, August 27-29, Verona.
WBCSD (2000). Eco-Efficiency, creating more value with less impact. www.wbcsd.org. WBCSD (2008). Energy Efficiency in Buildings – business realities and opportunities.