THESIS
THE 2006 WARM FIRE: EFFECTS ON HABITAT AND PREY SPECIES OF THE NORTHERN GOSHAWK
Submitted by Jeffrey S. Lambert
Department of Forest and Rangeland Stewardship
In partial fulfillment of the requirements For the Degree of Master of Science
Colorado State University Fort Collins, Colorado
Spring 2015
Master’s Committee:
Advisor: Dan Binkley Richard Reynolds Julie Savidge
Copyright by Jeffrey Scott Lambert 2015 All Rights Reserved
ABSTRACT
THE 2006 WARM FIRE: EFFECTS ON HABITAT AND PREY SPECIES OF THE NORTHERN GOSHAWK
Reductions in the frequency of fire in Southwestern ponderosa pine and mixed-conifer forests since initiation of forest management early in 20th century changed the composition and structure of the forest habitats of the northern goshawks (Accipiter gentilis), a food-limited species of conservation concern, and the birds and mammals it feeds on. A conservation strategy for the species in the goshawk’s food web in these forest types recommends restoring the mix of predator and prey habitats that
historically characterized these forests—characteristics that were sustained by frequent low-severity surface fire. Thus, the effects of fire severities (high- and low-severity) and lack of fire on today’s habitats may influence the abundances of bird and mammal goshawk prey. . The 2006 Warm Fire burned 235 km2 of ponderosa pine and mixed-conifer forest on the North Kaibab Ranger District in northern Arizona in late June and early July 2006. Forest habitat metrics such as live tree and snag densities, cone production, canopy and ground cover estimates were collected from 2007-2010 on 60 0.5km transects to compare the effects of high- and low-severity fire and no fire on a suite of 13 important prey species of the goshawk. I describe habitat changes resulting from the different fire severities in ponderosa pine and mixed conifer forests. I estimated abundances for 13 bird and mammal prey species in forests burned by different fire severities and tested predictive models designed to gain an understanding which habitat characteristics, affected by fire, best predicted individual bird and mammal abundances. Red squirrels and golden-mantled ground squirrels showed the most sensitivity to fire, while chipmunks were evenly distributed across fire severities. Hairy woodpeckers and northern flickers, in contrast, benefitted from high-severity fire, due to increased snags, cavity nesting opportunities, and foraging. American robins and Steller’s jays were also evenly distributed across fire severities. High-severity fire had a significant impact on forest ecosystems. Changes in forest structure were found to be detrimental to
some species while creating short- and possibly intermediate-term benefits for others. Lowering the risk of high-severity fire by restoring composition and structure should also protect the habitats of goshawk and the prey species most sensitive to fire. The effects of low-severity fire were mixed, suggesting that it may be possible to return fire to ecosystem without a significant impact to many birds and mammals in the short term. Frequent low-severity fire could also help to maintain sub-canopy and understory grass / shrub openings by removing excess growth and ground debris.
ACKNOWLEDGEMENTS
I first extend my appreciation to my advisor, Dr. Dan Binkley of the Department of Ecosystem Science and Sustainability and my Forest Service supervisor, Dr. Richard Reynolds of the Rocky Mountain Research Station. Richard encouraged me to pursue this research opportunity, and has supported me throughout my program as an employer, mentor, and friend. Dan provided me with an opportunity to formalize this research and I would like to thank him for his encouragement, professional advice, life lessons, and the significant amount of time he invested in my academic development. I would also like to thank Dr. Julie Savidge of the Department of Fish, Wildlife, and Conservation Biology for her academic guidance and for serving on my graduate committee. I owe much to Richard, Dan, and Julie for their support during my program. I would also like to thank Dr. Scott Baggett and Ben Bird for their statistical consolations and advice throughout this project.
This study would not have been possible without the support of many field technicians who assisted me with data collection and logistics on the Kaibab Plateau. In particular I would like to thank Wyatt Nimitz (2007) and Carrie Lambert (2008-2010) for waking up early many mornings and assisting me with bird and mammal surveys. I would also like to thank Alison Cofer, Heather Danaceau, Mary Francis, Tara Hatfield, Jean Lawrence, Katie Parmentier, Mike Price, John Seyfried, Leath Tonino, and Tim Webber for their support throughout this study. I appreciate all of their hard work and enthusiasm over the years.
I express my deepest gratitude to my family and friends for their encouragement and support. I am especially grateful to my wife Carrie for her love and encouragement. Carrie also provided me with invaluable assistance collecting data throughout the study. I am also thankful for my son Riley who provided me with the proper perspective about what is important in life.
This project was funded and supported by Region 3 of the U.S. Forest Service, the Rocky Mountain Research Station, and the Joint Fire Science Program. Housing and logistics during the field season were provided by the North Kaibab Ranger District. I thank you all.
TABLE OF CONTENTS ABSTRACT……….…....………...ii ACKNOWLEDGEMENTS………...iv LIST OF TABLES……….………...vii LIST OF FIGURES……….………..….……viii INTRODUCTION……….……….………..………….1 METHODS………..………...6 STUDY AREA...………..………...6 SAMPLING DESIGN………..……….……..…...7 VEGETATION SAMPLING………..………...9 PREY SAMPLING………..……….……10 DATA ANALYSIS………..……….11 RESULTS………...……….…..…...14
TREE AND SNAG DENSITY AND CANOPY COVER...…...14
GROUND COVER……….……….………...15
SAPLINGS COUNTS……....………...…………...………...16
CONE PRODUCTIVITY……….………..………..…..…….…...16
BIRD AND MAMMAL ABUNDANCE ………..………...……..17
PREDICTIVE MODELS...……….…17
CONCLUSIONS………..……….……...………25
REFERENCES……….…43
LIST OF TABLES
TABLE 1-TRANSECT CLASSIFICATION BY FOREST TYPE AND FIRE SEVERITY.………28 TABLE 2-PRE- AND POST-FIRE TRANSECT CLASSIFICATION……….……..…...29 TABLE 3-PREY SPECIES ABUNDANCE RELATED TO HABITAT AND FIRE SEVERITY…..30-33 TABLE 4-TRANSECT METRICS BY FOREST TYPE AND FIRE SEVERITY………...….…34 TABLE 5-SPECIES COUNT DATA……….….35 APPENDIX A……….50-51 APPENDIX B……….52-55 APPENDIX C………..56 APPENDIX D………. 57
LIST OF FIGURES
FIGURE 1-KAIBAB PLATEAU STUDY AREA………...….……..36
FIGURE 2.1-TOTAL TREE DENSITY………..37
FIGURE 2.2-TREE DENSITY >20CM DBH (LARGE)………...….37
FIGURE 3-CANOPY COVER………38
FIGURE 4.1-TOTAL SNAG DENSITY……….39
FIGURE 4.2-SNAG DENSITY >20CM DBH (LARGE)………...…39
FIGURE 5.1-OCCULAR ESTIMATES OF MIXED-CONIFER GROUND COVER………..…40
FIGURE 5.2-OCCULAR ESTIMATES OF PONDEROSA PINE GROUND COVER………….……...40
FIGURE 6.1-MIXED CONIFER SAPLING COUNTS.……….41
FIGURE 6.2-PONDEROSA PINE SAPLING COUNTS………...41
FIGURE 7.1-MIXED CONIFER CONE PRODUCTIVITY………..42
INTRODUCTION
Wildfire is a major disturbance in ecosystems across the United States (Agee 1993) and is an important driver of landscape change (Fulé et al. 1997). In the Southwestern United States historic fire regimes included frequent low-severity surface fires in ponderosa pine (Pinus Ponderosa) and low elevation dry (warm, dry) mixed-conifer forests (White and Vankat 1993, Fulé et al 2000), less frequent mixed-severity fires in mid-elevation wet (cool, mesic) mixed-conifer forests, and infrequent, high-severity fires in higher elevation spruce-fir forests (White and Vankat 1993). In Arizona and New Mexico, pure ponderosa pine and mixed-conifer forests occupy nearly 2.5 and 1 million hectares of forest area, respectively (Brown 1994, Korb et al. 2013). As a dominant species in Southwestern forests, ponderosa pine can influence forest ecosystems and fire behavior (Moore et. al. 1999). As a consequence of frequent low-severity surface fire, ponderosa pine forests in northern Arizona have been described as low-density, open forests consisting of aggregations of old pine trees interspersed with aggregations of younger pine trees in a grass/shrub matrix (White 1985), while mixed-conifer forests have been classified into two sub-categories: warm/dry and cool/moist forests (Romme et al. 2009). Dry mixed-conifer forests are typically located at lower elevations and are dominated by ponderosa pine and Douglas-fir, but can include white fir (Abies concolor) and aspen (Populus tremuloides) (Korb et al. 2013). Historically, these forests were characterized by large old trees, relatively open with low trees densities, and heterogeneous patches of uneven-aged trees (Binkley et al. 2008, Fule et al. 2009). Snag, log, and woody debris abundance was thought to be similar to ponderosa pine forests (Moore et al. 2004). Cool/moist mixed-conifer forests, in comparison, are found at higher elevations and include a greater abundance of Douglas-fir (Pseudotsuga menziesii) and other conifers adapted to these conditions (Romme et al. 2009).
Cool/moist forests are more spatially heterogeneous regarding patch sizes that differ in tree ages and densities than ponderosa pine and dry mixed-conifer forest types due to a mixed-severity fire regime (Binkley et al. 2008, Fule et al. 2009).
After more than a century of extensive fire exclusion starting in the early 1900’s, along with other management practices, ponderosa pine and mixed-conifer forest have been altered by increases in tree densities, a shift to more shade-tolerant tree species, accumulations of small trees, accelerated mortality of old trees, and diminished understory (herbs, shrubs) productivity (Covington and Moore 1994, Fule et al. 2009, Churchill et al. 2013). The buildup of fuel has made these forests vulnerable to high-severity crown fires that not only kill trees but exposes landscapes to erosion, exotic plant invasion, and other negative consequences (Covington et al. 1994, Griffis et al. 2001).
Historically, the fire return interval in Southwestern ponderosa pine ranged from 2-25 years (Swetnam and Baisan 1996, Heyerdahl et al. 2001). Frequent fires in this ecosystem favored shade intolerant, fire resistant tree species, minimal fuel build up, and open forest conditions that promoted productive understory growth (Fule and Laughlin 2007). Pre-settlement mixed-conifer forests (both dry and wet mixed-conifer) were shaped by mixed-severity fire regimes consisting of areas of surface and areas of stand-replacing fires that could occur in the same event. These ecosystem types contained trees of various ages and species composition resulting from variation in fire intensity, frequency, and area burned (Fule et al 2003). Pre-settlement dry mixed-conifer forests were historically dominated by ponderosa pine, Douglas-fir and white fir and had reported fire return intervals of 4-14 and 18-32 years (similar to ponderosa pine forests) in two studies (White and Vankat 1993, Brown et al. 2001, Korb et al. 2013). Historically, wet mixed-conifer forests had sub-decadal to century long fire return intervals upwards of 200 years (White and Vankat 1993, Romme et al. 2009). Wet mixed-conifer forests were characterized by cooler mesic conditions, increased tree density and canopy cover, infrequent intense fires, and fire intolerant overstory trees (White and Vankat 1993). Because of long fire return intervals in high elevation Engelmann spruce-sub-alpine fir landscapes, fire suppression has had little effect on these ecosystems (White and Vankat 1993). Due to more frequent surface fire, dry mixed-conifer forests were more open with groups of small trees similar to ponderosa (Fule et al. 2003, Romme et al. 2009). Moist higher elevation forests experienced less frequent moderate to high severity fires that created large patches (cohorts) of similar-aged trees (Fule et al. 2003, Romme et al. 2009).
In many instances alteration of the historic fire regimes, especially in ponderosa pine and dry mixed-conifer forests, created conditions that currently favor more frequent and large high severity wildfires. Forest ecosystems that were typically shaped by low-intensity and mixed severity fires have been transformed into ones that are susceptible to high-severity, stand-replacing crown fires.
The northern goshawk’s (Accipiter gentilis), a U.S. Forest Service sensitive species of special conservation concern, response to habitat changes due to forest management and disturbances such as fire is of particular interest throughout Western U.S. forests. The goshawk is a large forest dwelling raptor that occupies mature temperate and boreal forests throughout the Holarctic (Squires and Reynolds 1997). Goshawk home ranges vary from 15-30 km2 and are generally “fixed” in their locations, with minor yearly fluctuations due to their nesting and foraging requirements (Reynolds et. al. 1994). Goshawks occupy a variety of forest types that are composed of different vertical and horizontal structures
throughout their N.A. range. Typically, goshawks in the Southwest U.S. nest in mature trees with large open branches and hunt in the sub-canopy space, along forest edges, and in herbaceous and shrub openings (Reynolds et al. 1992, 2006, 2013). Nest sites are characterized by mature and old trees and relatively dense canopies that provide nest protection from predators and environmental extremes. Nesting sites comprise < 1% (0.12 km2) of the total goshawk home range and have low vegetative structural diversity compared to forest conditions in their much larger home ranges, which is used for foraging, roosting, and by young hawks post-fledging (Reynolds et. al. 2006). On the Kaibab Plateau mature and old canopy forests with open understories are used more often than any other forest types by breeding goshawks (Bright-Smith and Mannan 1994, Reynolds et al. 2006). Adapted to foraging in the lower vegetation column of forests, a goshawk’s hunting ability is thought to be impaired when forest understories become filled with small trees or tall dense brush (Reynolds and Meslow 1982) due to a lack of fire and other ecological processes. Loss of nesting and foraging habitat due to high-severity fire may also decrease survival and nesting productivity through loss of prey habitats and lowered prey abundance. Due to the complexity of forest fire regimes, most of which have been altered throughout the goshawks
geographic range, understanding fire effects on its food webs, on its habitats, its reproduction, and its population viability is an important conservation concern across the southwestern United States.
Goshawks on the Kaibab Plateau have a diverse diet, foraging upon a suite of more than 20 species of ground and tree squirrels, rabbits and hares, woodpeckers, grouse, turkeys, and passerines (Reynolds 1983, Reynolds and Meslow 1984, Reynolds et al. 1994, Squires and Reynolds 1997, Salafsky et al. 2005, 2007). Prey counts conducted from 1999-2002 suggested that prey species abundance is a factor limiting goshawk reproduction on the Kaibab Plateau (Salafsky 2004, Salafsky et al. 2005, 2006). Quantifying the effects of fire on bird and mammal prey of goshawks is difficult since there is a high degree of species-specific responses to fire and variation in detectability. Bock and Block (2005) found that season, scale, size and severity of fire influenced bird and mammal responses to fire disturbances. Saab et al. (2002) noted that fire can create unique nesting and foraging habitats by increasing diversity in vegetation type, canopy closure, and climate. Studying the effects of fire on the birds and mammals in the goshawk food web is important because goshawks are both food limited (Salafsky et al. 2005, 2007) and a species of special concern in the Southwest forests. Uniquely suited to preying on a varied suite of birds and mammals in Kaibab plateau forests, goshawk productivity has been closely tied to annual fluctuations in prey abundance (Salafsky 2004, Salafsky et al. 2005, 2006), and prey abundance depends of availabilities and productivities of varied habitats that support the suite of prey.
From 8 June 2006 to containment on 4 July 2006, the Warm Fire, which started as a lightning strike, burned 235 km2 of ponderosa pine and mixed-conifer forest on the North Kaibab Ranger District in northern Arizona. For 18 days post-ignition, the Warm Fire met District and Federal Wildland Fire Management criteria to be used as a wildland fire-use fire, during which time approximately 77 km2 were burned at low to moderate-severity. On 25 June 2006 weather conditions changed and the fire exceeded its maximum manageable area and active suppression was initiated. An additional 158 km2 of forest burned between 25 June and 4 July 2006, before full containment. The majority of the forest that burned after 25 June 2006 had moderate-high and high-severity fire damage, while some small patches dispersed throughout the fire burned at low and moderate-low severity. In total, approximately 64% of the Warm
Fire (12% of the North Kaibab Ranger District) burned at moderate-high to high-severity and 36% (7% of the North Kaibab Ranger District) burned at moderate-low to low-severity, resulting in some level of alteration to almost 20% of the forests on the ranger district.
Changes in live forest structure caused by the Warm Fire provided an opportunity to explore the impact of fire on the composition and structure of habitats and species composition and abundance of bird and mammal prey of goshawks. To evaluate how fire severity affected the flora and fauna of the Kaibab Plateau, I conducted surveys of (1) the vegetation composition and structure of post-Warm Fire habitats and (2) estimated bird and mammal abundances in ponderosa pine and mixed-conifer forests on transects in areas unburned, burned at low-severity, and burned at high-severity fire in the Warm Fire.
Study Objectives:
1. Describe and compare the vegetation composition and structure in relation to fire severity (no burn, low-severity, and high-severity) in the ponderosa pine and mixed-conifer forest types. 2. Estimate the composition and abundance of bird and mammal species by forest type (ponderosa
pine, mixed-conifer) and by fire severity.
3. Model the effects of selected forest metrics and fire severity on birds and mammals and determine the best models for predicting species abundance.
METHODS
Study Area
The 1,285 km2 study area (Figure 1) includes the North Kaibab Ranger District of the Kaibab National Forest above 2,182 m elevation on the Kaibab Plateau in northern Arizona. The eastern, southern, and western edges of the plateau are formed by steep slopes, creating a distinct boundary between the forests and surrounding shrub-steppe ecosystems. The northern edge of the Plateau slopes gradually through a broad ecotone from shrub-steppe ecosystems (1,750 m elevation) to spruce-fir forests at the highest elevations (maximum 2,800 m). Mixed-conifer forests occupy about 275 km2 (20%) of the study area at the highest elevations, ponderosa pine (Pinus ponderosa) forests occupy 714 km2 (55%) at mid-elevation ranges, and pinyon-juniper (Pinus edulis, Juniperus spp.) woodlands occupy 106 km2 (<10%) at the lower elevations. Quaking aspen (Populus tremuloides) forests cover about 112 km2, interspersed among the other forest woodland types (Joy 2002), comprising up to 14% of the tree basal area on the Plateau (Binkley et al. 2006). Ponderosa pine forests of the Kaibab Plateau are characterized by relatively low tree diversity (White 1985). Common ponderosa pine understory grasses included: Bromus spp., wild rye (Elymus elymoides), mountain muhly (Mulenbergia montana), and Poa spp; understory forbs include: Antennaria spp., Chenopodiaceae spp., Wright’s deervetch (Lotus wrightii), and Lupinus spp.; and understory shrubs include: Oregon grape (Berberis repens), Fendler’s ceanothus
(Ceanothus fendleri), and New Mexican locust (Robinia neomexicana). Mixed-conifer forests of the Kaibab Plateau have higher tree diversity than ponderosa pine (White and Vankat 1993). Species commonly found in mixed-conifer forests include: white fir (Abies concolor), subalpine fir (Abies lasiocarpa), Englemann spruce (Picea engelmannii), ponderosa pine, quaking aspen, and Douglas fir (Pseudotsuga menziesii). Common mixed-conifer understory grasses include: Bromus spp., wild rye, Festuca spp., and Poa spp.; understory forbs include: Antennaria spp., Chenopodiaceae spp., wild strawberry, Fragaria vesca, and Lupinus spp.; and understory shrubs include: Oregon grape, Fendler’s ceanothus, common juniper (Juniperus communis), and Ribes spp.
Almost all of the North Kaibab Ranger District had received tree harvests prior to the Warm Fire. Organized tree harvests on the NKRD began in the early 1900s and were primarily limited to cutting dead and dying trees (single-tree selection harvest) (Sesnie and Bailey 2003). In the 1960s, small patch cuts began in higher elevation mixed-conifer forests, but were discontinued in the early 1970s. In the 1980s intensive stand management using shelterwood / seed-tree cuts occurred to create even-aged forest patches in ponderosa and mixed-conifer forests, but by the early 1990s this protocol was discontinued (Sesnie and Bailey 2003). While pre-1960s selection harvests occurred over much of the NKRD, intensive stand management occurred in scattered patches on the Kaibab plateau (Sesnie and Bailey 2003).
Sampling Design
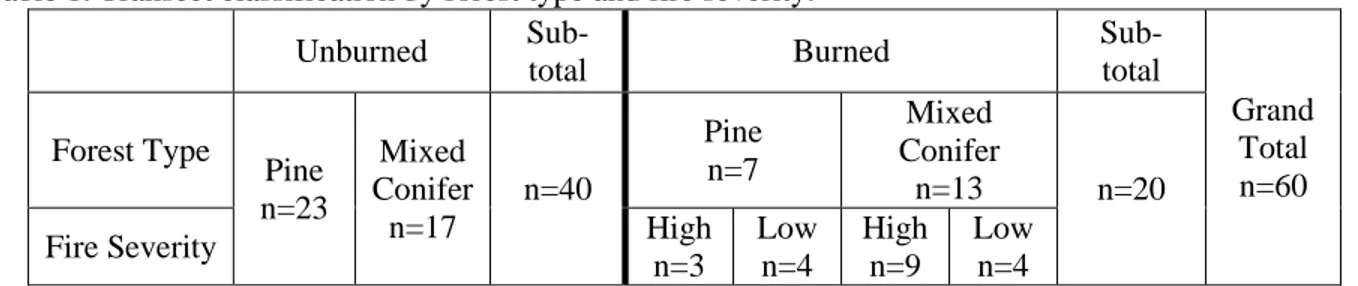
To evaluate the effects of the 2006 Warm Fire on habitat composition and structure, and associated prey species, I measured vegetation composition and structure and conducted bird and mammal counts on 60 transects placed in six strata (unburned, low-severity, and high-severity fire in ponderosa pine and mixed-conifer forests that had previously been treated with two different silvicultural prescription, single-tree harvested and shelter-wood/seed-tree harvest) over 4 post-fire years (2007-10). With vegetation burn severity maps (North Kaibab Ranger District, NKRD 2007), I aggregated moderate-high and moderate-high-severity burn categories into one moderate-high-severity strata, and moderate-low and low-severity burn categories into one low-severity strata (North Kaibab Ranger District, NKRD 2007). I sampled a total of 60 0.5km transects (Table 1); 40 in unburned forest (23 in ponderosa pine, 17 in mixed-conifer), 8 burned by low-severity fire (4 in ponderosa pine, 4 in mixed-conifer), and 12 burned by high-severity fire (3 in ponderosa pine, 9 in mixed-conifer).
I selected 49 of my 60 transects from 60 previously-established transects used in a study of co-variation between prey abundance and goshawk fecundity (Table 2) (Salafsky 2004). I randomly chose and sampled 40 transects from 51of the original 60 pre-existing transects that had been unburned in the Warm Fire. I sampled all 9 of the original 60 pre-existing transects that were burned by the fire. Finally, during the summer of 2007, I established 11 new transects in forests burned at high (n=6) and low (n=5)
severity, bringing the total transects I sampled to 60. Previously established transects were used in my study to (1) minimize transect establishment time and to maximize data collection opportunities and (2) to provide for future comparisons of pre- and post-fire data to model prey abundance and goshawk
reproduction over time. By the 1980s nearly the entirety of the North Kaibab Ranger District had received single-tree (locally known as “pick and pluck”) selection harvests. In the 1970s and 80s a more intensive stand management was introduced whereby 0.12-0.16 km2 areas were harvested with shelter-wood and seed-tree prescriptions (Sesnie and Bailey. 2003). By 1990, approximated 30% of the North Kaibab Ranger District had been shelter-wood or seed-tree harvested (Sesnie and Bailey 2003). Thus, in the Salafsky (2004) study and in my study, transects were allocated among single-tree and
shelter-wood/seed-tree harvested forests according to the approximate proportional areas of these past treatments. However, for the purposes of my study, I did not distinguish between the two harvest treatments and assumed that bird and mammal abundances reported here reflected average abundances in the two treatments. Ten of the transects I sampled in unburned ponderosa pine transects had received seed-tree harvest treatments before the Warm Fire, five in unburned mixed-conifer forests had also received seed-tree treatments, and six in high-severity mixed-conifer forest had received seed-seed-tree treatments.
The 11 new transects that I established were located and classified using Warm Fire vegetation burn severity maps (North Kaibab Ranger District 2007). The eastern edge of the Warm Fire,
characterized by narrow ridges and steep drainages, presented a challenge when selecting new transects due to the need for uniformly viewable areas on each side of transects. This requirement was identical to that used for establishing and sampling all of the pre-existing transects (Salafsky 2004). Prior to
establishment, all potential new transect locations were visited to confirm burn severity as indicated by the burn severity maps (North Kaibab Ranger District 2007), forest type, management classification, and to address logistical and safety considerations. All pre-existing transects were also visited to confirm fire severity classification, forest type, and management classification. An equal number of transects were located in each forest type (n=30). Fire size (proportional to each severity category), habitat (unburned, burned) continuity, and transect viewable area constrained the number of transects in each strata. All
transects were located completely inside one forest type and fire severity category. Transect width varied by the detectability specific to each bird and mammal species and reflected the criteria used in the
Salafsky (2004) study. Each transect consisted of 11 reference stakes marked at 50 meter intervals, four of which were randomly selected along each transect to serve as center points for vegetation plots. Vegetation Sampling
I determined the mean density of live trees per km2 on each transect by averaging the tree densities on each of the four plot centers on each transect. I used the variable-radius plot technique with an angle gauge and a basal area factor (BAF) of 20 ft2/acre (4.59 m2/ha) to determine tree densities. Live tree densities were determined from the center of each plot by collecting the diameter at breast height (dbh) of each live tree counted ‘in’ with the angle gauge. I then calculated the number of trees per km2 from measurements collected and averaged the four plot values to determine a mean density for each transect. This procedure was used to calculate the mean density of all live and dead trees >20cm dbh.
Tree canopy cover estimates were estimated at each plot center using a spherical densitometer. The unburned plot canopy cover estimates that I used were collected by Susan Salafsky (personal communication) prior to the Warm Fire. Cover estimates for all pre-existing plots burned by the Warm Fire and all newly established plots were collected post-fire. Mean canopy cover estimates for each transect were determined by averaging the cover estimates calculated for each plot.
Cone counting was conducted to index potential food supplies for birds and mammals (cone productivity). In late July and early August of each year, the closest tree ≥30 cm dbh in each quadrant (NE, SE, SW, and NW) from the plot center was selected for cone counting. A total of four trees were sampled on each plot. If the closest tree ≥30 cm dbh was non-cone producing the count for that tree was recorded as zero. Current year cones were counted by placing a 1m2 frame on the ground at eight cardinal directions (N, NE, E, SE, S, SW, W, NW) under the crown of each Douglas fir, Engelmann spruce, and ponderosa pine tree. To assess cone production of subalpine and white fir trees, which do not accumulate cones on the ground, cones were counted in the canopies of each tree using binoculars. Mean cone count estimates for each transect were determined by averaging the counts obtained from each plot.
Understory ground cover measurements were collected from 2007-2010 from the four 20m radius plots on each transect. Ocular estimates of live ground cover (grasses, forbs, and shrubs; tree seedlings and sapling excluded) were collected annually on all plots and the dominant forbs and shrubs were identified each year. Numbers of sapling (conifer and aspen) ≥1.5m in height and ≤10cm dbh in each plot were tallied. Understory plot measurements were collected by the same trained teams of two technicians during the study in order to minimize observer bias.
Prey Sampling
From 2007-2010, I conducted distance sampling to estimate the abundance of bird and mammal species commonly found in goshawk diets on the Kaibab Plateau (Reynolds et al. 1994, Salafsky et al. 2005). Bird species sampled included American robin (Turdus migratorius), Dusky grouse
(Dendragapus obscurus), Clark’s nutcracker (Nucifraga columbiana), downy woodpecker (Picoides pubescens), hairy woodpecker (Picoides villosus), mourning dove (Zenaida macroura), northern flicker (Colaptes auratus), red-naped sapsucker (Sphyrapicus nuchalis), Steller’s jay (Cyanocitta stelleri), three-toed woodpecker (Picoides dorsalis), and Williamson’s sapsucker (Sphyrapicus thyroideus). Mammal species sampled included black-tailed jackrabbit (Lepus californicus), chipmunk (Tamias spp.), cottontail rabbit (Sylvilagus spp.), golden-mantled ground squirrel (Callospermophilus lateralis), Kaibab squirrel (Sciurus aberti kaibabensis), red squirrel (Tamiasciurus hudsonicus), and rock squirrel (Spermophilus variegatus). I conducted counts on 0.5km line transects following assumptions and sampling protocols in Buckland et al. (2001) and procedures used by Salafsky (2004). I sampled each transect once in 2007 (late summer) then twice (early summer and late summer) annually from 2008-2010. Early summer counts occurred between 28 May and 24 June and late summer counts between 23 July and 14 August. All surveys were conducted by two observers (2007: J. Lambert and W. Nimitz, 2008 – 2010: J. Lambert and C. Lambert). Each observer was experienced at identifying bird and mammal species both visually and aurally and each was trained to the same counting methods. During each sampling period six transects were sampled daily (3 transects per observer). Sampling was not conducted during rain or heavy wind due to reduced animal activity and detectability. The order of transect surveys was
randomized each sample period to minimize observer and time-of-day bias. Prey sampling began 0.5 hours after sunrise and was completed within 3.5 hours. Individuals seen or heard were identified to species and the perpendicular distance from the transect line to the individual was determined using a laser rangefinder (accuracy + 1 m). The few individuals that could not be visually or aurally located accurately were not tallied.
Data Analysis
Vegetation measurements at the transect level were evaluated using the least square means procedure in GLIMMIX with α ≤ 0.05 to identify significant differences in vegetation within each forest type across fire severity categories (PROC GLIMMIX, SAS Institute version 9.4, 2012). The Tukey-Kramer adjustment for multiple comparisons was used to assess the differences in the means of canopy cover, live tree density, live large tree density (>20cm dbh), snag density, large snag density (>20cm dbh), live ground vegetation, saplings per plot, and cone production by conifer species (Ott and Longnecker 2001). All data were modeled in GLIMMIX using a beta distribution for percentage estimates and a negative binomial distribution for count data (PROC GLIMMIX, SAS Institute version 9.4, 2012). Common data transformations were applied to the data but none improved analysis so data were imported into SAS in an untransformed format. Data presented in figures and tables are also untransformed.
I used the gdistsamp (generalized distance sampling) function in the UNMARKED (Fiske and Chandler 2011) package of the statistical software R (The R Foundation, Version 3.0.1, 2013) to estimate the abundance of all birds and mammals. The gdistsamp function fits the generalized distance sampling model of Royle et al. (2004), which allows abundance and detection parameters to be modeled as functions of covariates (Royle et al. 2004). The UNMARKED package utilizes replicate sampling to estimate the abundance (λ) of the sampled population (the number of individuals that could potentially use a survey area) and probability that a given bird or mammal species is available (φ) to be counted. I used the negative binomial distribution to model abundance and all observation distances were right truncated to conform to Salafsky (2004) protocols. Distance sampling estimates a detection function that
compensates for differences in detection probability among species, habitats, and distances. Thus, density estimates were not confounded by differences in detectability due to the different forest types that were sampled (Buckland et al. 1993).
The UNMARKED package has several advantages over other estimation programs that potentially improve the accuracy of abundance estimates and predictions. UNMARKED relaxes the assumption that all individuals on a survey line are detected [(g (0) =1)], and allows for temporary immigration and emigration of mobile species in and out of survey sites (Chandler et al. 2011). By accounting for temporary immigration and emigration of mobile species to and from unknown locations, UNMARKED estimates the abundance (λ) of individuals that could potentially use a survey plot, given a set of conditions (Chandler et al. 2011), however these estimates do not represent the number of
individuals per unit of area. The second element of the model estimates the probability that an individual will be available to be counted (φ) on a plot given a set of temporal and spatial conditions (Chandler et al. 2011). Abundance (λ) was modeled by fire severity and availability (φ) (both reported in Appendix A) was modeled by forest type and year. Density (D) of each species per km2 (reported in Appendix B) can be obtained by multiplying the abundance estimate by the availability estimate (λ φ).
Buckland et al. (1993, 2001) recommends that approximately 60 observations are needed for reliable estimates of abundance. Thus, I estimated abundance only for species with >60 detections per year and tested models of the effects of fire severity differences on these species. To achieve a minimum of 60 observations for some under-counted species, counts were aggregated to estimate abundance at the guild (i.e., woodpeckers) level while counts of a few other species were aggregated across within-year sample periods. To evaluate the best models for predicting bird and mammal abundances, I used
Akaike’s Information Criterion (AIC) and Akaike weights (Burnham and Anderson 2002) generated with the R statistical software package UNMARKED. Models were developed a priori to evaluate how fire severity and vegetation characteristics that I hypothesized to be biologically important (e.g. tree and snag densities, canopy cover, food resources, ground cover) influenced bird and mammal abundances (Table 3 for a list of models). I used a ∆AIC of 2 to identify competitive models (Burnham and Anderson 2002).
Year was included in each model as a surrogate for unmeasured variables (e.g., precipitation,
temperature). Because AIC comparisons require data sets of equal sample size, I was unable to use the 2007 count data to test models because I only sampled transects once that season.
RESULTS
Tree and Snag Density and Canopy Cover
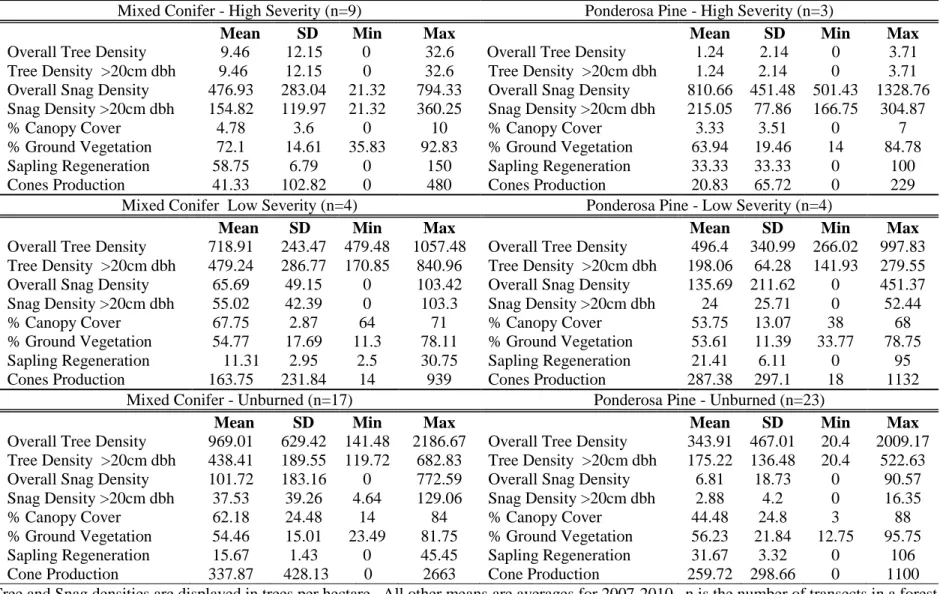
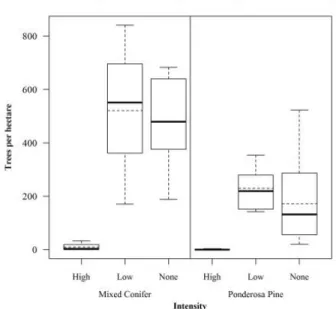
Relative to no-burn and low-severity fire, total live tree density, large (>20cm dbh) live tree density, canopy cover, and conifer cone production were, as expected, lower in both ponderosa pine and mixed-conifer forests burned at high severity (Figures 2-3, Appendix C).The total and large (>20cm dbh) snag densities in high severity burns were higher in both ponderosa pine and in mixed-conifer forests than in low severity and unburned forests; however, these means were significantly different only for total snags in mixed-conifer and large snags in ponderosa pine (Figure 4.1, 4.2, Appendix C). Although there were wider ranges of total live trees and canopy cover in unburned versus low-severity burn in both forest types, there were no significant differences in mean numbers of total and large live trees, and canopy cover from unburned forests. In ponderosa pine forests, densities of total and large snags were significantly higher in low severity versus unburned forests, but not in mixed-conifer (Figures 2-4, Appendix C).
Mixed-conifer.—Mixed-conifer forest transects burned by high-severity fire had an average of 709 fewer live trees/ha and 63% lower canopy cover compared to low-severity fire and an average of 960 fewer live trees/ha and 58% less canopy cover compared to unburned transects (Table 4). Transects burned by high-severity had an average of 470 fewer large live trees/ha compared to low-severity fire and an average of 429 fewer large live trees/ha compared to unburned mixed-conifer forests. Post-fire there were more snags on transects burned by high-severity than low-severity and unburned transects. There were significantly more large snags on mixed-conifer transects burned by high-severity fire than unburned transects, but there was no significant difference in large snag densities on high versus low-severity fire transects. On average, transects burned by high-low-severity fire had 411 more snags/ha than low-severity and 375 more snags/ha than unburned transects. Transects that were burned by high-severity fire also had an average of 117 more large snags/ha on unburned transects. No statistical differences in
total live tree, total snag densities, and canopy cover were found on mixed-conifer transects burned by low-severity fire versus unburned transect due to minimal low-severity ground fire effects in these forests.
Ponderosa pine.—Ponderosa pine forest transects burned by high-severity fire had an average of 495 fewer total live trees/ha and 50% less canopy cover compared to low-severity fire and an average of 343 fewer live trees/ha and 41% less canopy cover compared to unburned transects (Table 4). Transects burned by high-severity had an average of 197 fewer large live trees/ha compared to low-intensity fire and an average of 174 fewer large live trees/ha compared to unburned ponderosa pine forests. Post Warm fire I found an average of 804 more snags/ha on transects burned by high-severity fire than unburned transects. However contrary to expectations, there was no statistical difference in total snag density between transects burned by and low-severity fire. Large snag density on transects burned by high-severity fire averaged 191 more snags/ha compared to low-high-severity fire, and 212 more snags/ha compared to unburned transects. On average there were also 21 more snags/ha on low-severity fire transects
compared to unburned transects. No other statistical differences in tree or snag densities and canopy cover were found when forests burned by low-severity fire were compared to unburned transects. Ground Cover
The percentage of live ground cover was greater on mixed-conifer transects burned by high-severity fire compared to low-high-severity fire and unburned transects. In contrast, there was no significant difference in the percentage of ground cover when ponderosa pine forests were compared across fire severities (Table 4, Figure 5.1, 5.2). The dominant flora (forbs and shrubs) found on transects were identified to species and reported by forest type and fire severity (Appendix D).
Mixed-conifer.—Mixed-conifer ground plots burned by high-severity fire averaged 17% more ground cover than low-severity fire and 18% more ground cover than unburned transects. No statistical difference in ground cover was found between transects burned by low-severity fire and unburned transect.
Ponderosa pine.—No statistical difference in the percent of ground cover was found when transects were compared across fire severity types, possibly due to low vegetative growth on pine transects in the first year (2007) of observation (Figure5.2, Appendix C).
Sapling Counts
There were more saplings in the 20m radius plots in mixed-conifer and ponderosa pine forest burned by high-severity fire than in low-severity. There were more saplings in mixed-conifer forests burned by high-severity fire than in unburned forests, but there were no significant difference between pine forests burned by high-severity fire versus unburned. There were also fewer saplings in mixed-conifer and ponderosa pine transects burned by low-severity fire compared to unburned forest transects (Table 4, Figure 6.1, 6.2).
Mixed-conifer.—Mixed-conifer burned by high-severity fire had an average of 47 more saplings per transect than low-severity fire and 43 more saplings per transect than unburned transects. Transects burned by low-severity fire had an average of 4 fewer saplings per transect than unburned transects.
Ponderosa pine.—Ponderosa pine burned by high-severity fire had an average of 12 more saplings per transect than low-severity fire transects. However no significant difference in the number of saplings was found when transects burned by high-severity fire were compared to unburned transects. Transects burned by low-severity fire had 10 fewer saplings per transect than unburned transects. Cone Productivity
Mixed-conifer and ponderosa pine transects burned by high-severity fire had significantly fewer cones than low-severity fire and unburned transects. No significant difference in the number of cones were found along transects burned by low-severity fire versus unburned transects (Table 4, Figure 7.1, 7.2).
Mixed-conifer.—Mixed-conifer transects burned by high-severity fire had an average of 122 fewer cones per transect than low-severity fire and 297 fewer cones per transect than unburned transects. There was no significant difference in the number of cones counted on mixed-conifer transects burned by low-severity fire compared to unburned transects.
Ponderosa pine.—Ponderosa pine transects burned by high-severity fire had an average of 267 fewer cones per transect than low-severity fire and 239 fewer cones per transect than unburned transects. There was no significant difference in the number of cones counted on ponderosa pine transects burned by low-severity fire compared to unburned transects.
Bird and Mammal Abundance
A total of 17 bird and mammal species were observed at least once during the four study years (Table 5). Of the birds and mammals reported in the diets of goshawks on the NKRD (Reynolds et al. 1994, Salafsky et al. 2005), only black-tailed jackrabbits were not observed. However, cotton-tailed rabbits, dusky grouse, rock squirrels, red-naped sapsuckers, and black-tailed jackrabbits were observed four or fewer times during transect surveys. Of the seven species with ≥60 observations per year (Table 5, those species included in predictive models), the hairy woodpecker (low: p=.46, unburned: p<.01) and northern flicker (low: p=.02, unburned: p=.05) were the only species that were more abundant in burned (high- or low-severity) than unburned forests. In contrast, golden-mantled ground squirrels (low: p=.03, high: p=<.01) were less abundant in burned (high- and low-severity) than unburned forests. Similarly, red squirrels (low: p<.01, unburned: p<.01) were less abundant in forests burned by high-severity fire than low-severity and unburned forests. American robin, chipmunk, and Steller’s jay abundances were similar in burned and unburned forests (Appendix A).
Predictive Models
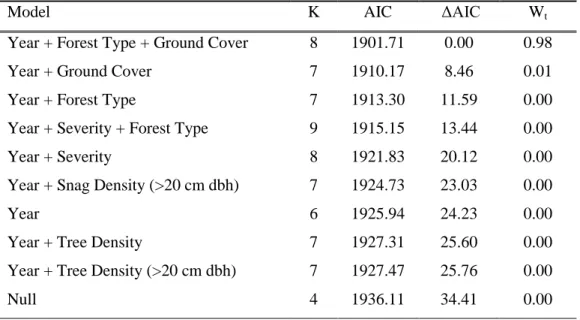
Models of fire severity differences on vegetation composition and structure show that fire severity was an important factor for predicting the abundance of some birds and mammals, but not all species (Table 3). The top model predicting American robin abundances contained year, forest type, and live ground cover covariates and had a weight of evidence of 0.98. American robin abundance was highest in mixed-conifer forests sites with greater ground vegetation cover. The top model predicting chipmunk abundance also contained year, forest type, and live ground cover and had a weight of evidence of 0.56. A second competing model, (ΔAIC ≤2) contained year and forest type covariates and carried a weight of evidence of 0.28. While the inclusion of ground cover contributed some weight to the top
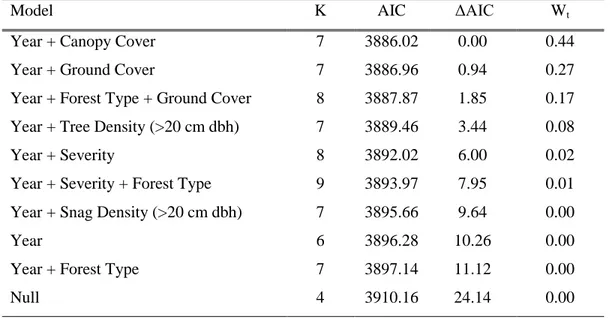
model, the second model with fewer covariates is more parsimonious and therefore may be a better predictor of chipmunk abundance. In the top model, chipmunk species were found to be most abundant in ponderosa pine then mixed-conifer forests. The top model for Steller’s jay’s had a weight of evidence of 0.23. Three other competing models, including the null model, carried weight suggesting that we may not have had a sufficiently good model to predict jay abundance. Northern flicker abundance was predicted best by the model containing year and canopy cover covariates with a weight of evidence of 0.44. Two other competing models also carried weight (year, ground cover, Wt=0.27; and year, forest type, ground cover, Wt=0.17). Either of these models, especially the second which had fewer covariates, could be an equal or better predictor of abundance. In the top model, flickers were most abundant in forests with less canopy cover, while in the second and third models they were most abundant in forests with more ground vegetation cover.
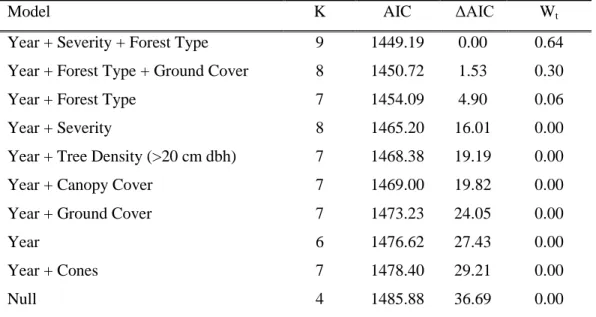
Fire severity was an important factor for predicting the abundance of three species showing the most sensitivity to fire effects. Fire severity was included in the best model for golden-mantled ground squirrels, hairy woodpeckers, and red squirrels. The top models for estimating abundances of golden-mantled ground squirrel (Wt = 0.64), hairy woodpecker (Wt = 0.51), and red squirrel (Wt = 1.00) contained year, fire severity, and forest type. Golden-mantled ground squirrels had a second competing model containing year, forest type, and ground vegetation cover with a weight of evidence of 0.30. Since these competing models contained the same number of covariates, either model may equally predict abundance. In the top model, golden-mantled ground squirrels were more abundant in unburned ponderosa pine forests. Red squirrels were equally abundant in mixed-conifer forests unburned or burned by low-severity fire. In contrast, hairy woodpeckers were more abundant in forests burned at high- and low-severity. However, a second competing model with year and fire severity (no forest type) had an almost equal weight of evidence of 0.49, suggesting that forest type contributed minimal weight to the top model. This second model had fewer covariates and may be an equally acceptable or better predictor of hairy
woodpecker abundance. Fire severity was in the top model predicting the total abundance of individuals in the woodpecker guild. This model contained year and fire severity and had a weight of evidence of
0.72. A second competing model included year, fire severity, and forest type with a weight of evidence of 0.28. Woodpecker guild abundance was highest in forests burned by high-severity fire with some
evidence in the second competing model that abundance in this guild was higher in ponderosa pine than mixed-conifer forests.
DISCUSSION
Forests are dynamic ecosystems that undergo change through vegetation growth, senescence, and mortality, and natural (i.e., fire, insects, diseases, and wind) and anthropogenic disturbances (i.e., tree harvests). These changes have both short and long term impacts on habitats and the animals that depend upon them (Bartels and Thompson 1993).
The 2006 Warm Fire started on 4 June and burned 235
km
2of ponderosa pine and mixed-conifer forest on the North Kaibab Ranger District. During
the initial 18 days, the Warm Fire was managed as a wildland-use fire during which 77 km
2was
burned mostly at low- to moderate-severity. However, on 25 June the weather changed and
winds pushed the fire south burning approximately 158 km
2mostly at high-severity until
containment on 4 July. As expected, the h
igh-severity burn portions of the Warm Fire had the greatest influence on habitat composition and structure, reducing canopy cover, number of live trees, and conifer cone production. However, these losses were countered by a significant flush of new ground cover, especially in mixed-conifer forests, and creation of an abundance of snags, which are important habitats to many birds and mammals—especially to species in the woodpecker guild. Most of the soil’s O horizon (organic material), which contains food resources for birds and mammals, was also consumed in high-severity fire, exposing the mineral soil in areas (personal observation). Mixed-conifer forests burned at high-severity had a greater percentage of live ground cover post-fire than forests burned by either low-severity or unburned areas, a response consistent with the idea that fire can be a driver of understory diversity and structure (Laughlin et al. 2006, McMasters 2010). Higher levels of herbaceous ground vegetation in areas of high-severity fire results from stimulation of fine root production,decomposition, nitrogen mineralization, and other micro-environmental processes (Covington et al. 1997, Turner et al. 1997). Grass, forb, and shrub cover can also increase with a reduction in tree competition (reduced shading) frequently diversifying the plant community (Moore and Deiter 1992, Covington et al. 1997). In low-severity burned areas an insufficient amount of the O horizon may have been consumed by
the fire, limiting mineral nutrient returns to the soil, constraining a flush of vegetative growth observed in some high-severity burns (Laughlin and Abella 2007). Sapling density, especially aspen, was high in areas burned at high-severity fire in the Warm Fire; a finding similar to other studies of fire effects on aspen regeneration (Smith et al. 2011). Large clumps of small diameter pine saplings were present on 15 or more unburned ponderosa pine transects. In the absence of regular surface fire, establishment and growth of patches and clumps of dense saplings, both beneath overstory trees and in opening between tree groups restrict the detection and access to ground prey (ground squirrels, rabbits, hares, grouse, turkey) by winged predators such as the northern goshawk that hunt in the sub-canopy spaces of forests (Reynolds et al. 1992, 1996, Moore et al. 1999, Covington 2003, Koprowski et al. 2006). Loss of the grass, forb, and shrub vegetation (which support many different plants, insects, birds, and mammals) due to ingrowth and shading by dense regeneration, especially in openings between tree groups, can result in reductions in biodiversity, trophic interactions, and biological productivity and efficiency (Moore et al. 2006, Reynolds et al. 2006, Kalies et al. 2012, Reynolds et al. 2013).
Red squirrel and golden-mantled ground squirrel abundances were lower in areas burned by high-severity fire, likely because of the loss of cone producing large live trees, nesting and denning sites (woody debris, logs, stumps, live tree nests), food resources (e.g., conifer cone middens, herbaceous plants), and live tree canopy. Direct mortality from fire, loss of cover, increased exposure to predators, and increased distance from re-colonizing populations are other possible factors affecting their post-burn abundances in high-severity fire areas (Converse et al. 2006, Koprowski et al. 2006, Kalies et al. 2012). Depending on scale, due to positive post-fire influences on understory productivity, food resources, and habitats of high-severity fire can benefit other small mammals such as mice (peromyscus spp.) and voles (Microtus spp.) (Kalies et al. 2012), which were not included in my study.
Low-severity fire, that consumes ground fuels and reduces tree regeneration, can benefit many mammal and bird species by restoring the composition, structure, and fine-scale habitat patchiness, including snags, logs, and woody debris, that typified ponderosa pine and mixed-conifer forests before fire suppression (Carey and Harrington 2001, Covington and Moore 1994, Kennedy and Fontaine 2009,
Kalies et al. 2012, Larson and Churchill 2012, Reynolds et al. 2013). These and other studies have shown that tree squirrels, rabbits, turkeys, and grouse respond favorably to habitat patchiness and diversity (tree, shrub, and grass / forb cover) created by low-severity ground fires (Allen et al. 1982, Schroeder 1984, Reynolds et al. 1992, Kalies et al. 2012). Chipmunks in this study were not affected by fire at any intensity level; suggesting that they may be capable of utilizing a wide range of habitats. Because chipmunks and red squirrels abundances were unaffected by low-severity fire, and were similar to abundances in unburned forests, restoration of vegetation composition and pattern with regular low-severity ground fire could have both short and long-term benefits for bird and mammal communities in mixed-conifer and ponderosa pine forests on the Kaibab Plateau, while causing minimal impact on some species.
Post-fire increases in large diameter fire-killed snags and canopy cover reduction benefit
most woodpecker species and other birds that occupy more open forests (Murphy and
Lehnhausen 1998, Jackson et al. 2002, Bock and Block 2005, Saab et al. 2009). In this study,
modeled woodpecker species responded positively to high-severity fire. The abundance of
northern flickers, a cavity nester, was associated with decreased canopy cover; a response that
was not unexpected because this woodpecker forages in openings associated with both burned
and unburned open canopied forests (Kotliar et al 2007). Large snags provide suitable nesting
habitats and an abundant food resources for woodpeckers and other cavity-nesting and
bark-gleaning species (Saab and Vierling 2001, Saab et al. 2005), but at least for bark-bark-gleaning
species the flush of sub-bark insects can be short-lived. Indeed, Bock and Block (2005) reported
that hairy woodpecker home ranges varied by season and fire severity. Wintering foraging
ranges were smaller two years fire, when food supplies were abundant, than six years
post-fire. Northern flickers followed a similar pattern. Over time, as food supplies diminishes,
woodpeckers traveled longer distances to find food, eventually dispersing away from burned
areas. Thus, the beneficial effects of high-severity fire for species in the woodpecker guild can
be short-lived, especially relative to the length time required for the forest to regrow and for food
supplies and cavity-nesting opportunities to replenish.
The effects of low-severity fire on bird abundance were mixed. Of the four bird species I
was able to model; hairy woodpecker and northern flickers were the only species to show a
distinctly positive relationship to high- (and low-: hairy woodpeckers) severity fire. American
robins and Steller’s jay’s abundances were similar in burned and unburned forests in this study.
Many of the birds and mammals that I surveyed are habitat generalists, a behavioral
strategy allowing them to occupy a variety of habitats. For example, ground cover was an
important predictor of robin abundance whereas fire severity had no effect. While other studies
have shown that robins can respond positively to post-fire vegetative growth and species
composition (Sackett and Haase 1998, Kotliar et al 2007, George and Zack 2008), robin
abundance estimates in my study area were similar across burn severities, despite fire severity.
While vegetative re-growth in newly opened areas following high-severity fire may contribute to
the abundance of robins, grass, forb, and shrub openings found throughout ponderosa pine and
mixed-conifer forests in my study also provide foraging opportunities in unburned areas as well.
The cavity excavating northern flicker that forages in grassy open-canopied forests (Saab and
Vierling 2001, Saab et al. 2005, Kotliar et al. 2007, Wiebe et al. 2008), was also uniformly
abundant across the fire strata in my study. Canopy openings and increased ground vegetation (a
covariate found in a competing model) were both important predictors of flicker abundance,
suggesting co-linearity between these two covariates. The Steller’s jay, a habitat and foraging
generalists with a diverse omnivorous diet (Greene et al. 1998), was equally abundant across
burn severities and forest types in my study. Other studies examining the effects of fire on
Steller’s jays and American robins showed both positive and inconclusive responses to post-fire
habitat changes due to fire severity as well (Bock and Block 2005, Kotliar et al. 2007, Dickson et
al. 2009).
Of the seven birds and mammals I modeled, all but red squirrels and golden mantled
ground squirrels demonstrated adaptable use of habitat conditions-- including conditions
resulting from forest type and fire severity. The high number of species included in this study
that were habitat generalists contributed to the difficulty of identifying effects of fire severity on
the bird and mammal communities in ponderosa pine and mixed-conifer forests. By competing
models that included habitat covariates specific to each species, I hoped to explore the
relationship between fire, habitat change, and abundance of each species. What I did not
consider in this study was the effects of past forest management on the predictive models.
During the past century, nearly the entire North Kaibab Ranger District received single tree
harvests. In the 1960s through 1990 more intensive management was introduced including small
< 4ha clearcuts and 12-16 ha shelterwood/seed tree harvests (Sesnie and Bailey 2003). I
attempted to establish a sample of transects in the three burn/no burn categories in order to
equally sample the most ubiquitous past tree harvesting prescriptions, single-tree and seed-tree,
on the North Kaibab Ranger District. Unfortunately, due to the specific location of the Warm
Fire, several burn severity areas did not contain equal areas of these management prescriptions
suitable for situating transects; achieving a balance of management prescription by forest type
was not possible. Given the differences in tree densities in single-tree harvested areas versus
seed-tree harvested areas, one might expect some corresponding differences in bird and mammal
abundances in the two treatments. The extent to which treating the two prescriptions as one on
my final abundance estimates is unknown without further examination.
CONCLUSIONS
Fire is the most important natural disturbance in southwestern pine and mixed-conifer
forests (Covington and Moore 1994,
Fulé et al. 1997). Frequent, low-severity surface fire was
part of the evolutionary history of ponderosa pine and lower elevation dry mixed-conifer forests
(Savage and Swetnam 1990, Kalies et al. 2012, Larson and Churchill 2012, Reynolds et al. 2013)
and high-severity crown fires seldom occurred and was confined to small patches (Pyne 1996).
Frequent low severity surface fire in these forest types maintained an open grass-forb-shrub
matrix and a spatial pattern of trees aggregated into clumps, groups, and patches, with scattered
individual trees (White 1985, Cooper 1961, Larson and Chruchill 2012, Reynolds, et al. 2013).
Both the tree species composition (fire-tolerant and shade-intolerant trees) and spatial pattern
resulted from a feed-back between fire and vegetation. Frequent surface fire resulted in a
characteristic composition and structure that in turn supported a low severity, surface fire regime
(Larson and Churchill 2012). This historical composition and structure manifested in a
fine-scale (<4ha), highly interspersed mix of habitats (grass-forb-shrub vegetation), dense groups of
trees with interlocking crowns, snags, logs, and woody debris; (Reynolds et al. 2013) that
supported a variety of bird and mammal species (rabbits, ground squirrels, grouse, turkeys, and
tree squirrels).
In my study, each of the seven species (four birds, three mammals) with sufficient
numbers of detections to model responded to fire or lack of fire in a variety of ways.
Low-severity fire was significantly detrimental to only golden-mantled ground squirrels while three of
the seven species (chipmunks, robin, and Steller’s jays) showed no difference in abundance
across the three burn strata. Furthermore, two species (red squirrel and golden-mantled ground
squirrel) showed negative responses to high-severity fire while two other species (hairy
woodpeckers, northern flickers) showed a positive response to high-severity fire. This summary
of responses suggested that high-severity fire on the North Kaibab Ranger District could be more
detrimental to the larger suite of important goshawk prey than low-severity burn. Similar finding
have been summarized in a literature review of the overall bird community response to
severity fire in ponderosa pine forests, where only two species responded positively to
high-severity, four species responded positively to moderate-severity fire, and 9 bird species
responded negatively to high-severity fire (Bock and Block 2005). Other studies of low-severity
fire, including prescribed fire, reported either few changes in cavity-nesting bird abundance
(Horton and Mannan 1988) or declines in species common in areas with heavy forest cover,
where birds favored more open forest conditions (Marshall 1963).
While knowledge of the effects of low-severity fire on birds and mammals in ponderosa
pine and mixed-conifer is increasing, more information is needed to provide robust management
recommendations (Bock and Block 2005). Nonetheless, during the last century vegetative
species composition and structure in southwestern forests has changed to fire intolerant and
shade tolerant tree species where forest openings are overgrown (Cooper 1960, Covington and
Moore 1994). Heavy accumulations of ground and ladder fuels, and increased frequencies and
sizes of stand-replacement fires also characterize these forests (Cooper 1960, Covington and
Moore 1994). Grass-forb-shrub vegetation productivity, biodiversity, and bird and mammal
habitats have also declined due to tree shading and increased habitat homogeneity (Kalies et al.
2012, Reynolds et al. 2013). In response, there is a demand for recommendations to restore the
historical species compositions, structures, and fine-scale spatial patterns, which facilitate the
return of low-severity fire regimes and habitat heterogeneity that characterized the evolutionary
environment of native plants and animals in these forests (Larson and Chuchill 2012). While my
ability to estimate abundances was limited by species detectability, to a small sample of the suite
of species in Kaibab goshawk diets, low-severity fire was found to benefit or have a neutral
impact on many of species in this study. Restoration of a fine-scale mix of habitats (small tree
groups interspersed within a grass-forb-shrub matrix, snags, and logs) are needed to support
populations of the majority of bird and mammals important to many food webs.
Table 1. Transect classification by forest type and fire severity. Unburned Sub-total Burned Sub-total Grand Total n=60 Forest Type Pine n=23 Mixed Conifer n=17 n=40 Pine n=7 Mixed Conifer n=13 n=20
Fire Severity High
n=3 Low n=4 High n=9 Low n=4
Table 2. Pre- and Post-fire transect classification.
No. Transects 60 pre-existing 11 established post-fire
Grand Total n=60
Burn Status Unburned Burned Burned
No. Transects n=51 n=9 n=11
Selected for sampling n=40 n=9 n=11
Fire Severity High
n=9
High n=3
Low n=8
Table 3. Prey species abundance related to habitat and fire severity. American Robin
Model K AIC ΔAIC Wt
Year + Forest Type + Ground Cover 8 1901.71 0.00 0.98
Year + Ground Cover 7 1910.17 8.46 0.01
Year + Forest Type 7 1913.30 11.59 0.00
Year + Severity + Forest Type 9 1915.15 13.44 0.00
Year + Severity 8 1921.83 20.12 0.00
Year + Snag Density (>20 cm dbh) 7 1924.73 23.03 0.00
Year 6 1925.94 24.23 0.00
Year + Tree Density 7 1927.31 25.60 0.00
Year + Tree Density (>20 cm dbh) 7 1927.47 25.76 0.00
Null 4 1936.11 34.41 0.00
Chipmunks
Model K AIC ΔAIC Wt
Year + Forest Type + Ground Cover 8 1774.36 0.00 0.56
Year + Forest Type 7 1775.71 1.34 0.28
Year + Severity + Forest Type 9 1779.00 4.63 0.05 Year + Tree Density (>20 cm dbh) 7 1779.18 4.81 0.05 Year + Snag Density (>20 cm dbh) 7 1780.23 5.87 0.03
Year + Canopy Cover 7 1781.53 7.16 0.02
Year + Ground Cover 7 1784.31 9.95 0.00
Year 6 1785.37 11.00 0.00
Year + Severity 8 1785.54 11.18 0.00
Year + Cones 7 1787.21 12.85 0.00
Null 4 1788.65 14.29 0.00
Model rankings were based upon Akaike’s Information Criteria (AIC), AIC difference (ΔAIC), and Akaike’s model weight (Wt). Only 2008 – 2010 data could be included in the predictive models and evaluated using AIC.
Table 3 (continue). Prey species abundance related to habitat and fire severity. Golden-mantled Ground Squirrel
Model K AIC ΔAIC Wt
Year + Severity + Forest Type 9 1449.19 0.00 0.64 Year + Forest Type + Ground Cover 8 1450.72 1.53 0.30
Year + Forest Type 7 1454.09 4.90 0.06
Year + Severity 8 1465.20 16.01 0.00
Year + Tree Density (>20 cm dbh) 7 1468.38 19.19 0.00
Year + Canopy Cover 7 1469.00 19.82 0.00
Year + Ground Cover 7 1473.23 24.05 0.00
Year 6 1476.62 27.43 0.00
Year + Cones 7 1478.40 29.21 0.00
Null 4 1485.88 36.69 0.00
Hairy Woodpecker
Model K AIC ΔAIC Wt
Year + Severity + Forest Type 9 1683.01 0.00 0.51
Year + Severity 8 1683.12 0.11 0.49
Year + Snag Density (>20 cm dbh) 7 1704.34 21.33 0.00
Year + Tree Density 7 1711.38 28.37 0.00
Year + Tree Density (>20 cm dbh) 7 1713.96 30.95 0.00
Year + Canopy Cover 7 1714.21 31.20 0.00
Year 6 1715.41 32.40 0.00
Year + Forest Type 7 1716.92 33.91 0.00
Null 4 1739.45 56.44 0.00
Model rankings were based upon Akaike’s Information Criteria (AIC), AIC difference (ΔAIC), Akaike’s model weight (Wt). Only 2008 – 2010 data could be included in the predictive models and evaluated using AIC.
Table 3 (continue). Prey species abundance related to habitat and fire severity. Northern Flicker
Model K AIC ΔAIC Wt
Year + Canopy Cover 7 3886.02 0.00 0.44
Year + Ground Cover 7 3886.96 0.94 0.27
Year + Forest Type + Ground Cover 8 3887.87 1.85 0.17 Year + Tree Density (>20 cm dbh) 7 3889.46 3.44 0.08
Year + Severity 8 3892.02 6.00 0.02
Year + Severity + Forest Type 9 3893.97 7.95 0.01 Year + Snag Density (>20 cm dbh) 7 3895.66 9.64 0.00
Year 6 3896.28 10.26 0.00
Year + Forest Type 7 3897.14 11.12 0.00
Null 4 3910.16 24.14 0.00
Red Squirrel
Model K AIC ΔAIC Wt
Year + Severity + Forest Type 9 1744.94 0.00 1.00 Year + Tree Density (>20 cm dbh) 7 1757.62 12.69 0.00
Year + Canopy Cover 7 1767.14 22.20 0.00
Year + Severity 8 1769.29 24.35 0.00
Year + Forest Type 7 1770.19 25.25 0.00
Year + Forest Type + Ground Cover 8 1772.08 27.14 0.00
Year + Cones 7 1778.40 33.46 0.00
Year 6 1780.56 35.62 0.00
Year + Snag Density (>20 cm dbh) 7 1782.07 37.13 0.00
Year + Ground Cover 7 1782.27 37.33 0.00
Null 4 1795.42 50.48 0.00
Model rankings were based upon Akaike’s Information Criteria (AIC), AIC difference (ΔAIC), Akaike’s model weight (Wt). Only 2008 – 2010 data could be included in the predictive models and evaluated using AIC.
Table 3 (continue). Prey species abundance related to habitat and fire severity. Steller’s Jay
Model K AIC ΔAIC Wt
Year + Forest Type 7 1577.72 0.00 0.23
Null 4 1577.95 0.22 0.20
Year 6 1578.70 0.98 0.14
Year + Forest Type + Ground Cover 8 1579.60 1.88 0.09 Year + Tree Density (>20 cm dbh) 7 1579.80 2.07 0.08
Year + Cones 7 1580.51 2.79 0.06
Year + Ground Cover 7 1580.66 2.94 0.05
Year + Tree Density 7 1580.67 2.94 0.05
Year + Severity 8 1580.95 3.23 0.05
Year + Severity + Forest Type 9 1581.14 3.42 0.04
Woodpecker Guild
Model K AIC ΔAIC Wt
Year + Severity 8 2028.77 0.00 0.72
Year + Severity + Forest Type 9 2030.66 1.89 0.28 Year + Snag Density (>20 cm dbh) 7 2048.31 19.54 0.00
Year + Tree Density 7 2057.74 28.97 0.00
Year + Canopy Cover 7 2059.48 30.71 0.00
Year + Tree Density (>20 cm dbh) 7 2059.92 31.15 0.00
Year 6 2060.03 31.26 0.00
Year + Forest Type 7 2061.07 32.30 0.00
Null 4 2083.04 54.27 0.00
Model rankings were based upon Akaike’s Information Criteria (AIC), AIC difference (ΔAIC), Akaike’s model weight (Wt). Only 2008 – 2010 data could be included in the predictive models and evaluated using AIC.