UPTEC ES 19032
Examensarbete 30 hp
Oktober 2019
Potential of V2G in a Rural
Low-Voltage Grid on Gotland for
Voltage and Power Capacity Control
Christoffer Aalhuizen
Teknisk- naturvetenskaplig fakultet UTH-enheten Besöksadress: Ångströmlaboratoriet Lägerhyddsvägen 1 Hus 4, Plan 0 Postadress: Box 536 751 21 Uppsala Telefon: 018 – 471 30 03 Telefax: 018 – 471 30 00 Hemsida: http://www.teknat.uu.se/student
Abstract
Potential of V2G in a Rural Low-Voltage Grid on
Gotland for Voltage and Power Capacity Control
Christoffer Aalhuizen
The Swedish transportation sector needs to undergo major changes in order to achieve the established goals for climate and environment. The largest change is the replacement of fossil-fuelled vehicles to vehicles propelled by renewable energy sources, such as biofuels and electricity. To account for an increase in local electric power consumption, the electric power infrastructure of Sweden needs to adapt through expansion and reconstruction of the electric power grid. However, changes in infrastructure are usually expensive. It is therefore suitable to also examine alternative solutions, which could potentially be more cost efficient. One of these solutions are vehicle-to-grid (V2G), where electric vehicles acts as local electric power control and provides auxiliary services to the electric power grid. This thesis is a case study of a part of a low-voltage electric power grid on Gotland, with the goal of analysing the potential of V2G in the investigated area. The study focused on utilizing V2G for balancing electric power consumption and generation, and for adjusting voltage levels. Simulations of the area were executed in PSS®E for three different cases; one high-load case, low-load case and average-load case. It was found that by utilizing V2G a ramp up of electric power during mornings was delayed by approximately one hour, making the electric power grid potentially more compatible with photovoltaics (PV). However, the overall effects from V2G was fairly low. This outcome can partly be explained by the assumptions made in the report, and also due to some odd behaviour of the system model.
ISSN: 1650-8300, UPTEC ES 19032 Examinator: Petra Jönsson
Ämnesgranskare: Johan Abrahamsson Handledare: Colin Stewart, Ying He
Populärvetenskaplig sammanfattning
Skulle du ge tillbaka el till elnätet från din elbil vid ett stort elbehov på elnätet? Samhället och många av dess stora system är i en pågående förändring för att kunna klara uppsatta mål för miljö och klimat. I samband med denna förändring pågår även en ökad urbanisering, där fler invånare väljer att flytta från mindre orter till större städer och dess förorter. En ökning av invånare i en stad leder i sin tur till att elbehovet ökar. Samtidigt kan kablar och transmissionsledare bara som högst leverera den effekt de designats för, annars tar de skada och kan gå sönder. I samband med ökad urbanisering och en utbyggnad av energikällor med mycket varierande effektuttag, som vindkraft och solenergi, kan det uppstå flaskhalsar i det svenska elnätet. För att förebygga mot dessa flaskhalsar utvecklas elnätet med fler förbindelser eller förstärkningar av nuvarande elledare.
En plats som idag är sårbar för störningar i det svenska elnätet är Gotland. På Gotland finns förvisso en ansenlig mängd vindkraft installerad, dock förses Gotland i huvudsak utav el från fastlandet. Elen till Gotland transporteras via två kablar mellan fastlandet och ön. Detta gör Gotland sårbar i händelse av störningar på någon av dessa kablar, alternativt om ön kräver mer el än vad kablarna kan överföra. För att förbättra elnätets pålitlighet och stabilitet gentemot störningar skulle Gotland behöva fler förbindelser till fastlandet, alternativt en reglerande elförsörjning på ön. Dessa typer av investeringar är dock mycket kostsamma, och kan vara svåra att få ekonomiskt försvarbara.
Detta projekt har därför i samband med Vattenfall AB undersökt en alternativ lösning för hur elnätet skulle kunna stabiliseras, nämligen genom att använda outnyttjad kapacitet i batteridrivna elbilar. Konceptet att låta elbilar föra tillbaka el till elnätet brukar kallas för ”vehicle to grid” (V2G), på svenska ”fordon till nät”. Genom att låta elbilar ladda ur sig mot elnätet när det är ett stort tillfälligt elbehov, och sedan laddas upp igen när behovet minskat, skulle Gotland kunna få tillgång till en reglerande elkraft som potentiellt varken kräver stora ändringar av infrastruktur eller är kostsamt relativt andra lösningar. I dagsläget har Gotland bara har två elanslutningar till fastlandet, och kan därför ses som ett separat elnät, vilket gör ön utmärkt för att studera effekter från olika elnätsrelaterade lösningar. Detta projekt har därför handlat om att undersöka hur en del av Gotlands elnät skulle påverkas om V2G utnyttjades för att stabilisera elnätet.
I projektet skapades en modell av en del av Gotlands lågspänningsnät, den spänningsnivå på 400 V som alla hushåll är kopplade till, som användes för att simulera hur effekt och spänning förändrades i systemet. Simuleringarna utfördes i PSS®E, en programvara där elnätsmodeller kan skapas och simuleras. Totalt simulerades tre fall, som representerades av dygn då elbehovet var högt, lågt och normalt. För att effektivisera arbetet byggdes en kod via kodspråket Python. Slutsatserna dragna från resultatet var att det fanns indikationer att V2G inte hade någon markant effekt på elnätet. Genom V2G kunde områdets elbehov under morgonen förskjutas fram någon timme, samt ge upphov till en jämnare lastprofil. Det gjordes dock vissa förenklingar under arbetets gång som förmodligen påverkat resultatet, och dessutom förekom vissa märkliga beteenden i modellen. Vidare saknades även material för att kunna validera resultaten. För att kunna säkerställa resultaten från studien skulle modellen behöva bearbetas ytterligare, samt jämföras noggrannare med det verkliga systemet.
Executive summary
This master thesis study has investigated the potential effects on voltage levels and strain, in terms of power capacity of conductors, on a low-voltage power grid of Gotland when V2G (Vehicle-to-grid) was implemented.
In the study the following assumptions were made:
• All EVs (Electric vehicles) in this study were BEVs (Battery electric vehicles)
• These BEVs did only charge or utilize V2G from an EVSE (Electric vehicle supply equipment) at their respective household.
• A smart grid on Gotland able to incorporate V2G functionality was available.
• All cars used the same type of charge station for V2G and charge services, which could deliver a power output of 3,6 kW.
• All chargers could only turn on or off for charge or V2G utilization.
• The residents would have the same power consumption during the following decades as presently.
• EV distribution was fairly evenly distributed on the island where each load in the system model had one BEV connected, unless it created simulations errors at certain loads.
• People mostly use their cars for getting to and from work (7:30-8:00 and 17:00-17:30). • Everyone used their vehicles and were in need for charging simultaneously.
A model was created and simulated in PSS®E for three cases, where the cases represented days when the loads were high, low or on an average level respectively. The main findings of the report were that the voltage levels were barely changed due to V2G utilization, and that V2G was able to delay the power demand during mornings by approximately one hour. In addition, the load profile for each case became flatter when the BEVs were integrated and were allowed for V2G utilization.
The results lack validation and there are known errors in the system model. In order to verify the conclusions, these errors need to be solved, and the results need to be more accurately compared to the real system on Gotland.
Acknowledgements
This master thesis has been the final step in my degree in Master of Science in Energy Systems at Uppsala University and the Swedish University of Agricultural Science. The thesis project was made in cooperation with Uppsala University, Vattenfall AB and Gotlands Energi AB. First I would like to thank my supervisors at Vattenfall AB, Colin Stewart and Ying He, for their expertise and help in planning the project, and for their trust in me during the duration of the project. In addition, a special thanks to Julio Gadea at Gotlands Energy AB for providing me with necessary data.
I would also like to thank my supervisor at Uppsala University, Johan Abrahamsson, for his guidance and reflections on how to improve the quality of the thesis project.
Finally, I would like to thank family and friends, especially my dear girlfriend, for their love and support during my years of education.
Christoffer Aalhuizen Uppsala 2019
Table of Contents
1.Introduction ... 1
1.1. Purpose of the study ... 3
1.2. Discussion about source material ... 3
2. Background ... 4
2.1. Electric power systems basics ... 4
2.2. System investigated on Gotland ... 5
2.3. Definition of power quality in the electric power system. ... 6
2.4 Electric power consumption of a regular household in Sweden. ... 6
2.5. Load profiles of household loads on Gotland ... 7
2.6. Electric vehicles (EVs) ... 8
2.7. V2G and BEV charging ... 9
2.8. Why electro-mobility? ... 10
2.9. Challenges brought by electro-mobility ... 10
2.10. Driving habits ... 11
3. Method ... 12
3.1. Scope and assumptions ... 12
3.2 Setting up cases ... 15
3.3. Input data to PSS®E simulation model ... 16
3.4. Creating a complementary python-script. ... 18
3.5. Output data ... 19
3.6. Simulation models ... 19
4. Results and Discussion ... 22
4.1. Utilization of EVs during a day ... 22
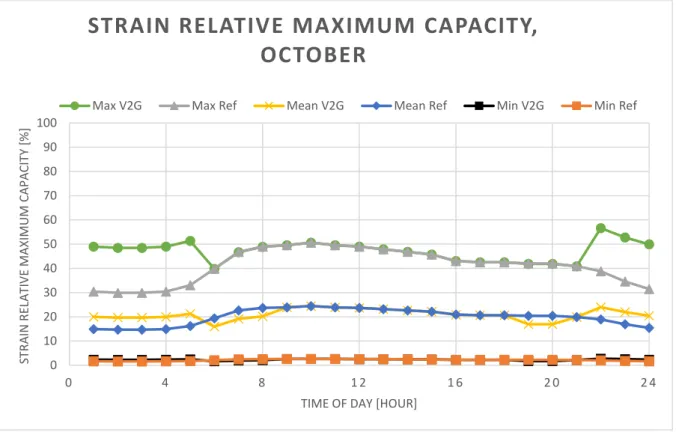
4.2. Strain relative maximum capacity of the conductors ... 24
4.3. Impact on Voltage ... 28
4.4. How well does the model fit the true system?... 31
4.5. Future potential projects and model improvements ... 32
5. Conclusions ... 33
Appendices
Appendix A – Diagram of the investigated low-voltage power grid ………...36
Appendix B – Active power consumption for a day in January, May and October for the investigated area on Gotland……….…………...37
Appendix C – Script for finding days that would represent each case………...38
Appendix D – Hourly energy consumption of Gotland 2015/2016………41
Appendix E – Estimated power ratings of cable types………..42
Appendix F – Script for simulations and PSSE/MS Excel interactions……….43
Appendix G – Output values from simulations………..51
1
1.Introduction
The modern society is changing to become a civilization with less negative impact on planet Earth. In 2015 the UNFCCC (United Nations Framework Convention on Climate Change) declared the Paris Climate Agreement, in which countries of the UNFCCC were to cooperate in order to limit the rise of the global temperature to below 2 degrees Celsius [1]. Presently nearly every nation has ratified the agreement, and the country of Sweden is no exception. In order to reach the asserted goals of not only the Paris Climate Agreement, but also from goals regarding climate change on a nation-wide level, the Swedish society and infrastructure needs to change. As an example, Sweden as a nation has declared its intention to become a net-zero emission society by 2045 [2]. Multiple actions are necessary in order to reach this goal. One sector of the Swedish infrastructure which will have to undergo major changes, in order to reach these climate goals, is the transportation system. Fossil fuels such as petrol and diesel are presently the most dominant fuels for transportation, resulting in large amounts of carbon dioxide emissions from the transportation sector [3]. The domestic transportation alone stands for approximately one third of the total amount of the Swedish annual carbon dioxide emissions, where more than 90% are due to the use of fossil fuelled vehicles [4].
The need for transportation is apparent in the Swedish society. Between the years 2010 and 2017 the number of vehicles registered in Sweden increased from 4.3 million to 4.8 million private cars, an increase of approximately 12 percent [5]. In comparison, during the same time period the Swedish population increased by approximately 7.5 percent [6]. The number of private cars per capita has not decreased during the recent decade but rather increased. If the trend of an increase in private cars per capita continues in Sweden, and all these vehicles are propelled by fossil fuels, the goal set up regarding CO2-emissions will be unreachable. This highlights the importance of replacing fossil fuels in the transportation sector with more climate neutral fuels, such as biofuels or electricity generated through energy sources with low CO2 emissions.
Another sector that also must undergo major changes is the electric power system of Sweden. These changes are however not to reduce carbon emissions, as with the changes in the transportation sector, but rather due to a potential increase of electric power consumption. According to a report from 2016 by IVA, the electric power utilization of Sweden is estimated to be somewhat similar to present values [7]. The overall use of electric power in Sweden is expected to increase due to more power demanding technology such as electric vehicles, yet this increase is estimated to be somewhat cancelled out by energy efficient innovations [7]. However, most of the electric power of Sweden is generated in the northern parts of the country, while most of the power is consumed in the southern parts of the country [8]. That means large quantities of electric power needs to be transported in order to satisfy the demand for electric power. If the power consumption were to increase in the upcoming decades, some electric grid components may not be able to transport the required power. For example, conductors and transformers cannot transport more power than they are designed for, which would result in them overloading and become damaged. These limitations create bottlenecks in the electric power grid where alternative routes for power distribution are sparse.
2
One area which already is affected by bottle-neck effects is the Swedish island Gotland, since there are only two HVDC cables connecting Gotland and the mainland. Gotland also primarily produces energy from wind power, which results in quite a volatile power production. These conditions of bottle-necks in power distribution and volatile power generation may lead to an unbalanced power system, where electric power generation and consumption becomes harder to match. For the time being the only major way of balancing the grid of Gotland is by the power connection to the mainland. There are ongoing projects to increase the stability of the power grid of Gotland, there has for example been a project regarding adding an additional cable which connects Gotland to the mainland of Sweden. However, the project was stopped in 2017 due to financial reasons [9]. If no additional connection between the mainland and Gotland is established, other types of power control technology would be necessary to improve the power quality and stability of the electric power grid on Gotland. One alternative could be to buffer electricity through energy storage solutions.
Today there are mainly two technical solutions for storing large amount of electricity for long durations. The first most conventional method is by constructing water dams and utilizing hydro power, where the water is converted from potential energy into kinetic energy [10]. By installing a turbine in the flow of water, which in turn rotates a generator, the momentum will be converted into electrical power [10]. In 2015, approximately 47 percent of the annual electricity production in Sweden was generated through hydro power [11]. Hydropower is usually utilized where large amounts of water flows, such as rivers, but dams may also be built for reasons such as pumped hydro for later electric power utilization. One issue of building new dams are negative impacts on the environment of the site where it is constructed [12]. The second and more recent method for storing electrical power is through the usage of large battery banks. An electric battery can shortly be described as electrons being pushed into a state with higher potential, which is the charging process, and return to its initial phase during discharge. Battery banks usually has an efficiency of approximately 80% and 90% and is a storage system which does not require many additional components except the battery banks. However, batteries are today a quite expensive solution for storing electricity, and in many cases the benefits are not justifying the costs of investing in a large bank of batteries. Alternative electrical storage methods are tested in order to find more cost-efficient solutions. One of these new methods, which is currently in a piloting stage, is to store electricity in the batteries of electric vehicles (EVs) for later use.
When the grid is in need of more electrical power for stabilization, EVs which at that time are connected to the grid may support the demand of extra electric power. When the grid has re-stabilized, the EVs may utilize the grid for charging instead of providing the grid with power. The concept of allowing EVs to provide auxiliary services to an electric power grid, such as voltage regulation or for balancing power flows, is called vehicle-to-grid (V2G). Several large vehicle companies, for example Mitsubishi Motors, PSA Group and Nissan, have started pilot-tests for V2G, called the Parker Projects [13]. There have also been previous projects regarding V2G, such as the Edison project in Denmark [14] and a research project in California [15]. In addition, Vattenfall is involved in surveillance of V2G applications through developing
3
communication signals and protocols for implementation, and industry research work together with the Swedish Electromobility Centre (SEC) in this area.
Since the society is pushing for a transportation system with vehicles that operate on renewable fuels, a significant share of all vehicles on Gotland will likely be EVs or bio fuelled vehicles in a few decades. If these EVs can be utilized for V2G, the grid of Gotland can look to acquire a level of power control without making major changes in infrastructure. The grid of Gotland will gain a decentralized battery bank that can handle immediate local grid issues. However, the potential benefits from using V2G are somewhat unclear. In addition, the utilization of EVs owned by the residents of Gotland may affect their flexibility for transportation. It is therefore necessary to examine the effects on the grid of Gotland in terms of strain and voltage levels when V2G is utilized, and to study how V2G may affect the transport flexibility of the residents of Gotland.
1.1. Purpose of the study
The purpose of this study is to examine and estimate the effects of utilizing V2G for stabilizing purposes on the low-voltage power grid of Gotland. The effects that are investigated are the strain on conductors in terms of their maximum power capacity and voltage levels in the system. This is done by simulating the power grid of a rural area on Gotland and observe any effects when V2G is utilized in the investigated area. In addition, an estimation of how EVs can be utilized during a day for either transportation or V2G is presented.
1.2. Discussion about source material
As with any scientific study, this study is based upon the work of earlier studies. The material deemed necessary for the project has primarily been collected by reading scientific articles and recent projects regarding relations and auxiliary services between EVs and an electric power grid.
The effects of how EVs and an electric power system may cooperate are presently not completely determined, and the topic can be considered controversial. The positive aspects are usually generally described, yet rarely quantified. There are also challenges in terms of power which are derived from a large amount of EVs in an area. To increase the transparency and objectivity for the reader, the project has tried to include reliable sources for both the positive and negative aspects of EVs and their use as auxiliary services for an electric power grid. However, it has been easier to obtain sources for projects supporting EVs for auxiliary services rather than questioning it’s potential. Therefore, the report also includes more sources which support V2G and smart grid solutions.
Due to this bias in sources, the results from earlier studies and projects have been handled with care. In general, the trends and general effects of the results can be considered reliable, while the magnitude of the effects can be doubtful. The earlier studies have also mostly been used for finding data and theory regarding electric power systems and information about technical components in a V2G power system, rather than the actual effects of the V2G in a system.
4
2. Background
To have a better understanding and rewarding reflection of the content in the report, the reader needs some general knowledge about EVs, V2G, Gotland and power grid design. For example, it is good to know the general difference between EVs and conventional cars, and the benefits and downsides EVs have today. The reader also needs some background information about Gotland to understand how the society on the island functions. Therefore, a brief explanation of these topics will be presented in this section. The first part will be a presentation of how electric power grids are designed and affected by several factors. There is also a brief explanation of how the quality of a power grid is measured and what defines a smart grid. Secondly, information regarding the definitions of EVs and their benefits and drawbacks are presented. Lastly, a short general description of Gotland, the investigated area, and the driving habits of people are presented.
2.1. Electric power systems basics
A basic power system consists of three components. The first component is the load, which demand a certain amount of power to be utilized for a designated purpose. The second component is the generator, the component that generates electric power. The third component is a branch conductor that connects the generator and load to each other, thus creating a basic electric power system. The electric power systems can either have an alternating current (AC) or direct current (DC), and the electric power transported in the system is calculated using equation 1.
𝑆 = 𝑈 ∙ 𝐼∗ (1)
𝑆 is the complex power, 𝑈 the voltage over the conductor and 𝐼∗ the conjugate of the current
passing through the conductor. The components of a system would ideally transport electric power without any losses, yet in practice this is seldom the case. For instance, conductors have active power losses due to resistivity as seen in equation 2.
𝑃𝑙𝑜𝑠𝑠 = 𝑅 ∙ 𝐼2 (2)
𝑃𝑙𝑜𝑠𝑠 is the active power losses and 𝑅 the resistance of the conductor. As can be seen in equation 2, the current 𝐼 is squared, which means it has a significant impact on the active power losses. In order to reduce the power losses, it is desirable to minimize the current, especially during long transportation distances. However, lowering the current will according to equation 1 also reduce the delivered complex power. If the complex power is to remain the same the voltage must increase.
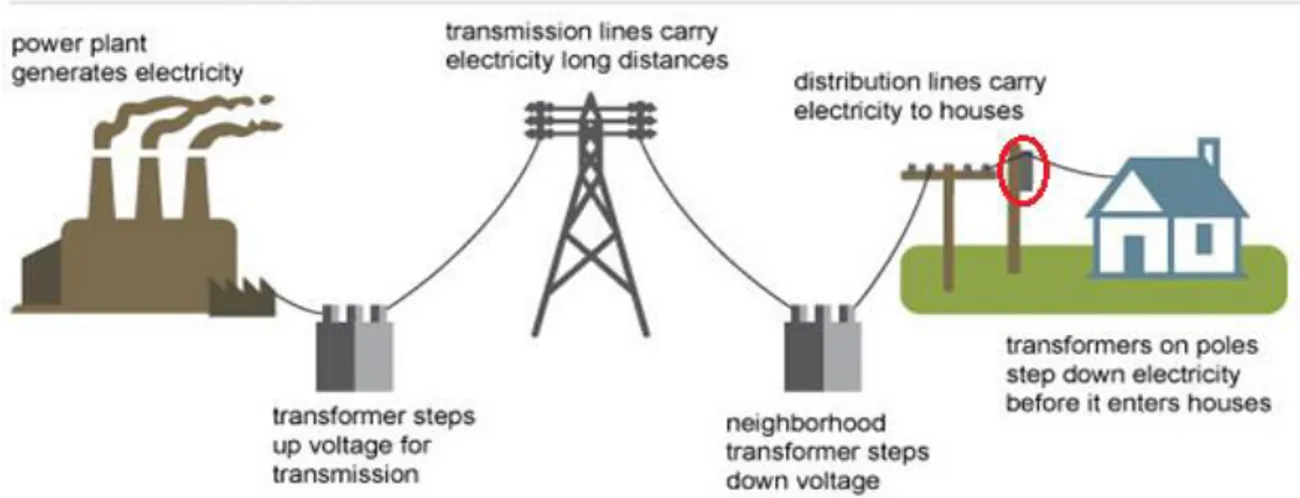
An increase in voltage is done by a fourth type of component called transformers. A transformer is usually placed close to power plants in order to increase the voltage, and thereby minimizing the active power losses. The electricity is transported along a high-voltage transmission grid until it reaches a high/medium-voltage transformer. There, the voltage is lowered and transported along the distribution grid. The voltage is usually lowered once more to 400 V when the power is close to the end loads, such as one or multiple household. The power flowing through these last-mentioned transformers are what the loads in the system model are representing, since every load can consist of multiple households. A diagram presenting how an electric power system with generators, conductors, loads and transformers are connected to
5
one another is shown in Figure 1. The low-voltage transformer represented as loads in the system model have been marked in Figure 1 with a red circle.
Figure 1. An illustrative diagram of how generators, conductors, loads and transformers are connected to each other in an electric power system. In addition, the low-voltage transformer which is represented by a load in the system has been marked with a circle. The diagram is a modified version of a diagram made by EIA (U.S. Energy Information Administration) [16].
2.2. System investigated on Gotland
Gotland is a Swedish island located approximately 100 km (kilometres) from the mainland of Sweden. The island has an area of 3000 km2 (square kilometres). The distance between the northernmost and southernmost point of Gotland is approximately 176 km, and 50 km between its most eastern and western points. The total amount of private cars on Gotland at the end of 2017 was about 36 000 vehicles, which is approximately 600 cars for each 1000 citizen on Gotland [5].
The power system which was examined in the project was a rural area mainly consisting of household loads. All information regarding the system was obtained from GEAB, a daughter company of Vattenfall AB which owns the electric distribution grid on Gotland. The area was located in the eastern parts of Visby, the largest urban area of Gotland. The system consisted of a low voltage grid, 400 V, which was connected to the 11-kV distribution grid of Gotland through a transformer. A diagram of the system is presented in Appendix A. The system contained approximately 150 loads, yet most of these loads had a significantly larger average power consumption than a regular household has. A regular Swedish household has an annual electricity consumption of approximately 25 000 kWh [17,18], which corresponds to an average power consumption of approximately 3 kW. Most loads in the system had an average power consumption much larger than 3 kW. This indicated that multiple household were tied together into one load, meaning a load likely represented a local distribution feeder rather than an individual household. Based on mentioned average power consumption of a household, the number of households connected to the investigated system was estimated to approximately 600 households.
6
2.3. Definition of power quality in the electric power system.
In order to measure how well an electric power system performs it is important to first determine what defines a well-performing power system. The purpose of an electric distribution power system is to provide its consumers with the right amount of electric power, at the right time, without major losses and without compromising electrical components connected to the system. If a power system is performing perfectly, it will always balance the electric power supply and demand and keep the voltage level of the grid at nominal voltage. In practice this is a difficult task because the power system has undesirable behaviours and losses, for example the power losses explained in section 2.1. Therefore, regulation standards for different disturbances are used to ensure a sufficient level of grid stability. One of these regulations concerns voltage drops, and in Sweden any voltage levels in a the power grid should be between 90 and 110 percent of the nominal voltage [19].
2.4 Electric power consumption of a regular household in Sweden.
The electric consumption of a household can roughly be described by having a power peak in the morning after the residents wake up, and in the evening when they arrive home from work. During working hours most people are not at their homes, and the households will only utilize power for basic maintenance such as heating, ventilation and refrigerating. Even though the system is in a low power state during most of the day, the grid must be designed based on the peak load since the grid must be able to deliver the necessary peak power.
When examining the total power consumption of Gotland, it is observed that the daily power consumption trends are similar to a residential area. The load of the whole system increases during the morning and keep a nearly constant power consumption during work hours until late afternoon. The reason for this is because industries and offices with power demanding processes are mainly active during daytime, but then reduced or shut down when the workers end their work shifts.
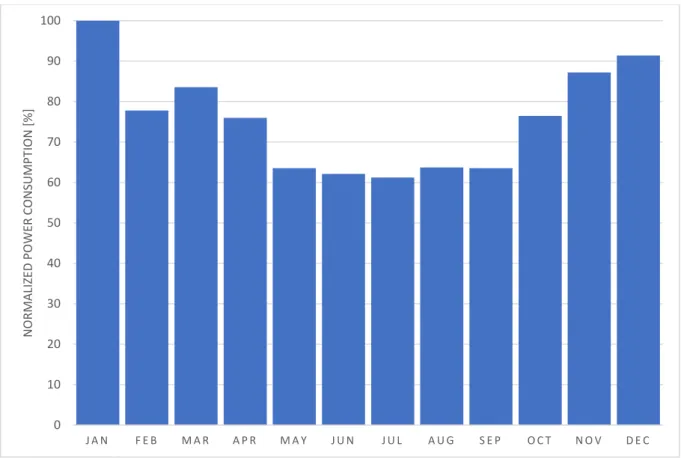
A third perspective to look at the power consumption of Gotland is the annual trends; power loads based on weather and season. The power consumption of Gotland is at its peak during the winter season, since people utilize more electricity for heating and lighting, and at its lowest during the beginning of summer. In Figure 2, which presents the normalized values of Gotland power consumption during 2016 for each month, it may be observed that the power consumption is approximately one third less during the months of summer compared to consumption during winter.
7
Figure 2. Total electric energy consumption during each month of 2016. The values are normalized, where the energy consumption of January, which was the month with the largest electrical energy consumption, was used as a normalizing factor. The power consumption is based on data obtained by GEAB, presented in Appendix D.
2.5. Load profiles of household loads on Gotland
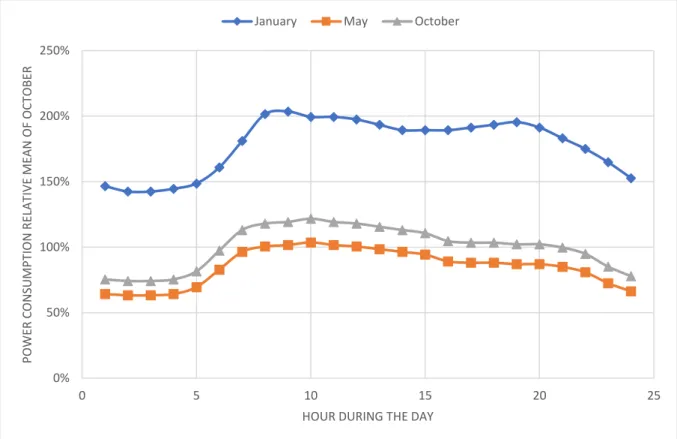
Three load curves of the investigated system, where data were provided from GEAB, is shown in Figure 3. The data is also presented in Appendix B. The curves represent the hourly mean power consumption for three different days during the year 2016. The different days were chosen to capture as much of the data variance as possible. For instance, the load curve of January represents a very cold day, while the day in May represents a warm day where the residents don’t use much electric power. The day in October represents a mean day. The y-axis on Figure 3 is normalized based on the mean load in October.
0 10 20 30 40 50 60 70 80 90 100 J A N F E B M A R A P R M A Y J U N J U L A U G S E P O C T N O V D E C N O R MA LIZE D PO W ER CO N SUM PT IO N [% ]
8
Figure 3. The load profiles of the three different days representing the cases of high, low and mean load. All values have been normalized with the mean value for the load profile of October.
2.6. Electric vehicles (EVs)
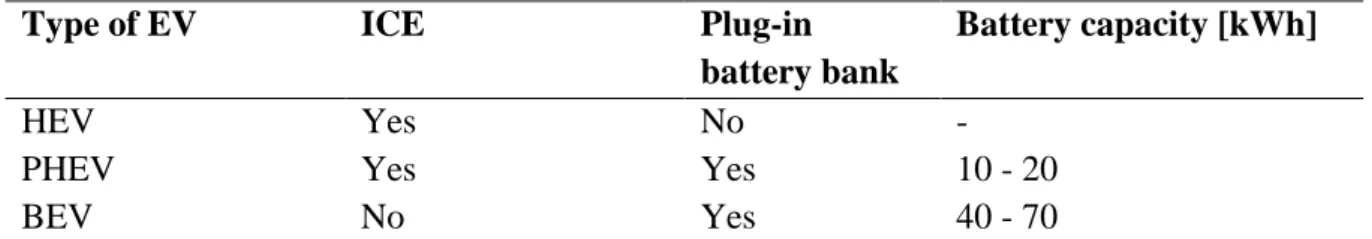
Electric Vehicles (EVs) are vehicles which propel by using an electric powertrain. EVs are in turn classified into three types; hybrid electric vehicles (HEVs), plug-in hybrid electric vehicles (PHEVs) and battery electric vehicles (BEVs). The major differences between the three types are how they propel themselves. HEVs consists of both an electric power engine and an internal combustion engine (ICE) [20]. These engines can either be connected in a parallel or serial drivetrain. In a serial powertrain, the ICE propels a generator, providing power to the electric engine which propels the vehicle. In a parallel powertrain, the engines are coupled and utilized at different driving conditions [20]. PHEVs also have an electrical engine and a combustion engine which are coupled, such as a hybrid vehicle. However, the electric engine in a PHEV is powered by a small battery bank in the vehicle [20]. In 2018, the battery banks installed in PHEVs commonly had a size between 10 and 20 kWh [21–24]. It is possible to charge these batteries externally by connecting the PHEVs to an electric power grid [20]. The last type is called battery electric vehicles (BEVs). BEVs are vehicles which only propels using an electric power engine. The engine is powered by a battery bank which is recharged by connecting the BEV to an external power source, such as an electric power grid. The battery bank in BEVs are usually much larger than in PHEVs. In 2018, the storage in the battery bank of conventional BEVs ranged between 40 kWh and 70 kWh [25–27]. A summary of how the different types of EVs differ from each other is presented in Table 1.
0% 50% 100% 150% 200% 250% 0 5 10 15 20 25 PO W ER CO N SUM PT IO N R EL A TIV E ME A N O F O CT O BE R
HOUR DURING THE DAY
9
Table 1. Summary of some differences between the three presented EV types.
Type of EV ICE Plug-in
battery bank
Battery capacity [kWh]
HEV Yes No -
PHEV Yes Yes 10 - 20
BEV No Yes 40 - 70
The vehicles used for the V2G services in this study were all BEVs, since they had potential to store larger amounts of electrical power compared to the other types of EVs. The reason for only choosing one type of EV was due to simplicity, as it made it easier to set up a standardized battery capacity of the EVs in the system. PHEVs could also have been chosen instead for BEVs since they also interact with an electric power grid. However, BEVs had a higher battery capacity compared to PHEVs and thus allowed more V2G utilization in the system. Therefore, BEVs were regarded as more interesting for this study compared to PHEVs.
2.7. V2G and BEV charging
The definition of V2G is simply that the charging of EVs has a bidirectional charging station, the electric car also has the possibility to feed power back to the grid. This differs from conventional electrical vehicle supply equipment (EVSE) which most commonly are unidirectional; they can only charge the EV. The concept of V2G is quite simple; when the grid is unstable and in need of extra power, the batteries in the EVs discharge to a threshold limit and provide power at locations where it’s required locally. The EVSE would become bidirectional instead of unidirectional. However, doing this practically is complex and demands a fast response controlling unit at each charge station. Just imagine how a system with a few large generators in a couple of years adds thousands of small generators distributed around the whole system. An illustrative diagram of how V2G works is presented in Figure 4.
Figure 4. Diagram of how the BEV and power grid interacts with each other using a bi-directional EVSE [28].
There are additional challenges and issues which concerns the implementation of V2G. One of these challenges is the need for a bidirectional communicational electric power grid, which is one characteristic of a smart grid [29]. The concept of a smart grid can generally be described as an electrical power system which has a number of characteristics which the traditional grid is lacking [29]. A few examples of these characteristics are digital devices, condition monitoring, self-healing, two-way communication and distributed power generation [29]. An increase in information rate and bidirectional communication between components in the
10
system will allow much faster regulations of power, making it possible for the grid to handle more complex power systems.
An increase in the grid’s ability to handle distributed power generation is important since V2G would provide local auxiliary services, which requires fine regulation in order to operate. The power grid of Gotland does not presently have the characteristics of a smart grid, however for the sake of this study it is assumed to be developed for V2G to function properly.
2.8. Why electro-mobility?
As mentioned in the introduction of the report, society must change in order to achieve the goals for sustainability and climate. The transportation sector is no exception from these changes. The possibility of transporting goods and services is crucial for the modern society to function. At the same time, transportations were estimated to contribute approximately 20 percent of all annual global emissions during 2014 [30]. BEVs are an alternative that releases less CO2-emissions compared to fossil fuelled vehicles [31]. In a study from 2012 it was estimated that light-duty BEVs, and a European energy mix, had 10 to 24 percent less global warming potential (GWP) compared to their fossil fuelled counterparts [31].
In addition to lowering CO2- emissions from transportations, EVs have a few more benefits compared to fossil fuelled vehicles. These benefits are reduced noise and better air quality, since EVs are quiet and emit no tailpipe emissions [32]. These benefits are especially beneficial at locations with high traffic density, such as city centres.
2.9. Challenges brought by electro-mobility
Even though BEVs are considered to have less environmental impact compared to fossil fuelled cars, there are some downsides and problems with BEVs which need to be addressed. There are in general four major challenges BEVs must deal with, in order to compete with conventional cars.
Two of these challenges are cost and driving distance before recharging, which are factors that directly affect people’s general opinion about BEVs. The general driving distance of commercial BEVs are today around 270 to 400 km [25,26]. Range anxiety and cost are challenges which are handled on an individual level, where a person is deciding what alternative that mostly fulfils a specific need. In this case, a person chooses between having an EV or a purely fossil propelled vehicle. In 2017 the EVs were still more expensive than cars with a combustion engine, yet studies have found that EVs are expected to be cheaper than similar fossil fuelled cars by 2025 [33]. The main argument for the reduction of price is a continued decrease for cost of material used in the batteries of BEVs [33]. As for range anxiety, there are multiple projects undergoing to install large quantities of publicly available charge stations with short distances between them. One example of these projects are InCharge, a project performed by Vattenfall AB, which have worked with expanding the charge infrastructure in the Nordics, Germany and the Netherlands [34].
11
The third and fourth challenges are challenges on a scale much larger than the daily life of a person. The third challenge is to balance a large increase in local power consumption. The power output from an EVSE connected to a household, which is connected by one phase and limited to 16 amperes (A), is approximately 3.7 kW. In comparison, a regular household usually has a mean power consumption of about 2.8 kW if it has an annual power consumption of 25 000 kWh [18]. This means the load from a household may instantly more than double when the BEVs starts charging. This lead to large power peaks, especially if the cars are charging immediately when people get home in the evening, which in turn may result in lack of electric power due to bottle-necks in the distribution grid. If the EV penetration in the Swedish vehicle fleet will increase, this may become a serious issue in rural areas where the grid can’t handle these power quantities. This shows the importance of creating smart grid solutions and reinforcing a power system for an upcoming increase in power consumption.
Lastly, the fourth challenge is the lack of materials for creating the necessary batteries. Most of the common BEVs uses Li+ batteries. The use of large quantities of lithium itself isn’t major problem, however the batteries use other metals in their cathodes as well as lithium. One of these materials is cobalt, which is scarce [35]. This lack of cobalt could result in very high prices, which means there might not be enough cobalt to satisfy the whole world’s need of BEVs. The manufacturing of cobalt also has issues in terms of social sustainability. Today a majority of the cobalt used in batteries are affiliated with cases of child labour and poor working conditions [36]. This is of course if BEVs will use the exact same technology in the future as in the present. The battery industry and the research on batteries is a highly developing area and it is therefore likely that future batteries of BEVs will consist of a different material composition than present batteries.
2.10. Driving habits
In modern society the car plays an important role for rural households. It creates easy and flexible transportation of goods and services for a household family, such as driving to work, shopping for groceries, dropping off children for school or visiting friends in other towns. However, even though the car grants a lot of flexibility, it has a low level of daily utilization. The driving habits of a Swedish citizen is to make 0.7 main trips every day, drive about 25 km each day for approximately 44 minutes [37]. If an assumption is made that people generally drive their cars between 8:00 in the morning and 20:00 in the evening, the car will be parked about 94 percent of the time where cars usually are utilized. If one also considers that the car can be utilized for V2G or charging the whole day, the total time during a day in this case is estimated to 97 percent of each day in average.
12
3. Method
To study how V2G can affect the grid capacity of Gotland, simulations were executed in PSS®E (Power System Simulator for Engineering). PSS®E is a program which is commonly used to
analyse large electric power systems. Other simulation programs were also considered during the project, such as a MATLAB add-on called Simulink, yet in the end PSS®E was considered as the most suitable option.
There were two main reasons why the simulations were done in PSS®E. The first reason was because Vattenfall AB had used this program during earlier studies regarding the electric power system of Gotland, and therefore it was also deemed suitable for this project. In addition, if the models of the power grid of Gotland were built in the same program, then it may be easier to combine them for further studies. The second reason was because PSS®E is a common tool in power engineering for load flow analyses. It is easy to set up load flow analyses and the program is compatible with Microsoft Excel, which enables import of large data sets from Microsoft Excel directly to PSS®E for simulation. The simulation model was set up to simulate a part of the low-voltage grid of Gotland that has, or will have, issues in the future regarding grid capacity.
3.1. Scope and assumptions
An electric power grid consists primarily of generators, transformers, loads and branches, but the complexity increases as the power systems becomes larger. Multiple generators can support multiple loads. The branches can also be connected to each other, to prevent large power losses during short circuits. When V2G as a function is added the system becomes even more complex. Through V2G the system obtains a much larger amount of available power sources, yet these can only be utilized to a certain amount depending on for instance the battery capacity of every EV. In addition, other indirect factors will have a larger impact on the power system after V2G is utilized. One example is the driving habits of the residents that are connected to the electric power grid. The complexity and all indirect factors are hard to account for, and in this study some simplifications have been made to keep the scope of the study at an appropriate size. These simplifications were mostly focused on setting initial or steady-state conditions on factors that were considered having large uncertainties, such as the driving habits of the residents or how many EVs on Gotland that can utilize V2G. All these simplifications are based upon assumptions which are motivated in this section. These simplifications were expected to have an impact on the results obtained from simulations in this study, and the potential effects are presented later in the report along with an analysis of the simulation results.
The first and foremost assumption in this study was that the resident in the area primarily charged at home. V2G could possibly have the potential to be more centralized, with multiple charge stations placed at tactical locations connected to the distribution grid of 11 kV on Gotland, but for the scope of the study the charging was mainly considered to be at the homes of the EV owners. In addition, Surveys regarding the charge habits of EVs have shown that most of the charging occurs at low-voltage level, 400 V, at the households of the EV owners [38]. Therefore, the area to investigate should be a low-voltage power system on Gotland.
13
After the voltage levels was set to 400 V followed the process of choosing an area to investigate of appropriate size. To create a model of the whole low-voltage grid was considered too time consuming during the study, and there was no preconstructed model available at Vattenfall AB. Therefore, a second assumption was made that the low-voltage grid on Gotland could be separated into smaller segments with similar system properties. The results obtained from investigating one of these segments could then also be applied for the rest of the low voltage grid on Gotland.
The investigated area does include residents, where a portion of the residents have BEVs which utilizes V2G. The number of BEVs installed in the system was set to 120, which means 20 percent of all 600 estimated households in the area had a BEV utilizing V2G. The value was based on predictions of how the selling of EVs was expected to progress during the upcoming decades. A report by Bloomberg estimated that by 2040 approximately a third of the global car fleet would consist of EVs [39]. Since the definition of EVs not only includes BEVs but also HEVs and PHEVs, it is not possible to assume that a third of all private vehicles on Gotland would be BEVs. After evaluations it was assumed that 20 percent of all households in the area would have one BEV and a EVSE which supported V2G services, thus 120 V2G systems was added to the system.
The BEVs were assumed to be fairly evenly distributed among the households of the system, and also evenly distributed on the three phases of the electric power grid. The advantage of distributing the BEVs evenly was that the results from the simulations would yield more general changes in performance of the power grid. In practice it could be possible that certain parts of the neighborhood area have a higher concentration of BEVs compared to others, due to for instance socio-economic factors, yet this was considered to reach beyond the scope of this master thesis study. The reason for the BEVs not being completely evenly distributed was due to two reasons. The first reason was that the loads in the system model was measured from transformers, which could be connected to multiple households on their secondary sides. In the model just one BEV and V2G subsystem was connected at each of these transformers, thus the number of households connected would differ between the V2G subsystems. The second reason for not having the BEVs being completely evenly distributed among the households was due to unpredicted behaviour of the model. When V2G subsystems were added to certain parts of the system model no converging solutions was found. In order to yield converging solutions during simulations, no V2G subsystems were installed at those locations in the model. During the project duration no reasonable explanation was found for this behaviour of the model.
For simplicity, all BEVs were assumed to charge and utilize V2G at the same time. This assumption did also include that all residents left and returned to their respective household at the same time, which in practice seldom was the case. In order to make an accurate estimation of when the cars can be used for V2G or are charging, detailed knowledge of the behaviours of the resident on Gotland is required. This information was considered to lie beyond the scope of this study, as the aim of the study is to determine the potential and effects from utilizing V2G on Gotland. Setting all BEVs to operate simultaneously yields the maximum effects for the investigated cases. If the case would be implemented practically, the effects would probably be smaller than shown in the results from this report.
14
Some additional assumptions were made regarding when the BEVs would charge or utilize V2G, and regarding the charge and discharge rates of the EVSEs. As mentioned earlier in this section, the BEVs were assumed to charge at home using a one-phase EVSE. The charge rate was therefore set to 3.6 kW, which is approximately the power supplied by a one-phase charger station at households [40].The power supplied during charge or V2G was also assumed to be static. The time when the BEVs would utilize V2G or charge was set by observing potential power peaks or durations with low power utilization in the load profiles in Figure 3. In addition, times when the BEVs would be used by their respective owners were also considered and regarded as time when the BEVs would neither charge nor utilize V2G. After simulating the model with different time intervals for charge and V2G utilization, one final time interval was chosen. The BEVs were decided to charge during the evening and night between 21.00 and 05.00 At 05.00 the BEVs would be utilized for V2G until approximately 08.00, at which the BEVs would be used for transportation services. Since the BEVs would not be stationed at the households during the day, they would not affect the system neither by charging or be used for V2G services. Therefore, the BEVs were regarded as inactive during the day, except for a small loss of energy capacity by driving the BEV between households and workplaces for approximately half an hour for each trip. The BEVs would return at their respective household between 17.00 and 18.00, and then utilize V2G between 18.00 and 20.00. The BEVs were neither charging or being utilized for V2G between 20.00 and 21.00, and the cycle would repeat once again with the BEVs charging at 21.00. These time intervals for charging and V2G utilization was regarded suitable since they created a flatter load profile; a more constant power supply to the system in terms of amplitude, while also resulting in only a small impact on the driving habits of the BEV owners.
The BEVs were assumed to only provide active power to the grid. V2G has the potential to also supply the grid with reactive power for other auxiliary services. However, when the BEVs were set to support the grid using reactive power, the model had difficulties in balancing the power flows in the system grid.
The assumptions presented have so far only handled issues and conditions for how the BEVs were assumed to behave in the system, yet it is also important to note that integration of V2G services drastically increases the complexity of an electric power system. In order to fully utilize V2G a smart grid is needed with a two-way communication between the electric power grid and the EVSE. This type of power grid was not present on Gotland during the time of this thesis project. Having a smart grid on Gotland is crucial for determining if V2G even can be utilized on the island. However, as the scope of the project was to determine the potential of utilizing V2G services in a power grid, it was just assumed that the grid was considered “smart”. As mentioned earlier, V2G is currently only in a piloting stage, and large-scale implementations are probably not likely during the upcoming decade. This means that technically it could be possible to have a smart grid on Gotland by the time V2G services could be implemented on in large scale systems.
Since V2G was not considered to be implemented on large scale projects until future decades, it was also necessary to estimate how the power consumption of the investigated area would change in the upcoming decades. This estimation was no easy task due to large uncertainties in forecasting key factors. A scenario from a study by IVA estimated that the power consumption from the household sector would be between 20 and 25 TWh in 2050 [7]. The present power consumption of the household sector is approximately 21 TWh [7], indicating that the power
15
consumption in the future decades might only slightly change in the household sector. Therefore, it was assumed that the power consumption of the investigated area on Gotland would have a similar power consumption as today when V2G would be implemented.
This section included the assumptions made during the study. These assumptions are important to bear in mind when continuing reading this report, as they would have an impact on the results. A brief presentation of all assumptions is therefore summarized in a bulleted list.
• All EVs in this study were BEVs
• These BEVs did only charge or utilize V2G from an EVSE at their respective household. • A smart grid on Gotland able to incorporate V2G functionality was available.
• All cars used the same type of charge station for V2G and charge services, which could deliver a power output of 3,6 kW.
• All chargers could only turn on or off for charge or V2G utilization.
• The residents would have the same power consumption during the following decades as presently.
• EV distribution was fairly evenly distributed on the island where each load in the system model had one BEV connected, unless it created simulations errors at certain loads. • People mostly use their cars for getting to and from work (7:30-8:00 and 17:00-17:30). • Everyone used their vehicles and were in need for charging simultaneously.
All these assumptions had most likely an effect on the results of the study, and some of them are probably rather weak or questionable if they properly reflect the system in practice. For example, it is highly unlikely that all owner of the BEVs would live their daily lives exactly the same and have the same needs for transportation. It is also possible that certain areas of the system are more likely to have a larger density of BEVs compared to other parts of the system. At the same time, these assumptions were necessary to create a scope for the study which was more easily comprehended and would still yield results which presented the potential of utilizing V2G on Gotland.
3.2 Setting up cases
To define suitable cases to examine, it was important to first determine what questions the case will handle. One thing which needed to be examined was how the power system will react to V2G in the worst case based on available data; when the load was at maximum. By examining this point in time, one would obtain the maximum effects from the V2G solution. The second case which was interesting for examination was the opposite of the first case; when the system load was at minimum . At times when the power consumption is low V2G wouldn’t need to be utilized, however the BEVs could be able to handle potential overproduction from intermittent power generation e.g. wind power. In this case, the BEVs will act as additional loads instead of small DC generators. The minimum load case might have a small relevance to this study. The results from this could however be of potential interest as for future studies if the system model was integrated with large power generation source, such as a wind power park. These results from simulating these two cases were expected to show how the power system would react when the system load was very high or very low, yet in most of the time the load would be somewhere in between. The third and last case to simulate was therefore when the system had a regular load.
16
One challenge in designing these cases was to determine a suitable time period for each case. Since an assumption was made that the annual load curve looked similar between years, the time period could be set to one year. Then, the three days representing each case was found by creating a Python-script consisting of multiple built-in functions in MS Excel and Python. The maximum and minimum cases were found by first summing up the load for a whole day, and then by finding the maximum and minimum value of these summed values. To find the case with the average load curve the load was summed up hourly instead of daily. The values would then represent the mean value of power for each hour. The squared error from how much each hour of each day was different from the mean load curve was calculated, and the day with the smallest total squared error was chosen. The entire code used in this script can be found in Appendix C. The three days found to be interesting for the study were a day in January, May and October respectively, the days with the highest, lowest and most average power consumption.
3.3. Input data to PSS®E simulation model
The data necessary for simulation was obtained from Gotlands Energi AB (GEAB), a daughter company of Vattenfall AB. GEAB is the owner of the power grid of Gotland, and stored information about the investigated low-voltage power grid used in this study. The input data required for the system model included active and reactive power, ratings and impedance of the components which built up the system. The values of this data were measured at a certain time, and data were chosen to match the cases presented in the previous section 3.2. In addition, data of the power consumption for the whole island was used to determine which time of the year they could represent in each case, as corresponding data of the investigated area was not available at the time of the project. A sample of the data is shown in Appendix D to give a better understanding of the data structure.
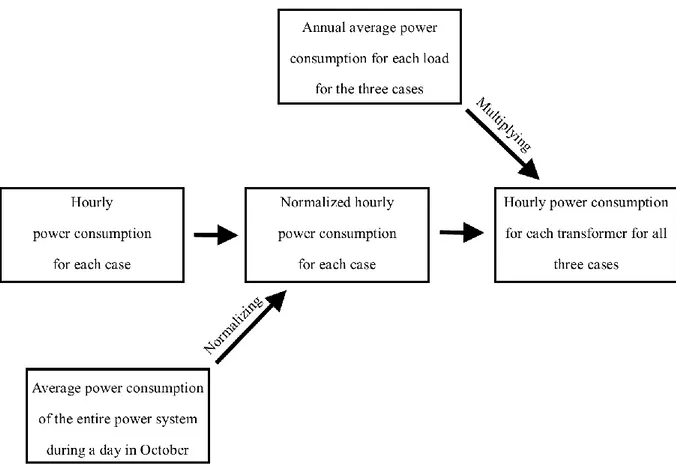
The data obtained from GEAB needed in some cases to be altered or combined in order to fit the model. For instance, the model required the power consumption for each load in the system for every hour. This data was obtained by combining two other sets of data obtained from GEAB; the average annual power consumption of each load, and hourly data of the power consumption of the whole system. An illustrative diagram of the process of estimating this data is presented in Figure 5.
17
Figure 5. Process of estimating the power consumption for each transformer in the investigated system.
Every data point of the hourly power consumption of the whole system was normalized using the mean power consumption of the day with average power consumption. These normalized values were then multiplied with the annual average power consumption of each load, the mean power consumption of the day in October, which yielded a data set of power consumption of each load for every hour for the three days. The resulting data was presented earlier in the report in Figure 3. The reasoning behind this methodology was to assume that the annual average of every load was calculated by summing up the whole annual power consumption and dividing it by 365 (the amount of days during a year). That value would then also represent the mean power consumption of the day with an average power consumption. A drawback from creating data in this manner is that every load increase or decrease at the same time, which is certainly not the case in the real system. However, this was an effective way to create the necessary data points without knowing the exact value for every load for each hour of the investigated days. The next estimated data set was the power limitations of the conductors. Data regarding cable types and electrical characteristics of the conductors was obtained from GEAB. However, there were difficulties in obtaining exact values for the power ratings of the conductors. The reason behind this was that the power limitations varied due to multiple factors, such as conductor material and installation type. The only information provided regarding the power ratings of the conductors was that they generally transport power corresponding to 40 - 50 percent of their maximum capacity during normal operating conditions, and 70 - 80 percent during high load conditions. With knowledge of levels for maximum capacity, the power ratings of all conductor types were estimated by simulating the model without any V2G subsystems. These simulations did also use the power consumption of an average day, but in this case it was to estimate power
18
ratings instead of normalizing power loads. After each simulation the power ratings of the conductors were changed, and the goal of the simulations was to yield an output where a large amount of the conductors had a power flow between 40 and 50 percent of the power rating. The system consisted of many conductors, and to individually control every conductor was in this project considered to demand too much time. Since the conductors was categorized into different types, a simplification was made that every type of conductor had the same power rating. This simplification made the estimations of all power rating more time efficient, but it did also result in a variance between conductors of the same cable type. In some cases, the strain of the conductors could differ between 80 or below 10 percent of their maximum power capacity. The values chosen for the power rating can be found in Appendix E.
In summary, two input data sets to the simulation model was created using data and information obtained from GEAB. The first one was hourly data for every load during the three days for investigation, and the second was the power ratings of the cables. This data processing based on the data available creates some uncertainties which could not be validated in the work, however the input data created were deemed necessary for the purpose of the project.
3.4. Creating a complementary python-script.
When the cases were set up, the system models were finished and all necessary data was obtained, all that remained was to execute the simulations in PSS®E. The simulations executed were load flow analyses, where PSS®E would calculate the power flow in the conductors to
meet load demands.
The investigated power system contained multiple buses and loads. To make the data inputs and simulations easier a Python-script was created. This script had four major functions. The first function was to import lists of input data from a starting file using Microsoft Excel. One example of this process was the import of bus names, which would be used to locate where the V2G subsystem would be connected. Secondly, the script started a predetermined case file in PSS®E and added a generator and load at these V2G buses. The generators represented the utilization of V2G, while the loads represented the BEVs charging. Thirdly, the script made simulations according to the case conditions. Lastly, the Python-script saved output data in new files for further examination. Using the Python-script instead of manually inserting each input data made the simulation setups much quicker, and reduced the risk of incorrect inputs due to human error. The whole script with brief comments of the code can be found in Appendix F.
In the Python script, the charge and discharge hours of the BEVs were set to different times during a day, in accordance with the assumptions in section 3.1.. The BEVs were set to utilize V2G during the morning and in the evening, more precisely between 5:00 and 8.00 and between 18:00 and 20:00. At 21:00, the BEVs would start charging until 5:00, when they once again started to utilize V2G. Since the BEVs were assumed to be stationed at the workplaces of the BEV owners during daytime, the BEVs were set to neither charge or discharge between 8:00 and 18:00. The reason was that these workplaces possibly were located outside the investigated system, thus resulting in that they would not have any impact on the system between these hours.
19
3.5. Output data
The output from the simulations consisted primarily of two sets of data; voltages in p.u. (per unit) of every bus, and the strain in terms of capacity in percent of every branch of the system. Since the system had more than 150 buses connected by branches, the number of output data points just from one simulation became very large. The total number of output data points obtained from all simulations, from simulating every hour of the three cases considering whether the system utilized V2G or not, were approximately 59 000 data points. This amount of data is too much to present in the report and is also very hard to interpret for the reader. The output data was therefore compiled, and the mean value of the voltage levels and capacity strain from every simulation was calculated and presented instead of showing the whole output data set. Using the mean value makes it easier for the reader to understand the overall change in the system in terms of voltage levels and strain. However, one major drawback of only presenting the mean value is that the variance in output data becomes unknown. Therefore, it’s also important to express the change in variance in an easily interpretable way for the reader. This was solved by also presenting the highest and lowest values from each simulation.
3.6. Simulation models
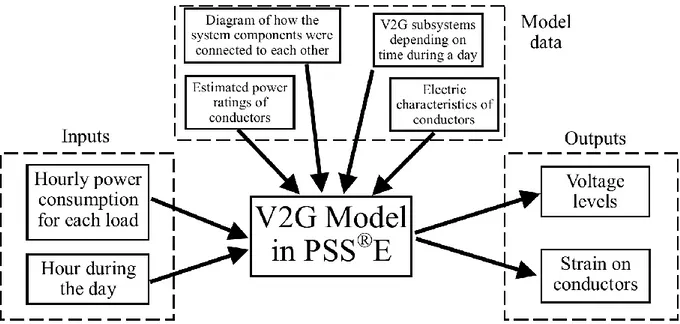
The reference model created in PSS®E consisted of 152 buses, where every bus was connected to at least another bus by one or two branches (conductors). Loads were added to the system and placed at their corresponding buses, according to information provided by GEAB, which created a reference model electric power system without V2G. When the reference model was created, more components were added to it which would represent the V2G utilization model. V2G was modelled by using a generator and an additional load. Diagrams of how inputs, outputs, and additional data used in the study was integrated into the reference model without V2G is presented in Figure 6. The modified version of the reference system, where the V2G subsystems were added, is presented similarly in Figure 7.
20
Figure 6. Diagram of the how different types of data was integrated and constructing the reference model, which represented the examined electric power grid on Gotland.
Figure 7. Diagram of the how different types of data was integrated and constructed the system model with V2G integration.
The V2G loads were connected to buses containing a household load and the V2G generators were connected to new buses, which in turn were connected to the buses with a household load. The buses with a V2G generator and buses with a V2G load were connected by branches representing lossless conductors. These conductors were regarded lossless since they are much shorter than other conductors in the system, and therefore these losses were considered small enough to be neglected in this study. If one would want to add these losses to the model, an alternative method could be to slightly increase the V2G loads and decrease the power output of the V2G generators. Also, the reason why the V2G generators are connected to a separate bus other than the same as the V2G loads is because PSS®E is not designed to have generators and loads connected to the same bus.
21
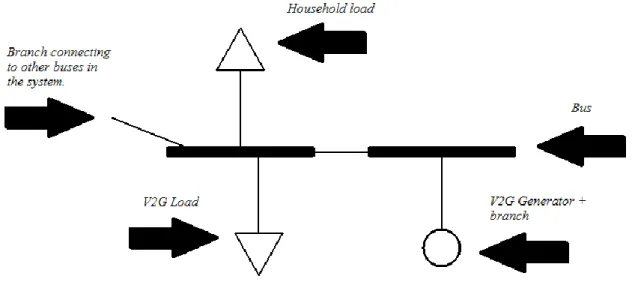
An illustrative example of how all components were connected to each other is presented in Figure 8, which is one bus in the system with all components described in this section. Please note that not all buses look exactly as the one in Figure 8. For instance, some buses may have more branches, while other buses did not have any V2G component.
Figure 8. Illustrative example of a bus including every different component in the system directly connected to it. Please note that not all buses had all component as represented in the figure.
22
4. Results and Discussion
In this project the effects of V2G on voltage levels and strain, in terms of power capacity, of a part of the electric power system of Gotland have been investigated. Three different load cases were simulated which represented operating conditions during a day in January, May and October respectively. Also, how the transporting flexibility of the BEV owners would change due to these changes was estimated. In this chapter the results from the simulations are presented. Since the strain, voltage levels and transport flexibility are three different issues, the issues are presented in sections separately from each other. The discussion of the results regarding each issue is included in each section after the presented results. First the results for how the battery capacity in the BEVs would change during a day is presented, followed by a discussion of how this affected transportation flexibility of the BEV owners. Secondly the results for how the strain were affected by V2G are presented and discussed. The third section presents and analyses the impact on the overall voltage levels of the system when V2G was integrated. Lastly, the fourth section discusses the results and project through more general perspectives. Topics which are discussed in the last section are for instance potential errors in simulations, credibility of the results and future development.
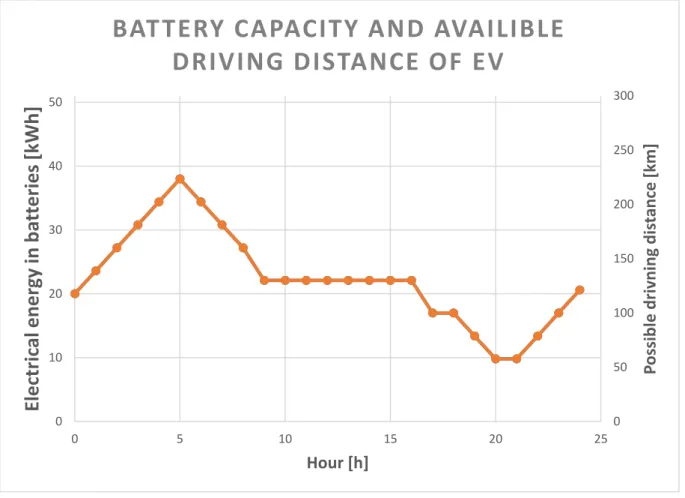
4.1. Utilization of EVs during a day
If the BEVs were utilized as described in the section 3.1, the available capacity and possible driving distances for each BEV at a certain time is presented in Figure 9. Note that each data point represents the capacity and driving distance at that exact moment, and depends on if the BEV was charging, driving or utilizing V2G. For example, an increase in battery capacity corresponds to the BEV charging, while a decrease that the BEV was either used for V2G or transportation. The starting point at hour 0 is an initial value and was set to 20 kWh, which symbolized a BEV with approximately 50 percent of its maximum battery capacity remaining. The value of 40 kWh was set as the maximum battery capacity as modern BEVs have an capacity of between 40 and 70 kWh, and is expected to increase in the near future [25–27]. Another initial value could also have been used, but using a BEV whose batteries were neither fully charged nor depleted was expected to yield a better approximation for the variance of available battery capacity in a continuous system. The net charging during the whole day was approximately 0.6 kWh, meaning the BEV would generally start at a slightly higher initial state for every new day. The calculations for these points were based on the simulations made and the assumptions mentioned in section 3.1. For instance, the cars were estimated to require 17 kWh to drive 100 km and that the cars were used for V2G, a value estimated by dividing the battery capacity of BEVs with their respective range capacity [25–27]. Also, the V2G were active from 05:00-08:00, and from 18:00-20:00. Since the model only investigates a rural area and not where the residents are during work hours, between 09:00-17:00, the calculation was made with the assumption that the cars are not charged at the workplaces. It was also assumed that the residents have approximately 30 km to their workplaces, which takes approximately 22 min if one would travel at a mean speed of 80 km/h. The residents are travelling to their workplaces between 08:00-09:00 and travel home between 17:00-18:00. Between 20:00-21:00 the BEV would neither charge nor be used for V2G. During that time of day the load seemed to be low enough for not having to utilize V2G. At the same time, if the BEVs would charge