Lighting Simulation
for a more value-driven building design process
Anahita Davoodi Licentiate Thesis, 2016
Department of Architecture and Built Environment, Lund University Department of Civil Engineering and Lighting Science, Jönköping University
2
Lighting Simulation for a more value-driven building design process Copyright© Anahita Davoodi
Anahita.davoodi@ju.se Licentiate Thesis 012016 ISSN 0280-8269
Environmental Psychology
Department of Architecture and Built Environment Faculty of Engineering, LTH
Lund University
Box 118, SE-221 00, Lund Sweden
3
ABSTRACT
Concerns about global warming are increasing, hence, the urgency to cut carbon emissions. Reducing energy consumption, including lighting energy, is seen as the primary solution. Yet, solving the environmental factor should not come at the cost of other pillars of sustainable development. Rather, maximizing the total value of the building should be the focus. Maximizing value in the context of lighting entails improving the quality of the lighting. This study has investigated how lighting simulation could help in achieving better lighting quality. The aim of the thesis was defined as to understand the underlying architecture of lighting simulation and obtain an overview of its characteristics and applications as well as to study the use of current simulation tools.
The theoretical background of lighting simulation (in the domain of Systems Engineering) was reviewed from the literature. This revealed the missing and imperfect links in the solution-to-value chain. The thesis suggests the use of a new base metric, Retinal Illuminance Map, as a solution, which in combination with black box simulation of a visual system can help repair this incomplete chain.
The study of the current lighting simulation tools (Paper 1) revealed that illuminance-based metrics, luminance-based metrics, daylight availability metrics, and glare indexes are the most available performance metrics in existing lighting simulation tools. Based on usability, acceptability, availability, and previous references in the literature six software programs (Radiance, DAYSIM, Evalglare, DIALux, VELUX, and VISSLA) were selected and compared. It was found that no single tool could meet all the needs of a designer, hence, simulation tool(s) should be selected (or combined) according to the requirements of project goals and the stage of design.
Building on these studies, applications of lighting simulation were identified and compiled in relation to different aspects, including performance metrics, stages of design, optimization, model integration, BIM, and parametric modeling.
To obtain first-hand information about lighting designers’ experience, an online survey was conducted in Sweden (Paper 2). The results showed that lighting simulation programs were widely (90%) used in Sweden for analysis and/or rendering purposes. The majority of lighting designers considered both daylight and artificial light in their design. Factors such as ease-of-use, simulation time and training had more weight than accuracy and the diversity of metrics in practitioner’s eyes. Surrogate modeling was identified as a solution for speeding up simulation time, which would also enable exploration of design solution space especially in the early design stage.
5
This thesis is dedicated to my dear parents, Tahmaseb and Parvin,
for their endless love, supports and encouragement.
7
ACKNOWLEDGMENTS
First, I would like to express my sincere gratitude to my supervisors Professor Thorbjörn Laike and Dr. Peter Johansson for giving me their continuous support not only by guiding me with regard to the research but also by encouraging and motivating me throughout my study. Many thanks for your patience and for giving me enough time to explore different areas of the subject. In addition, I would like to thank all my colleagues at the Civil Engineering and Lighting Science Department of Jönköping University, for creating a welcoming environment for newcomers like me. Specially, I want to thank our great chief Dr. Gunnar Eckert for all his consideration and support; Dr. Annika Kronqvist for taking the time to discuss my work and reviewing my papers with attention to the finest details; Alicia Beatriz Dabate for her care and kindness; Johanna Enger for her stimulating discussions and friendly company.
I appreciate the Swedish Energy Agency and Bertil and Britt Svenssons Foundation for Lighting
Technology for their financial support and their pioneering spirit and for leading the initiatives
to push the boundaries in the lighting industry.
Many thanks to Mostapha Sadeghipour Roudsari, creator of Ladybug and Honeybee, for taking the time to answer my questions; Hamed Khademi for sharing his knowledge about surrogate modeling and machine learning; and Abolfazl Ganji for valuable discussions regarding light, color, and data visualization.
Most important, none of this would have been possible without the love and patience of my family. My parents, Parvin and Tahmaseb, have been a constant source of love, support, and strength all these years. My grandparents, Reza and Toba, Mohammad Sadegh and Zinat, your memory and kindness is always with me and I would like to express my forever heartfelt gratitude to you.
I also appreciate Lake Munksjön, which I could see from my office, for showing its beauty in different forms every season and making me happy.
Last but not least, I want to thank my friends Evariste, Hamed, Shina, Shewin, Claudia, Hoda, Mahdi, Mina, Homayoun, Mahnaz, Farrokh, Fazel, Setare, Nahal and Behnam for being there and supporting me spiritually.
P.S.
Thank you for reading :)
Anahita Davoodi-2016/05/07
9
LIST OF PUBLICATIONS
Paper I
Davoodi Anahita, Johansson Peter, Enger Johanna, “Comparison of lighting simulation tools
with focus on lighting quality” Improving Energy Efficiency in Commercial Building
Conference (IEECB’14), Frankfurt 01-03 April 2014
Paper II
Davoodi Anahita., Johansson Peter, Laike Thorbjörn, “Current use of lighting simulation tools
for lighting design in Sweden” The Nordic Journal of Architectural Research (Submitted)
Paper III
Davoodi Anahita, Johansson Peter, Enger Johanna, “ ﺶﯿﭘ یﺎھﺖﺻﺮﻓ و ﺎھ ﺶﻟﺎﭼ ،رﻮﻧ یزﺎﺳ ﮫﯿﺒﺷ یﺎھراﺰﻓا مﺮﻧ ر
و ” or “Lighting simulation tools, the challenges and opportunities”, Iran Lightning Design Conference (ILDC), Tehran, Iran, 19-21 November 2014, Armanshahr Journal,Specialized of Architecture & Urbanism (Accepted)
Paper IV
Enger Johanna, Davoodi Anahita, “Visual Perception and Criteria for Good Lighting”, 3AIC 2015 / MCS 2015 @ Tokyo
11
Contents
ABSTRACT ... 3 ACKNOWLEDGMENTS ... 7 LIST OF PUBLICATIONS ... 9 List of Figures ... 13 List of Abbreviations ... 14 1 Introduction ... 15 1.1 Aim ... 16 1.2 Research Questions ... 16 1.3 Research Methods ... 161.3.1 Methods for data collection ... 17
1.4 Research Limitation ... 18
1.5 Thesis Structure ... 18
2 Theoretical Background: Systems, Modeling and Simulation... 20
2.1 Problem and System Definitions ... 20
2.1.1 Problem definition ... 20 2.1.2 System definition ... 21 2.2 Systems Analysis ... 22 2.3 Modeling ... 23 2.4 Simulation ... 25 2.4.1 Photo-realistic vs physical-based ... 26
2.4.2 Glass-box light simulation algorithms ... 26
2.4.3 Black-box lighting simulation methods (surrogate models) ... 27
2.5 Validation ... 27
3 Applications of Lighting Simulation Tools ... 28
3.1 Simulation Output ... 29
3.1.1 Climate-based daylight modeling ... 29
3.1.2 Annual spatial contrast and annual luminance variability ... 30
3.1.3 Annual daylight glare probability ... 30
3.1.4 Mean room surface exitance ... 30
3.1.5 Luminance-based metrics ... 30
3.1.6 Analysis of non-visual effects of light ... 30
3.1.7 Data visualization ... 31
3.1.8 Image visualization ... 31
3.2 Stage of Design ... 31
12
3.2.2 Design development ... 32
3.3 Optimization ... 32
3.3.1 Optimization Issues ... 33
3.3.2 Multi-objective optimization in lighting design ... 33
3.3.3 Case studies ... 34
3.4 Model Integration ... 34
3.5 BIM ... 35
3.6 Parametric Modeling ... 37
4 Summary of Papers ... 39
4.1 Paper 1: Comparison of Lighting Simulation Tools with Focus on Lighting Quality ... 39
4.1.1 Aim ... 39
4.1.2 Method ... 39
4.1.3 Q1. The concept of lighting quality and performance metrics ... 40
4.1.4 Q2: The characteristics of simulation software ... 41
4.1.5 Q3. The available simulation software ... 41
4.1.6 Q4. The comparison of selected lighting simulation software ... 41
4.1.7 Discussion and conclusion ... 42
4.2 Paper 2: Current Use of Lighting Simulation Tools in Sweden: A Survey ... 43
4.2.1 Method ... 43
4.2.2 Summary ... 43
4.2.3 Discussion and conclusion ... 43
5 Potentials for Improvement ... 45
5.1 Setting a Path for Value-Driven Design in Lighting ... 45
5.2 Retinal Illuminance Map; A New Base Metric ... 46
5.3 Simulation Time and Surrogate Models ... 47
5.4 Qualitative Variables ... 48 5.5 Designer Experience ... 48 6 Conclusion ... 50 6.1 Main Findings ... 50 6.2 Conclusion ... 51 6.3 Future Work ... 51 7 References ... 52 8 Appended Papers ... 57
13
List of Figures
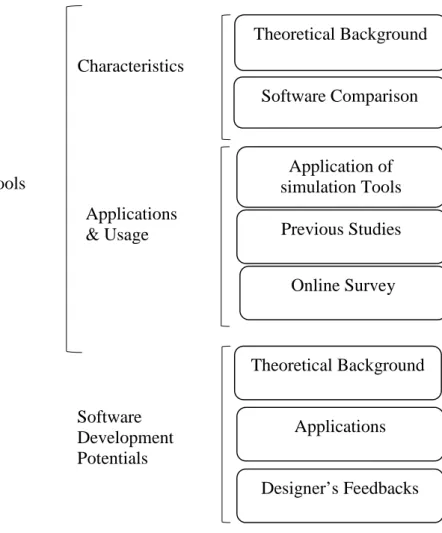
Figure 1. Outline of the dissertation ... 19
Figure 2. Value-generation network in building design ... 21
Figure 3. System boundary defined according to the example problems a) visibility b) dazzling glare c) energy efficiency ... 22
Figure 4. Analysis of systems in lighting ... 23
Figure 5. Models for simulation are simplified depending on the problem ... 24
Figure 6. Geometrical and analytical models in the context. Modified from [Negendahl 2015] ... 25
Figure 7. The coupling loop applied to simulation-based optimization in building performance studies [Nguyen and others 2014] ... 33
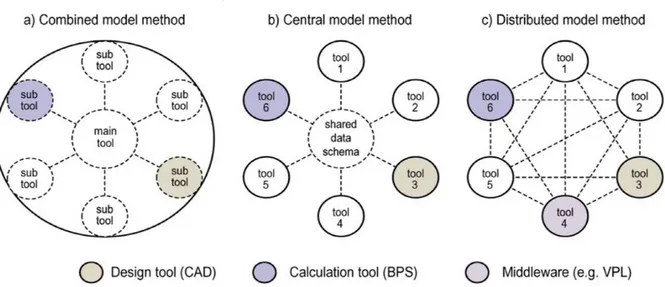
Figure 8. Differences between coupling methods: a) combined model method (typically operated in a simulation package), b) central model method (using a central database/file format/schema), c) distributed model method (utilizing a middleware). Reference: [Negendahl 2015] ... 35
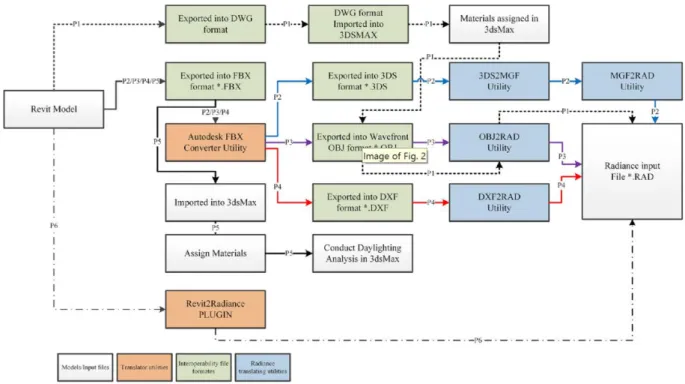
Figure 9. Different translation paths from Revit to Radiance, Reference:[Kota and others 2014] ... 37
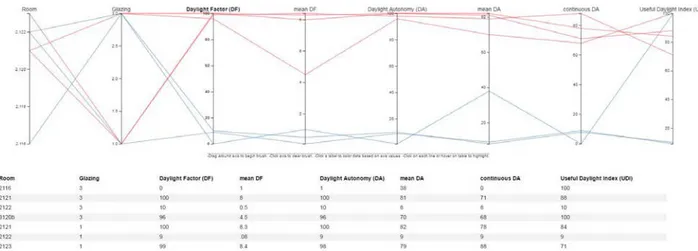
Figure 10. Parallel coordinate visualization commonly used for parametric analysis ... 38
Figure 11. Translation from a design solution to value ... 45
14
List of Abbreviations
AEC Architecture, Engineering and Construction
ASE Annual Sunlight Exposure
BGI British Glare Index
BIM Building Information Modeling
BPO Building Performance Optimization
BPS Building Performance Simulation
CAD Computer Aided Design
CBDM Climate-Based Daylight Modeling
cDA continuous Daylight Autonomy
CGI CIE Glare Index
CIE Commission Internationale de Eclairage
DA Daylight Autonomy
DF Daylight Factor
DGP Daylight Glare Probability
DGPs simplified DGP
DGR Discomfort Glare Rating
EBD Evidence-Based Design
HDR high dynamic range
HVAC Heating Ventilation and Air Conditioning
IFC Industry Foundation Classes
LPS Lighting Performance Simulation
MCDM Multi-Criteria Decision Making
MOO Multi-Objective Optimization
MRSE Mean Room Surface Exitance
PMV Predicted Mean Vote
PPD Predicted Percentage of Dissatisfied
PPE Predicted Percentage of Elevated
RGB Red Green Blue
RIM Retinal Illuminance Map
sDA spatial Daylight Autonomy
SEA Systems Engineering Analysis
UDI Useful Daylight Illuminance
UGR Unified Glare Rating
VCP Visual Comfort Probability
VDD Value-Driven Design
15
1 Introduction
Concerns about global warming are increasing and with them the urgency to cut carbon emissions. Reducing energy consumption, including lighting energy, is seen as the primary solution. Yet, solving the environmental factor should not come at the cost of other pillars of sustainable development. The energy-reduction view should change in favor of a value-driven view in which the value of energy reduction is weighed against other values and constraints to maximize the total value of the building [Green 2012; Seppänen 2006]. Different design philosophies support this ideal, of which value-driven design (VDD) and performance-driven architecture were of interest throughout this research. VDD is a systems engineering strategy that enables multidisciplinary design optimization [Sturges 2006]. According to Shi and Yang, the emphasis in performance-driven architecture is on “integrated and comprehensive optimization of various quantifiable performances of buildings” [Shi and Yang 2013].
Lighting can play an important role in increasing a building’s total value due to its impact on comfort, productivity, and health, to the extent that it is considered on par with energy efficiency [Dehoff 2012; Dehoff 2014]. Optimization of light in the design process is intertwined with other values such as thermal comfort and the view outside, which makes the optimization process complicated.
Before computers became widespread, design decisions were based on physical models, design tables, or rule of thumb methods and, in some cases, based purely on a designer’s subjective intuition. The performance metrics and design criteria matched the tools available for designers. Today, architects and lighting designers are increasingly using computer simulation software to back up their design decisions with objective performance indicators [Ibarra and Reinhart 2009; Reinhart and Fitz 2006]. This has created an expectation of being able to enhance performance metrics and the criteria on standards bodies by introducing metrics that are more capable of and better correlated to lighting quality. Such metrics, though, are more expensive in terms of computation, which can be addressed by the new tool—building simulation.
The emergence of simulation tools has started a new trend in architecture, namely, performance-driven or performance-based architecture [Negendahl 2015; Shi and Yang 2013] argue that:
“Compared with the conventional architectural design methodology, which focuses on space and form, performance-driven design takes a holistic view towards ecological and environmental performances of buildings while ensuring that the functions and esthetics of the design are not overlooked.”
The concept of “form that follows performance” has been implemented in various degrees, ranging from inspirational influence to strict form generation from performance evaluations [Negendahl 2015]. Kalay defines the term “performance” as a measure of the desirability of the predicted behavior of a design solution, which covers non-conventional performance, such as fulfilling social sustainability criteria, in addition to conventional quantity-based performance [Kalay 1999]. Based on this definition, simulation tools can help in evaluating a large part of the performance of a design solution. This holistic view of performance is critical in our quest for improving lighting quality.
To gain a deeper insight into lighting simulation, we need to understand computer simulation as a general problem-solving method in analysis and design to a greater depth. It is important to identify systemic gaps between the outputs of these tools and the final (building) values that
16
are intended to be optimized. For example, illuminance-based metrics are the most widely used metrics calculated in lighting design but they do not directly correlate with subjective visual performance [Cuttle 2004; Cuttle 2015; Van Den Wymelenberg 2013; Veitch and Newsham 1996].
What has been discussed so far concerned the final “user/occupant experience’ or the “end”. However, the “means” to reach the end is also important, that is the “designer experience”. Although, simulation tools has been around for more than a decade, architects and lighting designers travel an uneven road in their design process, which in many occasions, are drawn to use the old rule of thumb methods or, at best, some basic software in their design process [Galasiu and Reinhart 2008; Reinhart and Wienold 2011]. The introduction of BIM as a new design platform has disrupted the designer’s toolkit landscape. At the time of this study, BIM still remains undeveloped and fragmented from different aspects including design experience. Issues regarding the designer experience were also investigated throughout the research. Metrics and criteria for good lighting design evolve with advancement in lighting design, computation technology, simulation techniques, and building design platforms as well as in related science and engineering fields. To move forward in this evolutionary process, a project has been initiated at Civil Engineering and Lighting Science Department of Jönköping University and being conducted in cooperation with Architecture and Built Environment Department of Lund University. The project is comprised of two sub-projects. The first one is titled “criteria for good lighting quality,” which focuses on the interactions between human, light, color and space and how these interactions could be used in the design process to achieve user-centric lighting systems. The second project, which has been the main focus of this research, aimed to study lighting simulation tools and investigate how they can be employed in the design of buildings with good lighting quality.
1.1 Aim
The aim of this thesis was to understand the underlying architecture of lighting simulation and obtain an overview of its characteristics and applications as well as to study the use of current simulation tools. The findings were used to identify potential for improving lighting quality using simulation tools.
1.2 Research Questions
To fulfill the aim of this thesis the following questions were framed and the research effort was directed toward finding answers for them.
1. What are the characteristics of lighting simulation tools and their capabilities for the analysis of lighting quality of indoor spaces?
2. What are the applications of lighting simulation and which tools are currently used in practice?
3. How can lighting simulation tools be improved to provide better lighting quality?
1.3 Research Methods
This dissertation presents multiple studies some of which have been published as papers over the past two years. Because topics such as simulation software tools are within the engineering realm, a quantitative approach was mainly used, implying that the research approach is based on positivism. A qualitative method was also applied to the study by using context analysis.
17
Data collection and research methods of each study were chosen independently which include a combination of literature review and survey.
To answer the first research question “What are the characteristics of lighting simulation tools
and their capabilities for the analysis of lighting quality of indoor spaces?” two different
approaches were used. In the first study (presented in Paper 1) the focus was on understanding the current situation and characteristics of software available in general and to identify the strengths and shortcomings of the selected tools. [Easterbrook and others 2008] categorized this type of question as “exploratory”; it involves the use of existence questions (e.g., What are the existing simulation tools? What are the existing metrics?). It can also involve the use of “descriptive-comparative” questions (e.g., How does tool x differ from y?) for comparing these tools. The answers yielded insight on the current situation.
Using the answers, a systemic analysis was done to get a deeper understanding of the underlying architecture of lighting simulation tools (Chapter 2). This helped in identifying systemic gaps between simulation outputs and the values of interest (i.e., good lighting quality). Literature review was the main method used for data collection in both studies.
The second question, “What are the applications of lighting simulation tools and which tools
are currently used in practice?”, is also categorized as “exploratory”. Two study was conducted
to answer this question. In the first one, current usage of lighting simulation tools was investigated (presented in Paper 2). Data collection was mainly done via an online survey, which was complemented with a literature review to gather information from previous works. In the second study, the applications of simulation tools were studied from literature in a wider scale (Chapter 3).
The findings from the first and second research questions provided a picture of the current state of the lighting simulation tools in terms of software characteristics, application, usage, gaps and shortcomings. The findings also provided a picture of designers’ needs and the issues they are facing in their practices.
The above questions are all classified as “knowledge” questions focused on the understanding of the phenomena. The focus of the third question “How can lighting simulation be improved
in providing better lighting quality?” required using questions concerned with designing better
ways to do software engineering [Simon 1969a]. The design questions (e.g., What’s an effective way to achieve X? where X refers to a better lighting quality analysis using simulation software). This type of questions is necessary when the goal is to design better procedures and tools for carrying out simulation [Wieringa and Heerkens 2006]. To answer the third question, the potentials for improving lighting quality using simulation tools were investigated using the findings from literature reviews and the first and second studies. The results are summarized in Chapter 5.
1.3.1 Methods for data collection
1.3.1.1 Literature review
The purpose of exploring the existing literature was to become familiar with what is already known about the research area. A systematic literature review was done for all the studies. The literature was obtained from secondary sources and documents.
1.3.1.2 Peer reviewed journal and conference articles
Scopus.com, scholar.google.se, and sciencedirect.com were the main bibliographic databases for collecting reliable articles.
18
Some hard copies or electronic books as well as licentiate and doctoral theses relevant to the purpose of the study were reviewed for the data collection.
1.3.1.4 Documents and reports from websites
Relevant documents such as software manuals, online forums and communities related to the tools, reports, websites, and media were also used as sources of information.
1.3.1.5 Survey (online)
Online-survey was conducted to investigate the current use of lighting simulation tools in Sweden.
The online questionnaire was comprised of four types of questions: multiple choice multiple select (checkbox), multiple choice single select (radio button), prioritizable selection list (Drag & Drop Ranking question), and free text. The data analysis was performed using Microsoft Excel. In addition, a qualitative analysis was applied on the textual answers.
For a more detailed description of the methods, see Chapter 4: Appended papers.
1.4 Research Limitation
1. The scope of this research is limited to the visual aspects of lighting quality.
2. The current state of lighting simulation is limited in taking the quantitative aspects of lighting into account. Therefore, most of the investigation was done on the quantitative aspects. However, the potential of simulation techniques in enabling assessment of qualitative aspects was briefly discussed.
3. The focus of this study is on indoor lighting, particularly for office environment. 4. The study of lighting quality was done from an average person’s point of view.
Generalization to other groups such as elderly or people with disabilities should be avoided.
5. The study of software tools usage was limited to Sweden.
6. The literature review was the main data collection method used in gathering information for studying available software. Only literature in English was reviewed.
1.5 Thesis Structure
The simulation tools were reviewed from multiple perspective to provide a picture of the current state of the lighting simulation tools in terms of main characteristics, application, and usage. Then the findings were applied to identify potential improvements. The outline of the dissertation is illustrated in Figure 1.
The theoretical background of computer simulations is presented in Chapter 2. Then, the applications of the current simulation tools investigated are presented in Chapter 3. The author’s previous studies are presented in the form of papers summarized in Chapter 4. The potential for software development is discussed in Chapter 5. The final chapter unifies the findings from all studies and lays the foundation for future work.
19
Figure 1. Outline of the dissertation
Theoretical Background Software Comparison Theoretical Background Applications Designer’s Feedbacks Application of simulation Tools Previous Studies Online Survey Review of Simulation Tools Characteristics Software Development Potentials Applications & Usage
20
2 Theoretical Background: Systems,
Modeling and Simulation
This chapter is dedicated to fundamentals of simulation in general and lighting simulation in particular. The fundamentals help identify systemic gaps between simulation outputs and the target values that designers seek to provide through their designs. This chapter also introduces some of the terminology used throughout this dissertation.
Theories of modeling and simulation are based on systems engineering [Gianni and others 2014] and their computer-based implementations are based on various IT fields. First, this chapter provides general information regarding systems, modeling and simulation. Then, this information is applied to lighting analysis. Systems thinking was also suitable for structuring this chapter and the following is the scheme followed for modeling and simulation [Velten 2009]:
1. Problem and system definitions:
- Definition of a problem that is to be solved
- Definition of a system, that is, a part of reality that concern the problem
2. Systems analysis: Identification of parts of the system that are relevant for the problem 3. Modeling: Development of a model of the system based on the results of the systems
analysis step 4. Simulation:
- Application of the model to the problem - Derivation of a strategy to solve the problem
5. Validation: Does the strategy derived in the simulation step solve the problem for the real system?
2.1 Problem and System Definitions
2.1.1 Problem definition1
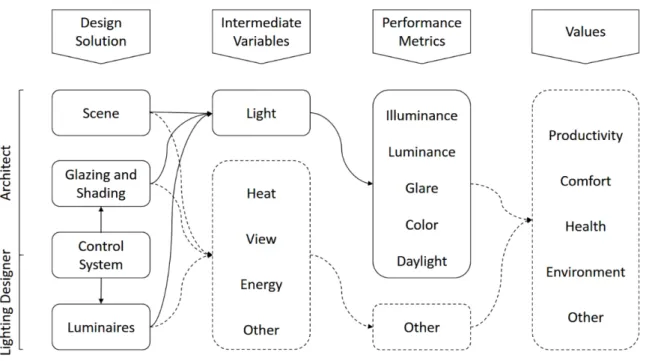
The goal of value-driven building design is to produce a blueprint that maximizes the total value of a building within the constraints imposed by different project stakeholders. The generation of values in a building system occurs through complex interwoven processes consisting of numerous subsystems such as lighting, heating, air conditioning, and so on. Typically, each of these subsystems is designed to provide multiple primary values (e.g., lighting system to provide visibility, visual comfort). In doing so, they affect other systems’ primary purposes (e.g., daylight can increase visibility as well as heat, which is the primary variable in heating systems). These effects are not always positive; for example, increasing daylight has a negative effect on cooling systems, hence, negotiation of variables are unavoidable through a design process. Due to the limits of human knowledge, the effects of these systems’ variables on their target values and their lateral effects on other systems are not fully understood. If we try to illustrate the value stream of a design solution, the result would be a complex network of interwoven nodes. A simplified subgraph of this network that includes only the main nodes pertaining to lighting is illustrated in Figure 2., which only partially captures some of the intricacies discussed so far.
1 It should be clear that this problem definition is specific to lighting simulation as a study subject and not the
21
Figure 2. Value-generation network in building design
In human-centered systems like lighting, value should be assessed relative to the needs of the user, making its quantification complicated. For example, people have different needs and preferences for light levels, distribution, color, and so on. These differences are conventionally dealt with statistical techniques by various standards organizations that set the criteria for good lighting design practices.
To maximize a building’s value, we need to understand the processes that generate value and quantify the variables in this value-generation network. From a quantifiability perspective, values can be classified into four categories: financial, quantifiable, measurable, and observable [Ward and others 2007]. The best category in terms of decision making is, undoubtedly, financial since it can directly be compared against the cost of a design solution. However, in practice, only a fraction of these values can be expressed in financial terms with an acceptable degree of accuracy. Even quantifying the cost of a design solution with high accuracy is next to impossible due to the overwhelming number of uncertainties in the procurement, construction, operations, and maintenance processes. Today, architects and lighting designers are increasingly using simulation software tools to assess and optimize their design solutions. However, a large portion of their design decisions are still based on best practices or intuition rather than on the specificities and dynamics of the project at hand [Galasiu and Veitch 2006; Reinhart and Wienold 2011]. Lighting simulation tools can be used to calculate the various categories of performance metrics (see Figure 2) of a design solution; however, these metrics do not easily and transparently translate into values. This is a systemic gap in evaluating the value-generating network.
2.1.2 System definition
A system is defined as “a collection of entities, for example, people or machines, that act and interact together toward the accomplishment of some logical end” [Kelton and Law 2000]. Another author, [Fritzson 2010], defines system as “an object or a collection of objects whose properties we want to study.”
22
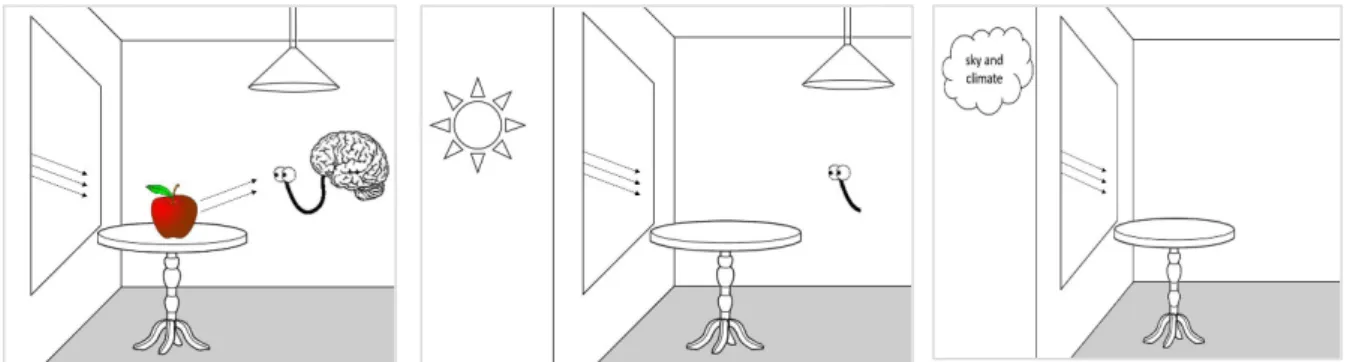
To study a system, it is necessary to define a boundary that separates it from its environment [Velten 2009]. Depending on what aspect of lighting is being studied, different boundaries can be drawn. For example, if the effect of lighting on skin-related health is being studied, the system boundary could be defined at occupant’s skin level on the output end. This, though, is rarely the case in the context of lighting design. Most lighting analysis problems concern the visual effects of light. Elements of a lighting system may include the sky and light fixtures, the interior scene as well as the exterior scene that blocks or guides light toward interior scene (e.g., neighboring buildings, ground.), the visual system (every organ related to visual perception) in which light is given as the input to the system and perception of the objects can be the final output. Light generation inside light sources such as the sun and luminaires always fall outside the system boundary. Figure 3 illustrates the lighting system with three different boundaries drawn in accordance with three example problems.
Figure 3. System boundary defined according to the example problems a) visibility b) dazzling glare c) energy efficiency
2.2 Systems Analysis
In lighting, the system can be broken down into two subsystems: physical (i.e., sky, scene) and human (visual system). The physical system pertains to the objective phenomena while the human system concerns the subjective experience of the system user.
Having the problem domain limited to the visual effects of light, the next step is to draw a boundary for the system. The fact is, though, that calculating visual effects of light is still a broad view of the problem and should further be broken down. As an example on the input side of the boundary, when artificial light is being designed, the light contribution from direct sunlight and diffuse daylight are omitted to ensure the availability of required light during dark periods. Hence, the sky and exterior scene fall outside the system boundary. On the output side of the boundary, visual comfort is a good example to study. A main factor in visual comfort is avoiding glare. Glare has many types including disability, discomfort, and dazzling glare [Hirning 2014] and each requires the boundary to be drawn at different points in the visual system (e.g., iris, retina, associative visual cortex).
Although most problems in lighting design concern the visual effects of light, recently, there has been a growing number of studies on the non-visual effects of light (e.g., circadian effect) [Inanici and others 2015; Mardaljevic and others 2013].
23
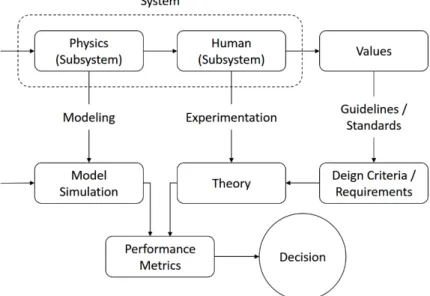
Figure 4. Analysis of systems in lighting
The nature of light (which is a constituent of the physical system) is understood relatively well, which makes it possible to express it in mathematical terms. The visual system, however, is too complex to be expressed yet mathematically. Instead, experiments are the primary means for understanding light perception. The results of these experiments are presented in simple spreadsheets and/or charts that map light settings (as input) to visual performances (as output). For example, illuminance levels are mapped to task visibility. Figure 4 depicts systems involved in lighting and how they are analyzed in lighting design processes.
2.3 Modeling
Before computer simulations became widely available, architects used physical/scale models to establish basic architectural forms for daylight analysis. Although, these models are effective in assessing the effects of fenestration and/or shading techniques on daylight distribution and intensities, the time required for even a quick assessment compared to that for a computer simulation means it is not feasible to use such models. Moreover, physical models are limited in assessing electric lighting and its interaction with daylighting [Steffy 2008]. Ultimately, physical models tend to limit the design process because of their focus on the finite analysis [Viola and Roudsari 2013]. Today, computer modeling and simulation have largely replaced their physical counterparts.
“A computer model represents the key characteristics or behaviors/functions of the selected physical or abstract system or process. Model is different from simulation in that the model represents the system itself, whereas the simulation represents the operation (behavior) of the system over time” [Kosky and others 2015; Steffy 2008].
The advantages of using computer models for obtaining information about behavior of a system are numerous: there is no need to experiment with the original system; there is no threat to the system; results can be obtained quickly; the investigations can cover a much broader range than would be possible with the real system; alternative development paths can be studied and compared; and the costs of the investigations are significantly smaller. The modeling approach also has its disadvantages. Because the model is not the original system, there is always uncertainty about whether it describes the system behavior correctly in all its aspects. However, validation of the model can remove much of this uncertainty as is described later [Bossel 2007].
24
As [Cellier and Kofman 2006] put it, “modeling and simulation is always purpose-driven, that is, we should know the purpose of our potential model before we sit down to create it.” In that sense a model is defined as “to an observer B, an object A' is a model of an object A to the extent that B can use A' to answer questions that interest him about A” [Velten 2009].
An important aspect of the above definition is that it includes the purpose of a model, meaning that the model helps us to answer questions and to solve problems. This is important because beginners in the field of modeling tend to believe that a good model is one that mimics the aspect of reality that it pertains to as closely as possible. Rather, the “best model” is the simplest model that still serves its purpose, meaning that it is still complex enough to help us understand a system and to solve problems [Velten 2009].
One of the simplifications in lighting modeling is applied on the light spectrum. When we are studying visual aspect of light, we are only interested in a narrow spectrum of light wavelength that affects human vision, hence, visual simulation is based on photometry rather than radiometry. The computation of light at each wavelength throughout the visible spectrum is prohibitively time consuming. Since humans have a trichromatic visual system, lighting is commonly simulated through tristimulus color space such that spectral information for lights and materials is defined and computed with the RGB data [Inanici and others 2015]. This simplification might seem natural and appealing; however, in the physical world, the interaction between the lights and materials occurs in full spectrum. Inanici et al. argued “The discrepancies may hinder the accurate computation of color dependent lighting metrics, especially the ones that are not dependent on the Commission Internationale de Eclairage (CIE) photopic spectral sensitivity curves (V(λ)), such as the circadian light” [Inanici and others 2015].
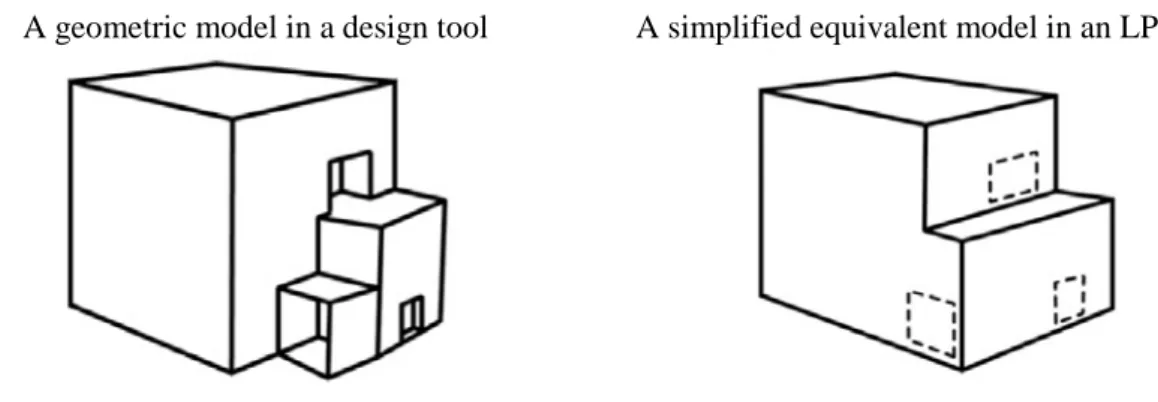
In this regard, modeling has taken two different paths in the building industry. Commonly, modeling is used for representation or information exchange, which is referred to as geometrical models. However, according to the aforementioned definition of the “best model”, geometrical models are often not useful for simulation without preprocessing. A hypothetical example is illustrated in Figure 5 in which a building design is modeled with fewer details in a simulation tool than in a design tool [Negendahl 2015]. In a geometric model of an opaque object only its outer surfaces are needed for lighting simulation. Other properties of interest are surface roughness, specularity, color, etc. A model created for the purpose of simulation is referred to as analytical model or calculation model.
A geometric model in a design tool A simplified equivalent model in an LPS tool
Figure 5. Models for simulation are simplified depending on the problem
Geometrical models are typically created by architects in the design tools while analytical models are usually created or manipulated by lighting designers in lighting performance
25
simulation (LPS) tools [Negendahl 2015]. Figure 6 shows the relation between the user, program environment, and the model type.
Figure 6. Geometrical and analytical models in the context. Modified from [Negendahl 2015]
Processing a geometric model from design software to a LPS environment has often been associated with tedious tasks such as manual export/import, model cleanup, modifications, adjustments, and so on. [Kota and others 2014]. These two different types of models can be integrated; building information modeling and parametric modeling are all closely related to each other and further investigated in Chapter 3.
2.4 Simulation
Simulations are “software systems we construct, execute, and experiment with to understand the behavior of systems. This often includes a process of generating certain natural phenomena through computation” [Chen 2003].
The advantages of computer simulation include the following: use of a common methodology independently of the type of system considered; lower marginal cost of model construction and simulation; ability to shorten or lengthen the time course of dynamic behavior; and dynamics that are not wanted in the real system do not impact the computer model [Bossel 2007]. In lighting, the term “simulation” is used to mean different things depending on the context, and in some cases it refers to a broader concept of lighting design that utilizes simulation internally to calculate lighting performance metrics. Here, we differentiate between lighting design and simulation. We limit the scope of lighting simulation to contain the simulation processes. Typically, only a physical system is simulated as illustrated in Figure 4. Example outputs from these simulations can be luminance, illuminance, and color, which could be processed to calculate performance metrics such as daylight glare probability (DGP) or daylight autonomy (DA), which are used in the lighting design process.
Simulation of behavior can be achieved by two entirely different approaches. The first method is the black-box approach. According to Bossel, its purpose is “to arrive at a description of behavior from observations of one or several identical systems, observing how they behave (output) under different conditions (input), and then using convenient mathematical relationships to relate input to output and imitate the behavior of the real system” [Bossel 2007]. The model generated is referred to as surrogate model. The second approach is the glass-box approach. It is used “to attempt an explanation of behavior by modeling the actual processes of the real system” [Bossel 2007]. In this case, mechanics of the system should be well understood. Hence, the aforementioned physical system can be simulated as a glass-box because its actual processes are known to a great extent. The common algorithms for simulating light are
26
radiosity, ray-tracing, and photon-mapping, which are explained later in this chapter. However, the visual system can only be simulated as a black box because the way the system perceives objects is not well known yet. This approach requires a significant amount of data from experimentation for mapping inputs to outputs to reach an acceptable level of accuracy. For this reason, simulating visual system is not a common practice.
In the following we will explore lighting simulation from different perspectives.
2.4.1 Photo-realistic vs physical-based
Lighting simulations can be divided into two main types depending on the rendering method used. The two type mutually benefit from the development of each other.
Photo-realistic rendering is mainly used for production of artistic images and places. It
emphasizes the appearance of its output rather than the techniques used to derive it. Anything goes, basically, as long as the final image looks nice [Larson and others 1998].
Physically-based rendering (also known as predictive rendering) focuses on accurate
representation and prediction of reality under given conditions and simulates the physical behavior of light as closely as possible in an effort to predict what the final appearance of a design will be. This is not an artist's conception; it is a numerical simulation. The light sources in the calculation emit light with a specific distribution, and the simulation computes the reflections between surfaces until the solution converges. This method was the focus of this research [Larson and others 1998; Ochoa Morales and others 2012]
2.4.2 Glass-box light simulation algorithms
There are two main classes of algorithms for simulating the behavior of light in a glass-box: radiosity and ray-tracing. An extended version of ray-tracing technique is photon-mapping.
Radiosity (radiative flux transfer) is a global illumination algorithm used in 3D computer
graphics rendering. In this technique, the surfaces are divided into patches and these patches exchange light energy within a closed system. This method is usually limited to scenes with diffuse surfaces so that the solution matrix is manageable. Compared to other techniques, radiosity requires less computation power and therefore less time for simple geometries. One advantage of this method is a faster walkthrough view of the scene because the simulation yields the total luminance distribution that is independent of the spectator's viewpoint [Chen 2003; Ochoa and others 2012].
Ray-tracing is a technique for generating an image by tracing the path of light through pixels
in an image plane and simulating the effects of its encounters with virtual objects. The technique is capable of producing a very high degree of visual realism, usually higher than that of typical scanline rendering methods, but at a greater computational cost. Ray-tracing is capable of simulating a wide variety of optical effects such as reflection and refraction, scattering, and dispersion phenomena (such as chromatic aberration). In ray-tracing, each viewpoint requires a new ray tracing run, which can be a problem in walkthrough simulations. The technique is good for simulations where specular and partly specular materials are involved. It is the technique that gives the most physically correct results. There are though still some phenomena that ray tracing cannot simulate accurately, such as diffuse inter-reflections and caustics [Chen 2003; Ochoa and others 2012].
Photon-mapping is a versatile algorithm capable of simulating global illumination including
caustics, diffuse inter-reflections, and participating media in complex scenes. Extending ray-tracing with photon maps yields a method capable of efficiently simulating all types of direct and indirect illumination. Furthermore, the photon map method can handle participating media and is fairly simple to parallelize [Jensen and others 2002].
27
2.4.3 Black-box lighting simulation methods (surrogate models)
A surrogate model (meta-model or emulator) is an approximation model of the original simulation model. In essence, surrogate models use interpolation to generalize the system behavior from a finite number of data points that relate design parameters to design performance [Wortmann and others 2015]. This interpolation can reduce the computational cost of simulation by orders of magnitude, which enables designers to interact with this model and explore the approximate impact of changing design variables. This leads to a better understanding of the design problem and behavior of the system [Wortmann and others 2015]. Surrogate models are diverse and recently gaining traction in the research community. Surrogate models are also extensively used for optimization. Original models are often utilized for validation and refining the results over the surrogate-based optimization process [Nguyen and others 2014]. Surrogate models are among promising solutions for reducing simulation and optimization time.
2.5 Validation
As discussed, models are simplified in line with the purpose of a problem, hence, they are valid, if at all, only for that specific purpose [Bossel 2007]. Similar to scientific theories, the correctness of the models cannot be proven; models cannot be verified. Correct behavior of a model for a specific setting cannot be generalized for other settings, a premise that is the foundation of surrogate modeling. This is most evident in a special type of surrogate models known as Space Mapping in which a course model is constantly refined by a fine model (either through glass-box simulations or data from experiments) throughout the simulation process to better represent reality [Bossel 2007]. A model (or theory) can only be proven false by showing that reality and simulation differ [Bossel 2007; Popper 2005]. Validity can be established by extensive comparison of model results and experimental data but it is only true until evidence to the contrary appears. These data may come from the literature or from experiments that have been designed to validate the model [Velten 2009].
The CIE has established a procedure for evaluating the output performance of lighting simulation packages. The validation approach is based on testing different aspects of lighting simulation by individual test scenarios. The approach includes validation procedure for both artificial and daylighting and is based on theoretical principles where comparison is done with analytically calculated reference data to avoid uncertainties [Maamari and others 2006a; Maamari and others 2006b]. Two types of reference data are used: data based on analytical calculation and data based on experimental measurements. The first is associated with theoretical scenarios that avoid uncertainties in the reference values. The second type is obtained through experimental measurements, where the scenario and the protocol are defined in a manner that minimizes the uncertainties associated with the measurements. A number of simulation tools (Radiance, DAYSIM, VELUX, VISSLA, DIALux) were compared in paper 1 from a validity point of view.
28
3 Applications of Lighting Simulation
Tools
This chapter explores the applications and limitations of lighting simulation tools and the opportunities that they provide for better lighting analysis.
Lighting simulation enables prediction, assessment, and verification of lighting performance, which has a variety of applications in building design, operation, communication, and education. In building design, “the primary purpose of most forms of lighting simulation is to assist in the design [analysis and optimization] process” [Reinhart 2004]. Following is the list of the topics covered in this chapter:
Simulation Output: simulation outputs can be quantitative/numerical or qualitative/visual.
Quantitatively, the programs compute photometric values in physical units in a discrete number of points of space. Qualitatively, the programs generate images of visible radiation comparable to photographs of the real environment [Pellegrino and Caneparo 2001]. In this chapter, metrics calculable only with the help of simulation tools are highlighted.
Stages of design: design process is formally divided into different phases2, including conceptual, preliminary, scheme, and detailed design [Jacobsen 2007]. In this document, the first three phases are referred to as early design stage and the detailed design is referred to as design development stage. Specific applications of lighting simulation in each stage have been studied. Here the focus is on application of lighting simulation in early design and design development stages.
Optimization: in real world projects, designers often have to deal with conflicting design criteria
[Fesanghary and others 2012; Hamdy and others 2011] such as minimum energy consumption versus maximum visual comfort, which increases the need for optimization. Simulation tools have long been used for this purpose; however, the optimization process is still performed manually in the majority of cases, although automated optimization tools are emerging to address this issue. Optimization is discussed from different aspects including optimization issues, complex models, multiple objectives, and integration.
Model integration: while numerous unified tools that act both as a design tool and Building
Performance Simulation (BPS) tool exist, building designers still seem to prefer creating and exploring design options in dedicated design tools. This has caused a fragmentation between building design and performance assessment. Integration of BPS with building design can be investigated from user, tool, and model perspectives, of which the model perspective has been investigated in this study.
BIM: BIM is an emerging design platform [Kota and others 2014] that promises to simplify
modeling for the multiple disciplines involved in the design process. Building Information Modeling and simulation have a major element in common, modeling. The advantages and shortcomings of BIM in relation to lighting simulation are discussed.
Parametric Modeling: parametric modeling (more precisely generative algorithm modeling) is
a recent trend in the AEC industry that is igniting enthusiasm and creativity among researchers and designers. Rhinoceros/Grasshopper popularized parametric modeling. Other design
29
platforms such as Revit and Vectorworks are joining the trend by offering their own suite of visual programming interfaces. The chapter presents integration of lighting simulation tools with parametric modeling and its applications in lighting design as well as some example case studies.
Communication and education: Aside from the main applications of simulation tools, they
provide a tangible medium for communication in the design and construction process as well as a powerful platform for education. These applications of simulation were out of the scope of this research.
3.1 Simulation Output
Boyce argued that the most widely used metrics in today’s lighting design practices are limited in terms of their degree of correlation to the desired values. Recently, efforts have been made to introduce new metrics to overcome these limitations [Boyce and Smet 2014; Rea 2013]. Calculating some of them is not possible without using lighting simulation tools. Data visualization and the different types of image presentations available in these tools can help designers 1) to better interpret the simulation results and compare different alternatives; 2) to communicate among different parties; and 3) attain a better understanding of the system behavior to make informed decisions.
Following are some of the new metrics that must use simulation tools for their calculations: climate-based daylight modeling, annual spatial contrast and annual luminance variability, annual DGP, mean room surface exitance (MRSE), luminance-based metrics’ analysis of non-visual effects of light, data non-visualization, and image non-visualization.
3.1.1 Climate-based daylight modeling
Climate-based daylight modeling (CBDM) is the prediction of various radiant or luminous quantities (e.g., illuminance and luminance) using sun and sky conditions that are derived from standardized annual meteorological datasets [Mardaljevic and others 2009; Reinhart and others 2006]. These metrics are better indicators than the daylight factor in terms of “how skylight and sunlight will be distributed across a space, where and how often visual discomfort caused by glare is likely to occur, and what the stimulus to any ceiling-mounted sensors for an electric lighting or blind control system will be.” [Boyce and Smet 2014]. First, the weather data (e.g., .epw file) is fed as an input to the simulation engine. Then, for a given point in a space, illuminances are calculated depending on the period of time, the climate, the window or skylight arrangement, and the orientation of the building. These illuminances are absolute measures and can be calculated for an assumed arbitrary horizontal or vertical plane [Boyce and Smet 2014]. Some of the daylight CBDM metrics include Daylight Autonomy (DA), Useful Daylight Illuminance (UDI), continuous Daylight Autonomy (cDA), and spatial Daylight Autonomy (sDA). DA is defined as the fraction of the occupied times per year, when the required minimum illuminance level at the point can be maintained by daylight alone [David DiLaura 2011]. UDI is another dynamic daylight performance measure. As its name suggests, it aims to determine when daylight levels are ”useful” for the occupant, that is, neither too dark (100 lx) nor too bright (2000 lx) [Nabil and Mardaljevic 2005; 2006]. In cDA, unlike earlier definitions of DA, partial credit is attributed to time steps when the daylight illuminance lies below the minimum [Reinhart and others 2006]. Spatial daylight autonomy (sDA) measures daylight illuminance sufficiency for a given area. It is defined as the percentage of floor area that meets or exceeds a specified illuminance level for a specified amount of annual hours [Committee 2012].
30
Several Radiance-based daylighting tools that can be used to perform dynamic daylight simulations include: DAYSIM, ESP-r, Lightswitch, SPOT (ver. > 4.0) [Reinhart and others 2006].
3.1.2 Annual spatial contrast and annual luminance variability
Since occupants perceive space from a three-dimensional vantage point, illuminance-based metrics such as DA and UDI cannot express the dynamic nature of sunlight from a human perspective. Rockcastle et al. proposed a new family of metrics that quantify the magnitude of contrast-based visual effects and time-based variation within daylit space through the use of time segmented daylight renderings. Annual spatial contrast provides the designer with a more holistic understanding of when and where sunlight impacts the composition of light and shadow within a person’s field of view [Andersen and others 2013; Rockcastle and Andersen 2012].
3.1.3 Annual daylight glare probability
In measuring both the quality and quantity of light, there are scarcely any factor more difficult to quantify, more subjective, and yet more important to visual comfort, than glare. There are at least seven recognized glare indexes: VCP, UGR, BGI, CGI, DGR, and DGP [Kleindienst and Andersen 2009]. DGP [Wienold and Christoffersen 2006] is regarded as the most reliable index for side-lit office spaces under daylight conditions. Over the years, it has also evolved into dynamic annual metrics such as simplified DGP (DGPs), which provides a comprehensive yearly analysis of glare with limited computational intensity [Jakubiec and Reinhart 2011; Wienold 2009].
3.1.4 Mean room surface exitance
Mean room surface exitance (MRSE) is the average of flux densities existing, or emerging from all surfaces within the space measured in lm/m2 [Cuttle 2013]. It was introduced by Cuttle, the prime advocate for reforming the current state of internal lighting standards. Central to Cuttle’s proposal is considering a more holistic design approach that better relates to what we see [Cuttle 2004; Cuttle 2008; Cuttle 2009; 2013; Cuttle 2015]. Duff proposed a method that utilizes a Radiance lighting simulation engine to calculate MRSE, and high dynamic range (HDR) imaging to estimate levels of MRSE in the field [Duff and others 2015].
3.1.5 Luminance-based metrics
Luminance-based metrics are a generation of metrics that have become calculable thanks to simulation tools. They are established in the research community but need to receive more attention from the industry. Different studies show that luminance-based metrics had a higher correlation to visual performance than illuminance-based metrics did [Gilchrist 2007; Van Den Wymelenberg and Inanici 2015; Zaikina and others 2014]. A number of researchers and the CIE Technical Committee members (TC 3-45) are promoting luminance-based metrics for lighting design [Nakamura 2011].
[Rockcastle and Andersen 2012] classified the existing luminance-based metrics into two main categories. One is the metrics that can predict glare-based discomfort due to high ratios of contrast within the visual field, (e.g., DGP and DGPs). The other is metrics that can evaluate luminance ratios or ranges to infer human preferences for brightness and composition, (e.g., annual spatial contrast and annual luminance variability).
Lighting simulation tools enable the shift from illuminance-based lighting design (that is easier to measure and calculate) to luminance-based design.
3.1.6 Analysis of non-visual effects of light
Lighting simulation tools are developed, used, and validated mainly for computing the visual aspects of lighting. But in recent years, the non-visual effects of light have attracted the attention
31
of researchers. Multi-spectral simulations, which account for the complex interactions of wavelengths between skies, glazing, color in space, and a point of view, can be used to design and analyze circadian lighting in built environments [Inanici and others 2015].
3.1.7 Data visualization
Meaningful data visualization can assist designers in making better design judgments. Some of the data visualization types are histogram, scatter plots, surface plots, tree maps, parallel coordinate plots, contour plots, and gradient vector fields [Pousman and others 2007]. Parallel coordinate plot is especially interesting for qualitative sensitivity analysis and becoming popular in parametric simulations (See Figure 10 in parametric modeling). The emergence of big data gave rise to the modern data visualization techniques which could be utilized in analyzing ever increasing amount data generated throughout the lighting performance assessment process. This new data visualization technologies can greatly help in realizing “form follows data” idea [Ganji Kheybari and others 2015].
3.1.8 Image visualization
Lighting software offers fairly quick and rough visualizations or fairly lengthy and detailed renderings. Once the computer model is established, it is quite convenient to review various lighting scheme’s effects on architecture [Steffy 2008]. The software can generate variety of visualization types including false color and iso-contour image, HDR image, annual overview, animation, and so on.
3.2 Stage of Design
Lighting simulation tools can be used in all stages of design. However, since the gains of using these tools in early design stage is higher than other stages, the early stage is discussed in detail in this paper. The design development stage is the primary stage of design and has been at the focus in other literature, therefore, it has been discussed only to a limited extent here.
3.2.1 Early design stage
In building design and construction, the cost of change increases significantly as the design and construction process proceeds. In that sense, gaining knowledge about building performance via simulation in the early design stage can lead to a large savings [Negendahl 2015].
During the early design stage, architects need to interactively compare the outcome of their intentions. Ochoa et al. identifies three characteristics of simulation in this stage as 1) to compare between alternative design solutions; 2) to suggest solutions; and 3) to model with few detail [Ochoa Morales and others 2012].
One of the difficulties designers face in the early design stage is having to deal with an overwhelming number of uncertainties. Rezaee et al. [Rezaee and others 2014] proposed a method based on probability theories to deal with these uncertainties. Another issue is the long computational time in lighting simulations [Sarawgi 2006]. This issue can be solved by adjusting simulation parameters or choosing fast algorithms such as radiosity. The downside is reduced accuracy, which is, in most cases, acceptable in the early design stage. Despite these issues, parametric modeling, a positive trend that has emerged in recent years, is benefiting the early design stage more than the other stages of design (see more in the parametric modeling section). “This trend is fundamentally changing building design into a faster, performance-aware and more flexible process, which eases the production of multiple design alternatives” [Negendahl 2015].
32
Building performance sketch, a concept for sketching building performance early in building design, proposes the selection of the most expressive tool for each purposes. Donn et al. explored some of the comprehensive simulation tools that might be used to sketch performance during design conceptualization. Lightsolve, LiteVis, Daylight 1-2-3, SPOT, COMFEN, and Ecotect are some of the tools that have been developed with the early design stage in mind [Donn 2010].
3.2.2 Design development
Ochoa et al. identifies three requirements for designers in the design development stage: 1) exploration behavior of design under artificial and daylighting; 2) exploration of functional properties; 3) and refinement of element behavior [Ochoa and others 2012].
Current lighting simulation models can be used after critical parameters such as massing, building position, windows size, and orientation. Reinhart et al. elaborates on the considerations and steps for proper daylight simulation [Reinhart 2011]. Artificial lighting has long been at the focus of lighting designers and computerization of design process sought to address this need. Today, a wide variety of electrical lighting design tools are available in the market. Achieving an optimal performance for specific building components such as glazing and redirecting systems [Page and others 2007] or shades and blinds [Al-Shareef and others 2001] require expert knowledge. [Ochoa and others 2012]
Some of the software tools that can be used in the design development stage are AGi32, ElumTools for Revit, DIALux, Relux, SunTools for AutoCAD, LightUp for SketchUp, and SIMMODEL [O'Donnell 2013].
3.3 Optimization
As elaborated in Chapter 2 and Figure 2 different building elements and systems interact to achieve a variety of values, raising the need to optimize a design solution that is considering multiple objectives, even within a single system such as lighting. In reality, building consists of multiple subsystems, increasing the already complex optimization problem. These subsystems need to be treated as a complete optimized entity rather than the sum of a number of separately designed and optimized subsystems or components [Trcka and Hensen 2007]. Manual optimization of a design problem is achieved by iterative modifications and evaluations of solutions. The performance of each solution is calculated and compared at which point simulation comes into play [Attia and others 2013] Design variables such as window size are modified and simulated. Then, designers try to construct a hypothesis about the relation between the input change and various resulting performance indicators. This hypothesis may not be clear especially when there are numerous parameters to be studied and possibly due to the nonlinearity of the problem. This is an inefficient procedure in time and labor, so achieving an optimal solution is not always guaranteed. To overcome such difficulties, automated simulation based BPO search techniques are used [Attia and others 2013].
“Automated BPO is a process that aims at the selection of the optimal solutions from a set of available alternatives for a given design, according to a set of performance criteria. Such criteria are expressed as mathematical functions, called objective functions. Automated optimization is a combination of different types of optimization algorithms, setting each algorithm to optimize one or various design functions” [Attia and others 2013].
33
A typical strategy of the simulation-based optimization is presented in Error!
Reference source not found..
Figure 7. The coupling loop applied to simulation-based optimization in building performance studies [Nguyen
and others 2014]
3.3.1 Optimization Issues
The main difficulties in solving building optimization problems by simulation-based methods pertain to the complex natures of building simulation outputs, the expensive computational cost, the scale of the problems, multi-objective design problems, and the uncertainty of many factors during the optimization. The uncertainty includes design variables, environmental variables, model and constraint uncertainty, and so on. Moreover, errors may occur during the optimization process due to insolvable solution spaces, infeasible combination of variables (for instance, windows area that extend the boundary of a surface), output reading errors, and so on. A single simulation failure may halt the entire optimization process. Running parametric simulations before the optimization process can help in minimizing such errors. Some optimization algorithms may fail to draw a distinction between a local optimal solution and a global one (or fall into a trap by a local one), and consider the local optimum as the final solution to the problem. To avoid this issue, new simulation tools should be developed with adjustable precision for solvers that might cause large discontinuities in the outputs [Nguyen and others 2014].
Several optimization tools have been developed but their adoption remains limited mostly to the research community due to the problems in coupling strategies, usability, flexibility, and efficiency in term of both time and performance improvement [Nguyen and others 2014].
3.3.2 Multi-objective optimization in lighting design
In lighting design problems, designers often have to deal with conflicting design criteria such as maximizing daylight and minimizing glare [Wortmann and others 2015]. This is a common issue in many application domains. For this reason, multi-objective optimization (MOO) has long been an active field of research [Köksalan and others 2011; Viola and Roudsari 2013]. Since a single best solution does not exist for MOO-problems, one approach is to provide multiple solutions to the decision maker, also known as a Pareto set [Sorger and others 2016]. The Pareto method does not solve the optimization problem, rather, transforms it from an engineering domain to a managerial domain, which means the problem can be dealt with the feedback from the stakeholders. This process is known as the multi-criteria decision making. Many decision-making techniques have been developed [Triantaphyllou 2013] such as pros and cons, simple prioritization, satisficing, opportunity cost, and bureaucratic, the details of which is out of the scope of this thesis. Another approach is to weight the objectives in order to attain
![Figure 6. Geometrical and analytical models in the context. Modified from [Negendahl 2015]](https://thumb-eu.123doks.com/thumbv2/5dokorg/4622158.119291/25.892.278.617.167.371/figure-geometrical-analytical-models-context-modified-negendahl.webp)
![Figure 7. The coupling loop applied to simulation-based optimization in building performance studies [Nguyen and others 2014]](https://thumb-eu.123doks.com/thumbv2/5dokorg/4622158.119291/33.892.242.645.164.404/figure-coupling-applied-simulation-optimization-building-performance-studies.webp)