D
EVELOPMENT OF
P
RODUCTION
C
ONCEPT
Master Thesis, Innovative Production
30 credits, D-level
Sandra Anderstig Daniel Eklund
Authors:
Sandra Anderstig
Daniel Eklund
Topic:
Development of Production Concept
Commissioned by: ABB AB Control Products
Tutors:
Cecilia Ek, ABB AB Control Products
Mats Jackson, Mälardalen University
Examiner:
Sabah Audo
Publicated year:
2012
Language:
English
Number of pages: 94
E
XECUTIVE
S
UMMARY
This Master thesis is within the area of innovative production. The authors are Master students at Mälardalen University in the field of production and process development. The purpose of the thesis is to design a production development process and to apply it in the case study performed at ABB AB Control Products in Västerås, Sweden. The new production concept developed is needed due to several changes in production of large size contactors that will take place during 2012; a new product size will be introduced, a new design of current products will be implemented, and production capacity for future increasing demands must be investigated.
The approach to generate the production concept has been based on theoretical methods and models with focus on the lean philosophy. Through the theoretical framework a process for production development has been designed with the stages; Planning and
Preparation, Current State Analyze, Concept Generation, Concept Analyze and Selection, and Visualization of Concept. The outcome of the thesis project is
a mapping and disturbance analyze of current production, and a new production concept with an automation solution and a new balancing of the production line included. Finally the new production concept has been visualized in a 3D-simulation model.
The main differences of the new production concept compared to current production is that conveyors are used as transportation system through the entire production process and two parallel flows is used in the production line in aim to shorten the lead time.
A
CKNOWLEDGEMENTS
This Master thesis has given us experience and knowledge concerning production development and the methods and tools that can be applied in the development of a production process. We would like to thank Cecilia Ek and Mari Erixon at ABB Control Products for information, support and discussions. Thanks to Mats Jackson, Mälardalen University, for the guiding and support in the project. Thanks to LÅ-Konsult AB, Hallstahammar for investigating a possible automation solution and giving us figures.
Last but not least thanks to all involved at ABB Control Products that has increased the validity and reliability of this project. Sandra Anderstig and Daniel Eklund
D
ICTIONARY
Process: Sequence of interdependent and linked procedures which, at
every stage, consume one or more resources to convert inputs (data, material, parts, etc.) into outputs. These outputs then serve as inputs for the next stage until a known goal or end result is reached.
Logistics: The planning, execution and control of supply, movement and
positioning of personnel, material and other resources in order to achieve the objectives of a plan or strategy etc.
Resources: An economic or productive factor required to accomplish an
activity (employee time, energy, machines, money, etc).
Value-added work: Activities that generates output that is considered
more valuable by its internal and/or external customers than the inputs consumed in producing it.
Non value-added work: Activities that generates zero or negative return on
the investment of resources.
Push-system: Manufacturing system in which production is based on a
projected production plan and where information flows from management to the market; the same direction as the materials flow.
Pull-system: Manufacturing system in which production is based on
actual daily demand (sales), and where information flows from market to management in a direction opposite to traditional (push) systems.
Value chain: Interlinked value-adding activities that convert inputs into
outputs which, in turn, help to create competitive advantage.
Lead time: Number of minutes, hours, or days that must be allowed for
the completion of an operation or process.
Cycle time: The period required to complete one cycle of an operation; or
to complete a function, job, or task from start to finish.
Kanban: A material requirement planning technique developed by
Toyota Corporation in which work-centers signal when they wish to withdraw parts from feeding operations or the supply bins.
One-piece flow: Is the method of production in which operators or
machines work on single units and pass them along to the next process when requested.
T
ABLE OF CONTENT
DEVELOPMENT OF PRODUCTION CONCEPT ... I
EXECUTIVE SUMMARY ... III
ACKNOWLEDGEMENTS ... V DICTIONARY ... VII TABLE OF CONTENT ... X 1. INTRODUCTION ... 1 1.1 BACKGROUND ... 1 1.2 PROBLEM STATEMENT ... 2 1.3 AIM OF PROJECT ... 2 1.3.1 Research Questions ... 2 1.4 PROJECT DIRECTIVES ... 3 1.5 PROJECT DELIMITATIONS ... 3 1.6 COMPANY DESCRIPTION ... 4 1.6.1 Product Description ... 4 2. METHODOLOGY ... 6 2.1 APPROACH ... 6 2.1.1 Qualitative Study ... 7 2.1.2 Case Study ... 8
2.2 DATA- AND INFORMATION COLLECTION ... 8
2.2.1 Literature Study ... 9
2.2.2 Observations ... 9
2.2.4 Documentation ... 11
2.3 IDEA GENERATION ...11
2.3.1 Brainstorming ... 11
2.3.2 Benchmarking ... 12
2.4 RELIABILITY AND VALIDITY ...13
2.4.1 References ... 13
2.4.2 Result ... 14
3. THEORY ...15
3.1 STRATEGIES AND METHODOLOGIES ...15
3.1.1 DMAIC ... 15
3.1.2 PDSA-Cycle ... 16
3.1.3 Guidelines for Layout Development ... 17
3.2 PRODUCTION SYSTEM ...18
3.3 LEAN PHILOSOPHY ...19
3.3.1 Go and See for Yourself (Genchi Genbutsu) ... 20
3.3.2 Just-in-time ... 21
3.3.3 Visual Control ... 21
3.3.4 Standardization ... 22
3.3.5 Level out the Workload... 22
3.3.6 Lean Ergonomics ... 23
3.4 LEAN TOOLS ...24
3.4.1 Value Stream Map ... 25
3.4.2 Fish-bone Diagram (Ishikawa) ... 25
3.5 QUALITY ...26
3.6 KITTING ...27
3.7 CUSTOMER ORDERING DECOUPLING POINT ...27
3.8 PRODUCTION PROCESSES ...29 3.9 LAYOUT ...32 3.10 AUTOMATION ...34 3.10.1 Supporting Technology ... 34 3.11 SIMULATION MODEL ...35 3.11.1 Simulation Model in 3D ... 36 3.12 CALCULATION METHODS ...36 3.12.1 Line Balancing ... 37 3.12.2 Utilization ... 38 3.13 ANALYZE TOOLS ...39 3.13.1 FMEA ... 39
3.13.2 Investment and Saving Calculations ... 39
3.13.3 SWOT-analyze ... 40
4. CURRENT STATE ANALYZE ...41
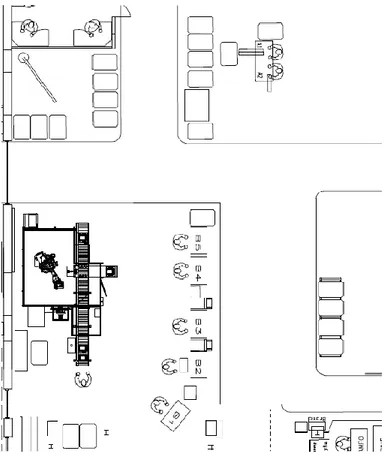
4.1 PROCESS FLOW ...41
4.2 LAYOUT ...42
4.3 MATERIAL HANDLING AND LOGISTICS ...43
4.4 PRODUCTION EQUIPMENT ...44
4.5 PRODUCTION PLANNING ...44
4.6 QUALITY CONTROL ...45
4.7 ERGONOMICS ...45
4.8 MANNING AND PRODUCTION VOLUME ...46
4.8.1 Working Hours ... 46
4.8.2 Production Volume... 47
4.8.3 Reliability and Ability of Delivery ... 47
4.9 TIME STUDY ...47
4.9.1 AviX-Study ... 47
4.9.2 Value Stream Map ... 49
4.9.3 Bottlenecks ... 51
4.9.4 Setup time, Changeovers and Maintenance ... 51
4.10 CAPACITY AND UTILIZATION ...52
4.11 DISTURBANCE ANALYSIS ...52
4.11.1 Fish-bone Diagram (Ishikawa) ... 52
4.11BENCHMARKING ...53
4.11.1 NAFC... 53
4.11.2 A-line ... 54
4.12 NEW PRODUCT DESIGN STATE ...54
4.12.1 Process Steps ... 55
4.12.2 Material Differences between the Product Types... 55
4.12.3 Precedence Diagram ... 55
4.12.4 Requirements for the new concept design ... 56
4.12.5 Available Floor Space ... 58
5. CONCEPT GENERATION ...58
5.1 LEAN PERSPECTIVE ...60
5.2 CONCEPT 1 ...62
5.3 CONCEPT 2 ...64
6.1 FMEA ...68
6.2 INVESTMENT &SAVING CALCULATIONS –CONCEPT 1 ...68
6.2.1 Estimated Investment Cost ... 69
6.2.2 Production Volume Scenarios... 69
6.3 INVESTMENT &SAVING CALCULATIONS –CONCEPT 2&3 ...70
6.3.1 Estimated Investment Cost ... 70
6.3.2 Production volume scenarios ... 70
6.3.3 Estimated Pay-Off ... 71
6.4 SWOT-ANALYZE ...72
6.4.1 Concept 1 (C1) ... 72
6.4.2 Concept 2 (C2) ... 73
6.4.3 Concept 3 (C3) ... 73
6.4.4 Comparison of the Concepts ... 74
6.5 SELECTION OF CONCEPT ...74
7.DEVELOPMENT OF SELECTED CONCEPT ...75
7.1 AUTOMATION SOLUTION ...75
7.1.1 Estimated Pay-Off ... 77
7.2 DEVELOPED CONCEPT DESIGN ...77
7.3 QUALITY INSURANCE SOLUTIONS ...79
8. VISUALIZATION OF CONCEPT ...81
9. DISCUSSION OF RESEARCH QUESTIONS ...84
10. CONCLUSIONS &RECOMMENDATIONS ...87
APPENDICES
Appendix 1 – Contactor components Appendix 2 – Contactor dimensions
Appendix 3 – Contactor dimensions AF2650 Appendix 4 – Production Volume 2011 Appendix 5 – AviX: Time Study Appendix 6 – AviX: Losses Appendix 7 – Process Steps
Appendix 8 – Concept 1, Balancing Appendix 9 – Concept 2, Balancing Appendix 10 – Concept 3, Balancing Appendix 11 – FMEA
1.
I
NTRODUCTION
This chapter introduces the background, the aim and the delimitations of the project.
1.1 Background
The interest for production questions has lately increased both nationally and internationally. The reason is the industrial structure change that can be seen in the western countries due to the rising competition from the low-cost countries. When many companies move their production abroad, production is not just a question for individual companies, but a social issue.
To stay competitive in today’s industry it is necessary to understand how production system can be designed and deployed in aim to enable competitive industrial production. Thus the need of production development and such processes increases to create effective production processes and develop production capacity.
Many companies turn to lean manufacturing and continuous improvements in order to stay competitive. Lean manufacturing is a philosophy to create more value for less work. It is an operational strategy oriented toward achieving the shortest possible cycle time by eliminating waste. It is derived from the Toyota Production System and its key thrust is to increase the value-added work by eliminating waste and reducing incidental work.
1.2 Problem Statement
One of the companies that are focusing on production development is ABB Control Products. During year 2012, several changes will be introduced at the department PCAF that will affect the production of the large size contactors.
A new product size will be introduced; AF2650.
A new design of the products AF1350-2050 and GAF1650-2050 will be implemented.
Production capacity of the product type GAF, which was introduced in 2011, must be able to meet possible increased demand.
These changes demand a new design of a production concept that achieves a more effective production process with high quality.
1.3 Aim of Project
The purpose of the thesis is to design a production development process and to apply it in the case study performed at ABB Control Products in Västerås, Sweden. The aim of the case study is to generate a new production concept within ABB Control Products for the large size contactors (models GAF1650-2050 and AF1350-2650), due to the new product (AF2650) and the changed design of present products that is going to be implemented. The approach to generate the production concept will be based on theoretical methods and models, and the result will be a conceptual production concept.
1.3.1 Research Questions
To generate a new production concept; a production development process need to be followed. A theoretical framework will therefore focus on production development process; methods, models, and tools.
Thus the theory chapter will cover the questions;
- How can a general production development process be designed in
purpose to achieve a more efficient production?
- Which tools and models can be used?
1.4 Project Directives
ABB Control Products requires a conceptual production concept that can be used as a basis for development and implementation of the concept. Factors that need to be considered are:
Production Capacity
Ergonomics
Quality demands
Available floor space
Material handling
Levelling of production flow
Flexibility
Economic aspect
1.5 Project Delimitations
The solution will be presented as a conceptual production concept for the department PCAF at ABB Control Products regarding the products:
GAF1650 GAF2050 AF1350 AF1650(T) AF2050 AF2650
The concept will include the production flow regarding these products, from input of material in the first assembly step until the products enter the test cell. The production concept will not include the material flow
neither any detailed technical solutions, i.e. it will result in a pre-study for a potential implementation.
The project is limited to 30 credits and will be performed during one semester.
1.6 Company Description
ABB is one of the world’s leading engineering companies in power technology and industrial automation. In Sweden, ABB are located in more than 30 regions and has approximately 8 700 employees. ABB is divided into several divisions. ABB Control Products is within the Low Voltage Products division, which is developing, producing, and marketing products and solutions that controls and direct electrical energy for voltage up to 1000 V. Safety products and solutions for machinery are also developed.
ABB Control Products is located in Västerås, Sweden, and has the main responsibility regarding contactors, soft starters, and pilot devices. The customers are located worldwide and are in the sectors of original equipment manufacturer (OEM), wholesalers, industry, distribution, and consultants. There are approximately 300 employees at the local business unit ABB Control Products in Västerås.
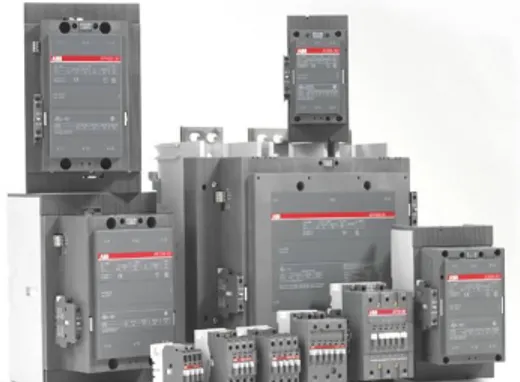
1.6.1 Product Description
A contactor connects, conducts and switches current. ABB’s contactors can manage up to 1000 V AC and DC. Figure 1 shows the product family of contactors produced at ABB. Applications for contactors are areas where resistive loads, distribution and isolation are needed, for example
in power supply, wind and solar power. It can also be used for switching, inching and jogging motors. The two product types that are investigated in this thesis are GAF, which is switching DC and AF, which switches AC. Appendix 1 shows which components a contactor consists of in general. In appendix 2 the dimension of the product models AF1350-2050 and GAF2650-2050 can be seen, and appendix 3 shows the dimensions for AF2650.
2.
METHODOLOGY
There are several scientific methods that can be applied when performing a thesis. In this chapter the method chosen to be used in this case will be explained and motivated.
2.1 Approach
Aware choices and use of research methods are important in order to achieve scientific results [Ejvegård, 2007]. The method chosen in this project works as general rules for how a scientific research should be performed [Hartman, 2004].
The thesis project will include a theoretical study based on the lean philosophy that acts as a framework for the process used in the empirical part; tools and methods. Thus through the theoretical part a production development process has been designed with different process stages that will result in a new production concept.
In order to reach a suitable result for this project, an adjusted strategy based upon a combination of different strategies has been developed. The strategy developed and followed in this project is a combination of three models; DMAIC, PDSA-cycle, and guidelines for layout development, those will be further presented in the theory chapter.
The developed strategy for a production development process resulted in a five-stage process and can be seen in figure 2.
Figure 2: The developed five-stage strategy designed and followed in the project.
1. Planning and Preparation - a project plan is developed and background facts for different methodologies and systems are gathered.
2. Current State Analyze - data collection and analysis of the process as it works today is performed.
3. Concept Generation - concepts are generated to establish different possible solutions.
4. Concept Analyze and Selection - the concepts are analyzed and compared to each other and the best option is selected.
5. Visualization of Concept - the selected concept is further developed and visualized.
2.1.1 Qualitative Study
Qualitative and quantitative studies are two ways to investigate areas. A quantitative study should be made measurable and the result presented numerically whilst qualitative studies consider aspects not possible to measure or weigh [Andersen, 1994; Hartman, 2004]. In this thesis essentially qualitative studies are used as a basis for investigations. A qualitative study investigates things that cannot be measured or weighed. The aspect is that every phenomenon consists of unique combination of qualities or properties and therefore cannot be classified numerically [Andersen, 1994]. It characterizes of the aim to reach an understanding of the behaviour and surrounding of an individual or group of subjects; the way they interact with their environment and the way they see themselves [Hartman, 2004]. The investigation object shall
Planning & Preparation Current State Analyze Concept Generation Concept Analyze & Selection Visualization of Concept
be perceived as a subject and the investigator participates in a two-way communication [Andersen, 1994].
Qualitative studies are not a standardized working method and it exist a spectrum of varieties of methods to use. It is also usual within science to design and apply own varieties and interpretations of qualitative methods. There is therefore rarely a simple procedure or routine to apply when a qualitative study is going to be performed [Patel & Davidson, 2003].
Qualitative studies in this thesis were used to collect information in purpose to grasp deep knowledge and understanding of the subject. This thesis is qualitative through repeated observations in the production process and trough discussions with employees at ABB Control Products.
2.1.2 Case Study
Studies where phenomenons are investigated in detail are called case studies. It can be studies of programmes, a certain situation, persons or a group of people, an institution, or a social unit [Merriam, 1994]. Performing a case study means following or being a part of an event. There are no specific restrictions for what methods to be used for collecting and analyzing the information; case studies includes several data collection methods, depending on what kind of research perspective the study has [Merriam, 1994; Olsson & Sörensen, 2007]. Case studies help to get insights in unexpected circumstances that have been unclear or misunderstood [Olsson & Sörensen, 2007].
The case study in this project focused on the production cell for large sized contactors, which has been studied and explained in detail. A case study was performed to get the information and insight needed to be able to generate dependable and suitable concepts.
2.2 Data- and Information Collection
The collection of data and information is performed through different qualitative collection methods that are divided into primary and secondary data; literature and case study, observations, interviews and documentation collection.
2.2.1 Literature Study
Literature studies are a common method used in thesis works and other investigations. Literature studies must cover background, purpose, frame of questions, and collection methods etc. The literature used is an information source, which means it must differ from the collected literature for the study [Olsson & Sörensen, 2007]. To find the most relevant information for the subject the best way is to start with the general information within the subject and later on look into the specified literature sources, from the latest published to older sources; books, scientific articles and journals [Andersen, 1994].
The literature study in this project is focused on the subject of this thesis, collected from books, journals, and scientific articles.
2.2.2 Observations
Observations can be both qualitative and quantitative and are performed direct, indirect or through participation. The goal with observation is to gather knowledge regarding behaviour and happenings in reality or in laboratory situations where certain behaviours and reactions are tested [Hartman, 2004].
Direct observation is everything that can be seen around the observer; TV and video recording of testing subjects is also a direct observation. When measured values are read from measure devices it is classified as indirect observations. Participating observation is studies that should be done unnoticed and without warning to achieve a valid result. The observer’s role is significant for the validity of the investigations, and field notes should be taken meanwhile. Observations can also be structured and unstructured. Structured observation has a well performed frame, that indicates which situations and behaviours will be observed, for example hypothesis testing. Unstructured observations are made in order to exploration purposes to collect as much information as possible in a certain problem area [Hartman, 2004; Olsson & Sörensen, 2007].
Three important questions are to be asked before starting an observation, no matter what observation type is used [Olsson & Sörensen, 2007];
- What shall be observed?
- How will the observation be registered?
- How shall the observer relate to the observation occasion? Observations performed in this project are both direct and indirect. The direct observations performed to generate facts and analysis of the production process includes; physically studies in the production process and video studies. The manually performed studies were done through time studies in each processing step, repeated five times for each workstation, with different operators. The video study analysing program used is AviX Method, in purpose to clarify possible wastes and ergonomic problems to be able to eliminate them and improve the process. The video analyze was performed in the entire production process, and then analyzed in the program and compared to the manually collected time studies. Figures have also been collected through indirect observations from data bases etc. Unstructured observations have been performed in the production when studying the processes, behaviours, and ergonomics.
2.2.3 Interviews
Interviews are done through questions in order to gather information from the interviewed person’s point of view. There are usually three types of dialogues in an interview; logical conceptual discussions, emotional personal discussion, and empirical discussion regarding the everyday world. It is important to be sure of the purpose and the problem statement before starting with investigating by interviews. Standardized interviews are interviews that are not changed depending on who is interviewed, and the questions are asked in the same order and the same way. Interviews are also divided into different rate of structuring; high structured interviews are structured in a way so the questions are understood in a similar way of every respondent, while
low structured interviews are more open for the interviewed person to interpret the questions because of language barriers, experiences, values, wishes, and so on [Hartman, 2004; Olsson & Sörensen, 2007].
Interviews and discussions with employees at ABB Control Products have been a central part to gather information for this thesis. Discussions during meetings and everyday discussions have involved employees with different positions within the company; production managing, production engineering, production planning, quality control, product engineering, marketing, and operators. Regularly meetings has been a basis for a great deal of the information, approximately hold at least once every week, and with a duration between 1-1.5 hours every opportunity.
2.2.4 Documentation
Secondary data is already existing information; process/register data or information collected by other researchers [Olsson & Sörensen, 2007]. Information from the company’s data base and intranet has been used to collect secondary data; current production rate and figures from the business plan for future demands etc.
2.3 Idea Generation
There are different idea generation methods that can be used to generate different ideas and solutions. In this thesis brainstorming and benchmarking has been used.
2.3.1 Brainstorming
Brainstorming is one of the most common idea generation methods in group creativity. The process steps for idea generation in brainstorming are based upon four rules [VanGundy, 1984]:
1. Criticism is prohibited 2. Freewheeling is desirable 3. Quantity is pursued
The method is performed through discussions among a group. The most critical rule that must be followed to make brainstorming a successful tool is the first one; to be open for all ideas without judging. There are many advantages of brainstorming when the rules are followed; many ideas are generated in a short period of time, it provides experience for the participants, and it generates social interaction needs. On the other hand, verbal interactions and conflicts between members in the group can decrease the creativity in the entire group. Some of the disadvantageous that can appear in brainstorming is that culture or status differences can be a habit for freewheeling, and in some cases working face-to-face can create pressure for some members. Another risk that sometimes comes with cohesiveness is “groupthink” which decreases the range of ideas [VanGrundy, 1984].
Brainstorming was applied in the concept generation to create as many concepts as possible. The brainstorming was performed by the authors of this thesis, and also together with supervisors and employees at ABB Control Products. The duration of the brainstorming sessions varied between 0.5-1.5 hours, taking place five times.
2.3.2 Benchmarking
Benchmarking is a popular tool for evaluation and self-improvement in industry and commerce. The process involves analysing performance, practices, and processes within and between organizations and industries, in purpose to obtain information for self-improvement. Learning from others and adapting the best practises is a distinctive feature of the benchmarking process [Jackson & Lund, 2000].
At the simplest level benchmarking can be seen as a strategy for enabling people to think outside the boxes they normally inhabit. But it can also be viewed as a learning process where those involved in the process learn to compare their service/activities/products in order to identify their comparative strengths and weaknesses as a basis for self-improvement. It offers a way of identifying better ways of doing things and understanding of why they are better. These insight can be used to
implement changes that will improve the own performance [Jackson & Lund, 2000].
Benchmarking of two other production departments at ABB Control Products has been used as inspiration for this thesis.
2.4 Reliability and Validity
To reach reliability and validity some aspects of the techniques used must be considered. Measurements, parameters, measurement instruments, tests and investigation methods must be reliable and valid to be useful and appropriate. If these demands are not met, the research result has no scientific value [Ejvegård, 2007].
Reliability indicates the dependability and the usability of a measurement instrument and unit of measure. Validity refers to if the researcher measured what was supposed to be measured [Ejvegård, 2007].
2.4.1 References
To have dependable references is an important factor of the reliability and validity of a research. It is then important to be able to distinguish which references are trustworthy or not. Factors to consider when choosing references are [Merriam, 1994]:
The authority of the author of the source; has the author made an extensive empirical work or introduced innovative theories which in turn given rise to new research?
The year when the source was written; use the latest published research.
The relevance of the source; is the source’s research closed connected to the own topic?
The quality of the source; has the source a thoughtful analyze, well planned research, and an original way to consider the topic? Suitable sources for articles and journals were found by searching at
google scholar and selecting published articles and journals in the same
dates to avoid obsolete information. References were also found and gathered in already published work in the same research area as this thesis. Educational literature has also been a foundation for the literature study. The reference system followed in this thesis is the Harvard system.
2.4.2 Result
Validity and reliability of the results will aim to be fulfilled by designing the production concepts based on the theoretical and empirical framework, in combination with meeting the given directives; production capacity, ergonomics, quality demands, available floor space, material handling, levelling of production flow, flexibility, and economy aspect.
Established analyzing tools like value stream mapping and a fish-bone diagram have been designed to find problem areas. Also, standardized times given from the AviX Method program has increased the validity and reliability of the time study. All results has been discussed, analyzed, and tested together with ABB.
Continuous meetings with staff and supervisors at ABB Control Products and Mälardalen University will help to ensure the reliability and validity of the result. The reliability of the theoretical background will be assured through choosing authorized and recognized sources. This increases the possibility to reach a realistic and dependable result. The authors of the thesis project have been working on the thesis at ABB Control Products the entire project, which has resulted in increased information through everyday discussions, access to ABB’s intranet and admittance to meetings interesting for the thesis.
3. T
HEORY
In this chapter the theoretical framework is presented. It is focused on the lean philosophy’s theory of production development processes and the methods, models and tools that it includes. This part is the basis for the production development process.
3.1 Strategies and methodologies
There are many different strategies that can be used for a production development process. In this section three different strategies will be explained; DMAIC, PDSA and Bengt Andreasson’s guidelines for layout development. These three strategies are all focusing on lean perspectives in different ways; continuous improvements, decreased variation in production, advantageous flows etc.
The chosen strategy, which is a combination of these three strategies, designed for this specific project is explained in the method chapter.
3.1.1 DMAIC
DMAIC (define, measure, analyze, improve, control) is a five-step procedure for improvement work in the Six Sigma system. The goal with Six Sigma is to decrease variation in production. Variation creates the main cost and reason for unsatisfied customers and by decreasing this, improved delivery assurances and better exchanges between processes can be achieved [Krajewski, Ritzman & Malhotra, 2010;
Bergman & Klefsjö, 2001]. There are five steps in the DMAIC model [Krajewski, Ritzman & Malhotra, 2010]:
1. Define - the characteristics in the end-product that can be critical to customer satisfaction are defined. Gaps between the process and those characteristics are identified. Flowcharts and process charts are documented to get an understanding of the process. 2. Measure - the work in the process that affects the gap is
quantified. Selections of what to measure is decided, depending on the defined gaps. Data sources are identified and a plan to collect data is prepared.
3. Analyze – a process analysis based on the collected data is performed. Pareto charts, scatter diagrams, and cause- and affect- diagrams are examples of tools that can be used to determine where improvements are needed.
4. Improve – to meet the new performance objectives, the existing methods needed are changed and implemented.
5. Control – the process is monitored to guarantee that high performance levels are maintained. Again, data analysis tools are used to control the process.
The DMAIC procedure can be applied to projects in order to improve processes or projects that need major changes; a redesign of an existing process or development of a new process [Krajewski, Ritzman & Malhotra, 2010].
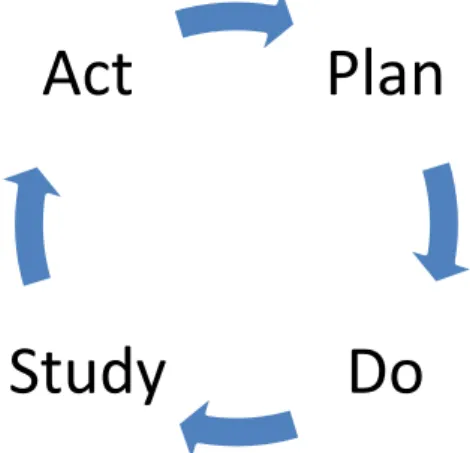
3.1.2 PDSA-Cycle
The PDSA-cycle is a well known model for problem solving, see figure 3. The model lies at heart of the continuous improvement philosophy and focus on the aspects of processes that do not add value to the service or product. The idea of the PDSA-cycle is to reduce or eliminate activities that do not add value. It contains the steps [Krajewski, Ritzman & Malhotra, 2010]:
1. Plan – a process is selected, goals are set, and methods to fulfill the goals are discussed. A plan is developed when the pros and cons of the different methods have been evaluated.
2. Do – the plan is implemented and data are collected continuously to measure the improvements in the process.
3. Study – the collected data is analyzed to find out how closely the results correspond to the goals set in the plan step. If significant deviations exist, the plan is either reevaluated or the project is stopped.
4. Act – if the result is positive the revised process becomes a standard procedure for others to use.
3.1.3 Guidelines for Layout Development
There is often no standardized method to use when developing a new layout. The appropriate method is to work step-by-step. A ten step model to use at all layout development follows [Andreasson, 1997]:
1. Set up Goals – what shall be achieved with the new layout is defined.
2. Current State – the current situation is verified; how it looks like and how it is done today.
Plan
Do
Study
Act
3. Resources Need – resources needed that must be included in the new layout is determined.
4. Space Need – all resources demands certain space. The space needed for the resources are settled.
5. Mapping Relations – relations between resources is mapped in aim to know how they should be placed relative to each other. 6. Grade Relations – grading of the resource relations are performed
to see which relations are the most important and need to be prioritized.
7. Outline Layout – from the compilation in previous step, the different resources and functions are placed on the drawing. 8. Analyze – the outline layout is analyzed; the pros and cons of the
suggestion are discussed.
9. Alternative – the adjustment of the outline that emerged in the previous step is made and different alternatives of the layout are developed. Then the most optimal alternative is chosen.
10. Detail Plan – the chosen layout is developed in detail.
3.2 Production System
The function of a production system can be described as transformation of input to output. The input can be seen as raw material and the output can be a component or a finished product. To be able to transform the raw material to a component or finished product, technology, humans, energy, and information is all needed and organized in the best way possible.
Production is the process where products or services are created through combinations of material, labor, and capital. There is a distinct connection between production of products and services. Since consumption is the superior driving force for all production, all produced products must in some way be distributed for consumption. Thus is production in most cases uninteresting if it is not combined with products and services.
The term production system is often synonymously with manufacturing system and mounting system. Other terms used are line, factory and workshop.
A production system contains of a number of different elements that all are relative to each other. The most common elements that use to be mentioned are facilities, humans, machines, and equipment. Also software and procedures is often mentioned as system elements [Bellgran & Säfström, 2005].
3.3 Lean Philosophy
Lean production is a philosophy that focuses on eliminating all non value-adding activities in the value chain to achieve effective production. Non value-adding activities could be unnecessary transports and movements, waiting time, over-production, storage and defects [Bellgran & Säfsten, 2005]. Lean production is defined as a five-step process; define customer value and the value stream, make the stream flow, use a pull-system based on the customers demand, and strive for excellence [Liker, 2004]. Lean production was founded in Toyotas’ production system; the Toyota Production System (TPS) in the late 80’s and has been applied by several companies in the world [Bellgran & Säfsten, 2005].
Figure 4 shows the terms for the Toyota Way. The foundation of the TPS is to understand the philosophy; it is about making long-term decisions, even at the expense of short-term financial costs. The process section includes processes like; eliminating waste, creating continuous flow, use pull-system instead of push-system to avoid overproduction, standardize the work, use visual control to clarify problems, and use only reliable tested technology. People and partners section are focusing on the importance of respect, challenge and to develop and help your people and suppliers the companies people and teams, and also the importance of growing leaders who live the philosophy. The top of the pyramid covers the part of continuous improvement and learning procedures [Liker, 2004].
Figure 3: The ”4 P” model of the Toyota Way (Liker, 2004).
3.3.1 Go and See for Yourself (Genchi Genbutsu)
One of the principles of the Toyota Production System is “Genchi Genbutsu”, which means to go and see for yourself to thoroughly understand the situation. Then problems can be solved and processes improved by going to the source and personally observing and verifying data rather than theorizing on the basis of what other people or the computer data tells.
The first step of any problem-solving process is grasping the actual situation, which requires “going to the actual place”. Within the lean philosophy, creative thinking and innovation is promoted and expected. But it should be grounded in thoroughly understanding of all aspects of the actual situation, and to not take anything for granted and grasp firsthand knowledge. Though barely letting engineers and managers observe the floor to understand the situation will accomplish little, unless they have the skill to analyze and understand the current situation [Liker, 2004].
Problem Solving
People and Partners
Process
3.3.2 Just-in-time
The just-in-time (JIT) system is a set of principles, tools, and techniques that are founded of the JIT philosophy; it reduces waste by eliminating unnecessary capacity or inventory. It is a pull-system that increases companies’ ability to deliver the right items in the right amount at the right time. The eight most common waste activities that are being investigated are [Liker, 2004; Krajewski, Ritzman & Malhotra, 2010]:
- Overproduction: items manufactured before needed might create inventory and excessive lead times.
- Inappropriate Processing: use of unnecessary expensive equipment with higher precision than needed increases the expenses.
- Waiting: wasteful time when the products is not being processed or moved.
- Transportation: unnecessary movement and material handling of products between processes.
- Motion: unnecessary effort for employees regarding ergonomics. - Inventory: excess inventory can hide problems on the shop floor,
consumes space, increases lead times, and can inhibit communication.
- Defects: rework and scrap is a costly effect of quality defects. - Underutilization of Employees: lack of taking care of the employees’
creativity and knowledge results in hinder long-term efforts to eliminate waste.
JIT enables higher delivery precision, which is an important aspect for customers’; it increases the flexibility, lower wastages and fewer the rejects. All of this result in less capital tied-up [Lindstedt & Burenius, 2006].
3.3.3 Visual Control
Visual control is any communication device used in work environment, to help people determine immediately whether they are in a standard condition or deviating from it. The information can show where items
belong, how many items belong there, what the standard procedure is for doing something, the status of work in process, and other types of information critical to the flow of work activities. Visual control can be referred to the design of just-in-time information of all types to ensure fast and proper execution of operations and processes. It is just not about capturing deviations from a goal on charts and graphs, the visual control means being able to look at a process, a piece of equipment, inventory, information, or at worker performing a job and immediately see if the standard being used to perform the task or not [Liker, 2004].
3.3.4 Standardization
According to principle 6 in the Toyota Production System, standardization is the basis for continuous improvement and quality. A process must be standardized and stable before it can be improved. Without standardizing the process it varies a lot and an improvement will just be one more variance which tend to be ignored and forgotten [Liker, 2004].
Standardizing components and work methods facilitates firms to achieve high-productivity and low-inventory that are important aspects in a lean system. Productivity increases when workers have standardized tasks and work methods that are repeated and well learned [Krajewski, Ritzman & Malhotra, 2010]. Standardized work builds in quality because defects are being reduced by standardization. When a defect is discovered, the source for the problem is detected to figure out whether the standardized work was followed, or if modifications in the standardization is needed [Liker, 2004].
3.3.5 Level out the Workload
Heijunka is the Japanese word for levelling the production by both volume and product mix; products are built on statistics and patterns, over a certain period of time, depending on how often and what products customers are ordering. Levelling out the production means that the quantity produced is relatively constant all the time. When the process is rather even, it is possible to apply pull-systems and to balance
the line. Front-loading or postponements of shipments are some of the manners to level out the workload. Production control or production management people are responsible for controlling and planning the production to make it even. There are four benefits achieved with levelling the production [Liker, 2004]:
1. The possibility to produce the product that the customers want, when they want it increases the flexibility.
2. The risk for unsold goods is decreased when products are produced after statistics of customers’ orders.
3. The use of resources is more balanced.
4. The demand on upstream processes and the plants’ suppliers is smoothened.
The four main reasons for avoiding unlevelled production are [Liker, 2004]:
1. Difficulty of predicting when customers want to buy.
2. Risk of unsold goods when products are produced after orders. 3. Unbalanced use of resources.
4. Upstream processes are uneven.
Because of the product mix, setup time for changeover increases in levelled production compared to unlevelled production. An efficient setup time for changeover is needed to maintain high productivity. Without levelling the production, wastes increases for both people and equipment because they have to work hard and then stop and wait [Liker, 2004].
3.3.6 Lean Ergonomics
Good ergonomics of processes is essential for any manufacturer. Ergonomics treats the conditions for humans in work. It can be everything from physical load of mechanical force and moment impact on the human body to different form of mental difficulties in work [Ericson & Odenrick, 1995].
Lean ergonomics is an extension of conventional ergonomics. How to handle ergonomics within lean follows [Bicheno, 2004]:
- Work to Cycle Time or Rhythm. Regular rhythm can assist in good blood circulation. By contrast with static effort, flow of blood can be obstructed.
- Lean favor standing rather than sitting. It creates flexibility to move between workstations and also for posture and to help avoid lower back problems. Ergonomists recommend a combination with a predominance of sitting. To balance it in a good way and still remain the flexibility, is to have standing and moving operators but also frequent breaks with comfortable chairs in team areas.
- A workstation should allow for height adjustment both for height of the operator and the type of work.
- Do “Ergonomic 5S”, not only 5S. Make sure all tools and parts are corrected located ergonomically. The posture should be in natural position all the time. 5S should contain evaluations of work heights and ergonomic workstation layout; lifting, lightning, controls, vibration and noise.
- Make use of visual warning devices. For example coloured stickers
on containers to indicate if they are human movable, human movable with care, or only machine movable.
A cycle time less than two minutes lower the job satisfaction due to high specialization [Krajewski, Ritzman & Malhotra, 2010].
3.4 Lean Tools
Several tools are developed within the lean philosophy in order to
decrease the non value-adding activities and to increase the activities that
are value-adding [Liker, 2004].
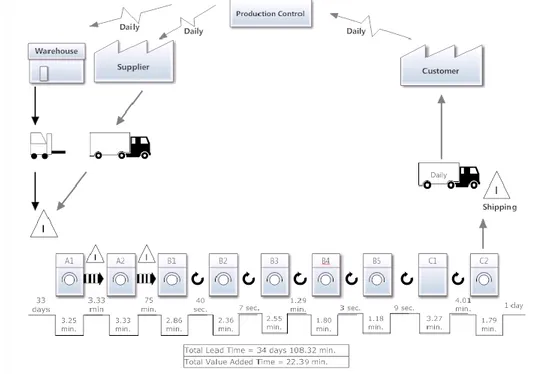
3.4.1 Value Stream Map
Several different flows exist in a production system and they describe a movement of something. These movements must be performed in such way it reaches the right receiver, in right amount, and in the right time. The flows that need to be taken into account when developing a production system are flows of: material, information, and humans. Flows in existing as well as planned production systems can be described graphically through flow diagram or different kind of charts. One way to document activities in detail and graphically is through a value stream map. It is a widely used qualitative lean tool aimed at eliminating waste.
A value stream map can be performed in different detail levels and gives a better understanding of the process, and includes the process flow, material flow, and the layout flow [Bellgran & Säfsten, 2005]. The value stream map explains in a graphically way all the steps through the process to the finished product or service. An analysis of the structure and logic of the process can be performed using the value stream map, and also identification of potential problems, bottlenecks, unnecessary steps and correction activities is possible [Sandholm, 2001].
3.4.2 Fish-bone Diagram (Ishikawa)
The fish-bone diagram, also called Ishikawa diagram after the creator Kaoru Ishikawa, is a tool suitable when a quality problem is discovered, see figure 5.
It is facilitating the investigation of all ideas that might be causing the quality problem [Sandholm, 2001]. To begin with, the main problem is defined and included in front of the arrow in the fish-bone diagram. Following arrows, affecting the main problem, are possible reasons causing the main problem, for example; equipment, process, people, materials, environment and management. Next step is to figure out the reasons for those problems, and so on. Eventually a fish-bone diagram is designed and can be used as a foundation for continued investigations of the problem area. It is a systematic way to figure out the underlying reason for a problem, in effort to solve it as soon as possible [Bergman & Klefsjö, 2001].
3.5 Quality
In order to fulfil the customers’ required quality demands, it is important to clarify and characterize the demand specifications. Several operation methods are needed to get a reliable understanding for these demands; focus groups in which customers are a part and can describe their needs and wishes is one way, and also interviews with customers can be performed. Other ways to get knowledge of the demands, is to visit the customers to see and understand their needs, because needs are not always known and expressed.
Systematically handling of the defined needs is a preferred foundation for further development work. Quality Function Deployment (QFD) is a useful tool to transform customer needs to quality demands [Bergman & Klefsjö, 2001].
It can be abstract to talk about quality if only referred to the general definition. Through decomposition of the quality concept into elements, it can be made perspicuously and tangibly. Those quality parameters can in production be reliability, ergonomic adaption, resource efficiency, and environmental impact [Sandholm, 2001].
Quality control is performed when investigation of a product fulfills its quality demands. The quality control can be performed in different stages of the process; receiving control, processing control, and final control. At the receiving control raw materials, material, and components from supplier is checked. The purpose is to inhibit defected goods to be shipped further the process and there cause disturbance and
reduction of quality. The processing control’s purpose is to hinder products of not acceptable quality to be passed on further down the process chain. It can be executed where ever in the process and also continuously. When the product is finished the final control is made. Through the control defected products are stopped from being delivered to customer or the finished goods inventory [Sandholm, 2001].
3.6 Kitting
A kit can generally be defined as a container which holds a specific assortment of parts that are used in one or more assembly operations in the plant. Kit assembly is an operation where all the components and/or subassemblies that are required for a particular kit type are physically placed in the appropriate kit container. Conceptually, kit assembly is an order picking operation.
It exist two types of kits; stationary kits and travelling kits. A stationary kit is delivered to a workstation and it remains there until it is depleted, where the product which is assembled moves from one station to another. A travelling kit is handled along with the product and it supports several workstations before it is depleted. A kit usually does not contain all the parts required to assemble one unit of the end product due to the complexity or product size [Bozer & McGinnis, 1992]. Kit assembly can be performed by pickers or by the assemblers themselves. Further, the picking can either be performed in a central storage or at decentralized areas located close to the assembly area, so called materials markets [Brynzér, 1995].
3.7 Customer Ordering Decoupling Point
Customer Ordering Decoupling Point (CODP) is defined by Rudberg and Wikner (2004), as the point in the value-adding material flow when the decisions can be made under certainty concerning customer demand, see figure 6. There are five main COPD’s [Rudberg & Wikner, 2005]:
- Assembly to Order (ATO)
- Engineer to Order (ETO)
- Make to Stock (MTS) - Make to Plan (MTP)
Figure 6: CODP’s in the value-added material flow (Rudberg & Wikner, 2005).
When Assembly to Order (ATO) is used, all materials are sourced and all component manufacturing is carried out without connection to specific customer orders. The final assembly of the products is not performed unless a customer order has been made. Stocks only consist of all purchased components, raw material, components and semi-finished products that are produced within the company. The characteristics of ATO are short delivery time, relatively medium volumes and customized products [Jonsson, 2008].
Engineer to Order (ETO) is about making highly customized products to
meet individual customer requirements [Hicks, McGovern & Earl, 2000]. Orders need to pass through the develop department in order to adapt to the customer’s special needs and requests. The main advantage of using ETO is flexibility and to fully meet customer needs. The disadvantages are long delivery time to customer [Jonsson, 2008].
Make to Order (MTO) means the products are only produced after it is
ordered. This method can be used in order to reduce inventory and increase the level of customization. The characteristics of companies using MTO are customized products, low volume and relatively long delivery time to customer [Jonsson, 2008].
Make to Plan (MTP) and Make to Stock (MTS) are mainly used when the
product is well known and small or no changes occur. The product is commonly standardized. The characteristics for MTP and MTS are large volumes and few product variants. They differ when it comes to the basis for planning and interaction with customer. Both of them have a really short delivery time and the volumes are often high but few orders [Jonsson, 2008].
3.8 Production Processes
Production processes can be used to describe how the technical part of the production system looks likes. There are different kind of processes and the selection of process when developing a production system depends often on the volume and variety of the products [Bellgran & Säfsten, 2005].
Figure 7 described by Krajewski et al. (2010) shows the product-process matrix for the manufacturing process. This section gives a description of the different production processes.
Job Process
A Job process is a customized process with flexible and unique sequence of tasks. It contains the flexibility needed to produce a wide variety of products in significant quantities, with considerable divergence in the steps performed. The workforce and equipment are flexible to handle a wide divergence of tasks, which makes the customization high but volume for any product low. Typically for this type of process, products are made to order and are not produced in advance. In a job process, all similar resources are primarily organized around itself, with equipment and workers capable of certain types of work located together [Krajewski, Ritzman & Malhotra, 2010].
Batch Process
The primary different between Batch Process and Job Process is that the volumes are higher in a batch process because of the repeatedly producing the same or similar products or parts. Also products of narrower range are provided and the production lots are handled in larger quantities. In the batch process, first a batch of a product is processed, and then production is switched to the next product. Eventually the first product is produced again. The volumes are average and the process flow is flexible, which means that the process divergence is still too great to provide a separate process for each product. The products are often processed in different steps where inventory can be held between [Krajewski, Ritzman & Malhotra, 2010].
Line Process
In a Line Process, volumes are high and products are standardized which allows resources to be organized around particular products. There is minimal divergence in the process and little inventory is held between the processing steps. Due to the little variability in the production steps, production and material handling equipments is specialized.
Production orders are not directly linked to customer orders, where standard products are produced in advance and held in inventory so they are ready to be shipped when a customer places an order [Krajewski, Ritzman & Malhotra, 2010].
Continuous Flow Process
A Continuous Flow Process is a high-volume standardized production with rigid line flow. The process divergence is insignificant and primary material moves through the process without stopping. The process is often capital-intensive and operates around the clock to maximize utilization and to avoid expensive shutdowns and start-ups [Krajewski, Ritzman & Malhotra, 2010].
In lean production, continuously flow should always be aimed for. When developing a one-piece flow, also numerous of activities to eliminate waste are activated. Some of the benefits of continuous flow are [Liker, 2004]:
1. Builds in Quality – every operator is an inspector and works to fix any problem in station before passing them on. If defects are missed they will be detected quickly and the problem can be corrected.
2. Creates Real Flexibility – with continuous flow the lead time is reduced. If the lead time is short, there is more flexibility to respond and make what the customer really wants.
3. Creates Higher Productivity – in a one-piece flow cell, there is little non value-added activities like moving materials around. It is easy to detect who is too busy and who is idle.
4. Frees up Floor Space – in a cell, everything is pushed close together and there is little space wasted by inventory.
5. Improves Safety – when using one-piece flow, smaller batches of material is moved in the factory. Smaller batches mean getting rid of forklift trucks, which are a major cause of accidents. 6. Improves Morale – people is doing more value-added work in
one-piece flow. They can immediately see the results of that work, giving them both sense of accomplishment and job satisfaction. 7. Reduces Cost of Inventory – capital to invest is freed up when it is
not invested in inventory sitting on the floor. Also, companies do not have to pay the carrying costs of the capital they free up.
3.9 Layout
If the process layout is well considered it increases the productivity and the process flow. A well designed layout has a clear main flow and the resources are high utilized.
There are many different designs for layouts, to mention some of them; functional layout, line-shaped production layout, cellular production layout, and fixed position layout [Jonsson, 2008].
Fixed Position Layout
Manufacturing of bulky products; large turbines, aircraft and ships etc., makes it difficult to move the item. Instead of moving the product, resources are moved and organized around the product when no other alternative is appropriate [Jonsson, 2008; Bellgran & Säfsten, 2005].
Functional Production Layout
In
functional production layouts, machines are grouped after their production functions. The materials are being transported from group to group, depending on what manufacturing process is needed. This kind of layout is appropriate when there are many different items being produced and in relatively small numbers. This layout is flexible; it can easily adapt to changes in product mix and volume changes [Jonsson, 2008]. The cons with this layout design are the continuous need of controlling because of the variety of items, and also that it is a lot of transportation, which increases the transportation and material handling costs [Andreasson, 1997].Cellular Production Layout
When production resources are organized into groups the layout is structured as a cellular production layout. The layout is production centred instead of process centred, which shortens the lead time in production and it also lowers the tied-up capital. In comparison to line-shaped layouts it is more flexible and adjustable to changes, but not as flexible as functionally shaped production layouts. It is difficult to maximize the utilization of all machines and workstations in the cells in this type of production [Bellgran & Säfsten, 2005; Jonsson, 2008].
Line-shaped Production Layout
In a line-shaped production layout, resources are being organized by item and are placed in the same order as the manufacturing of the item is being processed. It is an efficient layout when large quantities or continuous manufacturing of items are taking place, for example assembly lines in the car industry. It works well for flow-orientated manufacturing with straight flows of materials and transportations. This solution can shorten lead-times and queue time in the beginning of the line. The transportation and material handling time is relatively low. The disadvantage with the line-shaped production layout is the sensitivity for disruptions. Every process step is depending on the next one, which means that if one station is standing still the entire production is stopped. This also results in a less flexible system [Jonsson, 2008; Andreasson, 1997].
Lean System Layout
Lean system layouts are mostly designed as line-shaped production layouts because it eliminates waste by reducing the frequency of setups. One-worker, multiple-machines (OWMM) cells are flexible work cells where the number of workers can be adjusted. One worker can handle multiple machines simultaneously to create a line flow [Krajewski, Ritzman & Malhotra, 2010]. A U shaped layout is preferred to have the equipment organized following the flow of material. This shape makes the movements of material and workers more efficient and makes communication better. People working in this kind of layouts need to be multi-skilled to be able to handle many machines, to make the system as flexible as possible. The line can also be I shaped or L shaped [Liker, 2004]. Group technology (GT) is another option to achieve line-flow processes with low volume processes. The GT organizes parts or products with the same process steps into families, based on size, shape, manufacturing, routing requirements, or demand. By organizing these families into the same production process, it minimizes machine changeover or setup. When items have been divided into families, the next step is to create work cells by organizing needed machine tools for the basic process [Krajewski, Ritzman & Malhotra, 2010].
3.10
Automation
Automation is the use of monitoring and controlling the production and delivery of products and services through control systems and information technologies. Automation crosses all functions within industry from installation, integration, and maintenance to design, procurement, and management.
Automation involves a broad range of technologies including robotics and expert systems, telemetry and communications, process measurement and control, sensors, wireless applications, systems integration, and test measurement [The Automation Federation, 2011]. There are several aspects of benefits of using automation in production; robots are used in operations dangerous for human labor. The flexibility increases through the ability to shift the production immediately through programming and it has the capacity to work continuously for years with high standards. Automation also speeds up value-added steps of the process. This results in reduction of the lead time which leads to shorter waiting time for customer to receive products or services [Garcia & Lawton, 2007].
3.10.1 Supporting Technology
Before adopting new technology a thoroughly made analyze should be made to see what impact it may have on the existing process. A firsthand view of the nature of the value-added work being performed by the workers should be designed, and then search for new opportunities to eliminate waste and even out the flow. Make a pilot where the improvements of the process are made with existing technology, equipment, and people. When accomplished as much improvement as possible, see if additional improvements can be reached by adding new technology. If it is determined that the new technology adds value to the process and it does not conflict with present operating principle, it can be implemented [Liker, 2004].
Similar method when implementing lean automation is written by Garcia & Lawton (2007). Lean automation aims at improving a system or process to achieve lean goals in elimination of non value-added waste. It