University of Kalmar
School of Pure and Applied Natural Sciences
A STUDY OF BARLEY PROTEIN
COMPOSITION DURING BEER
BREWING PROCESS USING SE-HPLC
Frida Nilsson
Degree project work in chemistry
Level: D
Degree project works made at the University of Kalmar, School of Pure and Applied Natural Sciences, can be ordered from: www.hik.se/student
or
University of Kalmar
School of Pure and Applied Natural Sciences SE-391 82 KALMAR
SWEDEN
Phone + 46 480-44 62 00 Fax + 46 480-44 73 05 e-mail: info@nv.hik.se
1
A STUDY OF BARLEY PROTEIN COMPOSITION DURING BEER
BREWING PROCESS USING SE-HPLC.
Frida Nilsson
Chemistry 240 ECTS credits
University of Kalmar, School of Pure and Applied Natural Sciences
Degree Projekt Work 30 ECTS credits
Supervisors:
Nils-Bo Nilsson
Food technology
Campus Helsingborg
Lund University
SE-251 08 Helsingborg
Maria Bergström, Ph.D
School of pure and applied natural
sciences
University of Kalmar
SE-391 82 Kalmar
Examiner:
Kjell Edman, Ph.D
School of pure and applied natural
sciences
University of Kalmar
SE-391 82 Kalmar
ABSTRACT
The aims of this project were to examine how proteins in barley are degraded during the beer brewing process and if the protein content in the final beer product differ if the barley is sown in different locations and with different amount of nitrogen in fertilization. The proteins extractability was also followed through the beer brewing process. The beers were brewed in a pilot brewery and were analyzed with SE-HPLC. Certain beer proteins have been shown to influence the beer foam and haze formation and since consumers rely much on their visual impression it is important for the breweries that the beer has a stable foam and no haze formation. Two albumins in beer have been associated with beer foam formation; protein Z and lipid transfer protein 1 (LTP1), while it is
proline-rich proteins which has been shown to influence the beer haze formation. The results showed that all the polymeric proteins were degraded into monomeric proteins during the brewing process; in the final beer product 70 % of the proteins were small monomeric proteins and the rest was large monomeric proteins. The unextractable proteins were transformed extractable to some extent during malting and mashing and the unextractable proteins left in the wort after mashing were removed during lautering. The most of the proteins were degraded into small monomeric proteins somewhere after the protein rest during mashing and before fermentation. Different location and amount of nitrogen added to the soil resulted in a significant difference, both in total protein content and protein composition in the final beer product. Since it could not be shown which specific proteins that
differed, further research is required before any conclusions can be drawn about how the parameters influence the beer quality.
2
SVENSK SAMMANFATTNING
För några år sedan startade Sveriges lantbruksuniversitet (SLU) i Alnarp ett projekt där korn odlas på olika platser i Skåne under olika förhållanden. Till exempel varierade de kvävegivorna i jorden och mängd bekämpningsmedel. Min del i projektet var att brygga öl på några av maltkornen och att under
bryggningsprocessens gång plocka ut prover vid bestämda tillfällen. Provernas proteininnehåll undersöktes sedan med size-exclusion high performance liquid chromatography (SE-HPLC) för att se hur proteinerna bröts ner under
bryggningsprocessen och om det var någon skillnad i proteininnehåll i de olika ölen. Jag undersökte även hur extraherbarheten hos proteinerna förändrades under
ölbryggningsprocessen.
Olika proteiner har olika funktioner i öl. De flesta har ingen större funktion förutom att bidra med smak, munkänsla och textur, medan andra proteiner har visat sig vara involverade i ölets skum och grumlighet. Eftersom konsumenter litar mycket på sitt visuella intryck är det viktigt för ölbryggerierna att ölet inte ska vara grumligt och ha en bra skumkvalité. Det har forskats mycket om dessa proteiner de senare åren för att kunna få fram ett bra kvalitetsöl.
Resultaten visade att alla multimera proteiner bröts ner till enklare proteiner under bryggningsprocessen och i det färdiga ölet var 70 % små enkla proteiner. Den största delen av proteinerna bröts ner till mindre proteiner någon gång efter proteinrasten under mäskningen och före fermenteringen. Vissa av de icke-extraherbara
proteinerna blev extraherbara under bryggningsprocessen, resterande filtrerades bort under lakningssteget. I det färdiga ölet fanns alltså inga icke-extraherbara proteiner kvar. Statistikanalysen visade att det var en signifikant skillnad i det färdiga ölet, både i totalproteininnehåll och proteinsammansättning, både när man varierade plats och kvävegiva. Eftersom resultaten inte visar vilka specifika protein det är som varierar kan man inte dra några slutsatser om hur de olika parametrarna påverkar ölets kvalité. För att fastställa det behövs vidare forskning inom ämnen där man undersöker vilka specifika proteiner som varierar.
3
PREFACE
This study was the degree project work of the master degree program in nutrition and food chemistry at the University of Kalmar. The experimental work was conducted at the department of food technology at the the faculty of engineering at Lund
University in Helsingborg and at the Swedish university of agricultural sciences (SLU) in Alnarp.
I want to thank Eva Johansson at SLU in Alnarp for all the help with the statistical work and giving me support when I needed, and thanks to Maria Luisa Prieto-Linde for support and guidance with all the laboratory work and for showing me Alnarp at its best. Thanks to Dan Johansson at the department of food technology in
Helsingborg for all the help, time and understanding he has given me during my project. Many thanks to my supervisor Maria Bergström at the University of Kalmar for constructive discussions, feedback and advice.
Special thanks to my supervisor Nils-Bo Nilsson at the department of food
technology in Helsingborg for supervision, guidance and positivity. Thanks also to the SL-foundation for financial support for the brewery in Helsingborg.
Karlskrona, 26 augusti 2009 Frida Nilsson
4
TABLE OF CONTENTS
1 INTRODUCTION
5 1.1 Project background 5 1.2 Beer 6 1.2.1 Raw materials 6 1.2.2 Brewing process 71.2.3 Proteins in beer and barley 10
1.3 High performance liquid chromatography 11
2.0 METHODS AND MATERIALS
132.1 Beer brewing equipment 13
2.2 Beer production 13
2.2.1 Milling and mashing 13
2.2.2 Lautering 14
2.2.3 Wort boiling 14
2.2.4 Clarification and cooling 14
2.2.5 Pitching and fermentation 14
2.2.6 Retapping 15 2.3 Sample collection 15 2.4 SE-HPLC analysis 16 2.4.1 Sample preparation 16 2.4.2 SE-HPLC analyse 16 2.4.3 Statistical analyse 18
3.0 RESULTS AND DISCUSSION
184.0 CONCLUSIONS
335
1.0 INTRODUCTION
1.1 Project background
At the Swedish university of agricultural sciences (SLU) in Alnarp a project started a few years ago where barleys are grown in different places in Skåne and at different conditions. For example nitrogen, soil and pesticide were varied. My part of the project was to brew beer of six different malted barleys. During the brewing I collected samples from different steps which I later analysed with size-exclusion high performance liquid chromatography (SE-HPLC).
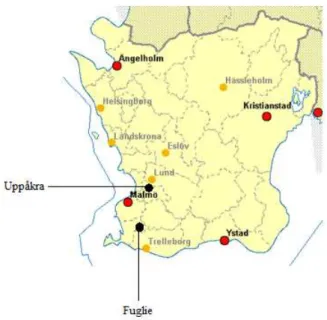
Since the last sample of the last brewing was not ready for analysis until late April, I evaluated already ready chromatogram from earlier SE-HPLC-analyses in the project. The four barleys which results I evaluated came from two different places in Skåne; Uppåkra and Fuglie (see fig 1), and the two samples from each places had different amount of nitrogen in fertilisation; 70 kg N/Ha and 110 kg N/Ha.
6 Aims
• Examine how the proteins are degraded during the brewing process.
• Examine if there is any difference in the protein composition in the different samples taken out from the beer brewing process depending of the location of growth and amount of nitrogen in fertilisation.
• Examine how the proteins extractability changes during the brewing process.
1.2 Beer
1.2.1 Raw materials
Four raw materials are necessary for beer production: malt, hops, yeast and water. To receive the optimal final product, knowledge of the properties of the raw materials is essential (Kunze W., 1999).
Malt
Malt is a cereal grain which has been exposed for water and thereby has started to germinate. In beer production different malts can be used but barley is the most common one (Briggs D.E., 1981). The reason why it is often chosen is because of its high starch content, which in the brewing process is converted to fermentable sugars, and also because the husk is attached to the grain even after the milling and mashing and can therefore form the wort filtration layer that is required later in the brewing process (Silva F., 2007).
Hops
The hops (Humulus lupulus L.) that are used in brewing are dried cones of the female hop plant. Hops contain 14 to 21 % hop resin and this is the most valuable
component in beer production. It gives the beer its bitter taste, which are the hops α-acids and β-α-acids, with α-α-acids giving 9 times greater bitterness than the β-α-acids. When the hop is boiled, the almost insoluble α-acids humulone, cohumulone and adhumulone are converted to soluble iso- α-acids; isohumulone, isocohumulone and
7
isoadhumulone, which are responsible for the bitter taste (Kunze W., 1999, Ferreira I., 2005). The hop resins also improve foam stability and inhibit the growth of microorganisms in the wort and beer. (Kunze W., 1999)
Yeast
In beer production the yeast ferments sugar in the wort to alcohol. The yeast that is used in beer production is Saccharomyces cerevisae and there are many different strains developed. In brewing they can be divided into two groups; top and bottom fermenting yeast. Top yeast arises to the surface during fermentation while the bottom yeast sinks to the bottom. Top yeast is used to brew ales and bottom yeast to brew lagers (Kunze W., 1999, Hough J.S., 1982)
Water
The water that is used for brewing must be of drinking quality and it has a high impact on the quality of the beer. Water in different areas in the world is suitable for different kinds of beer. Soft water is most suitable for brewing pale lagers (like pilsner) while water with permanent hardness (hardness that cannot be removed by boiling) is most suitable for pale ales and water with less calcium sulphate and more calcium carbonate for dark ale and dark lagers (Briggs D.E., 1981).
1.2.2 Brewing process
Malting
Malting is the first step in the brewing process, but this process does not normally take place in the brewery. In malting the cereal grain germinates and it involves three steps: steeping, germination and kilning. During steeping water is added to the grains which activate the enzymes. For pale or pilsner malt the water content reaches 42 to 44 % and in dark malt 44 to 47 %. After 4 to 6 hours the grains are dried and then the germination begins (Kunze W., 1999). During the germination several enzymes are formed or activated, which later in the mashing process are essential (Silva F., 2008). β-glucans are broken down by endo- β-1,4-glucanase and endo- glucanase. Endo- β-1,4-glucanase is already present in barley, but endo-
β-1,3-8
glucanase is only present in malt. Because the β-glucans are gel forming and thereby can course problems in filtration, a high content of β-glucanase and a low content of β-glucan are desirable in malt. The starch content decreases and the sugar content increases during the germination and the starch is degraded by α-amylase and β-amylase. There is no α-amylase present in barley; it is produced during germination, while β-amylase is already present in barley. Proteins are also degraded during germination. Peptidases degrade 35 – 40 % of the proteins into soluble material. After 5 to 6 days the germination is completed and its life processes is inactivated by kilning. In kilning the water is removed by passing hot air through the malt. This stops the germination and modifications, and instead colour and flavour compounds are formed by Maillard reactions.
Milling
When milling, the malt is broken down into smaller fragments which releases the enzymes and makes it’s easier for the enzymes to act on the malt contents. It is important that the malt is not totally crashed; the husk must be intact since it is used as filter during lautering.
Mashing
During mashing the milled malt is mixed with lukewarm water and then heated up according to a mashing program. The purpose of the mashing is to solubilise polysaccharides and proteins. Because different enzymes have different optimal temperature the mashing program is set so the temperature is held for a while at the enzymes optimal temperature, called different rests. Different brewers have their own specific mashing program. The first rest is the β-glucan rest. β-glucans can cause problems during the filtration by forming a gel and thereby increase the viscosity of the wort. Due to this, the β-glucan rest is very important. The
temperature optimum for endo-β-glucanase is 45 to 50 °C. Then the temperature is increased to 50 to 55 °C and the protein rest begins. It is important that this rest is not too long, because then the foam promoting proteins will be degraded. At higher temperatures the starch degradation takes place. The optimal temperature for β-amylase is 62 to 65 °C and 72 to 75 °C for α-β-amylase. β-β-amylase releases maltose
9
from the ends of the polysaccharides and α-amylase breaks down the starch into smaller carbohydrates. These steps are very important as the starch must be degraded into fermentable sugars; otherwise the yeast will not be able to produce any ethanol. Finally the temperature is raised to just above 75 °C and the lautering begins. Since the α-amylase is destroyed at 80 °C it is important to stay below this temperature during lautering (Kunze W., 1999).
Lautering
The mash is a mix of dissolved and suspended substances. The aqueous solution is called wort and this is separated from the insoluble parts (called spent grain) trough filtration; lautering. The insoluble parts, like the husk and seedling, is working as filter bed. Not all extracts follow the wort; some is still left in the spent grain. To get hold of these, the spent grain is washed with hot water, called sparging (Kunze W., 1999). The spent grains is a large coproduct in breweries and because of its high protein content (around 20 %) scientists are trying to find easy ways to solubilise the proteins so they can be used in the food or fermentation industry (Treimo J., 2008).
Wort boiling
The wort is then boiled for one to two hours and during this the hops are added. During the wort boiling several processes take place, for example all the enzymes destroyed, the hop components are extracted and transformed, water evaporates, the wort is sterilised and gets more coloured. The three different α-acids humulone, cohumulone and adhumulone are isomerised to different extent with cohumulone with the highest yield. If a more bitter beer is wanted, a hop variety with a high extent of cohumulone is optimal. An extended boiling time and a higher pH in the wort results in a higher isomerisation of the α-acids.
During the boiling Maillard reactions take place which result in darker wort. During fermentation this colour becomes lighter, but is still darker than the wort was before boiling.
10 Fermentation
Before the yeast can be added the wort is cooled, otherwise the yeast will not survive the hot temperature in the wort. This is usually performed with a plate heat
exchanger and the wort is cooled down to 5 to 7 °C. The wort is then aerated (during sterile conditions) which allows the yeast to growth; an aerobic process. The wort can be aerated in different ways, for examples by mixing or bubbling air into the wort. When there is no air left (an anaerobic process starts) the yeast stops growing and instead starts fermenting sugars to ethanol and carbon dioxide according to the Gay-Lussac equation (Kunze W., 1999):
C6H12O6 → 2 C2H5OH + 2 CO2 ∆G = -230 kJ
1.2.3 Proteins in beer and barley
The proteins in beer have molecular masses between 10-40 kDa (Silva F., 2008) and most of them are modified proteins from barley which are created during the brewing process due to the proteolytic and chemical modifications (Curioni A., 1995).
Hordeins are the most common protein in barley and constitute for 40 -50 % of total proteins. Other proteins present in barley are for example albumins, glutelins,
globulins, friabilins, enzymes and chaperones. Some proteins in beer seem to have no function, except their involvement in texture, colour, mouthfeel and flavour, but some has been associated with foam formation and beer haze. Since the consumers rely much on their visual impression of the beer it’s important for the breweries to achieve a stable foam and to minimize the beer haze formation (F. Silva, 2008). A lot of research has been performed to success with these two tasks.
Especially two albumins has been associated with beer foam formation; protein Z and lipid transfer protein 1 (LTP1) (F.Silva, 2008, Leisegang R., 2005, Ilmure T., 2008). LTP1 is foam positive through binding lipids, which are foam negative since they replace proteins in the interface and the foam therefore collapses as a course of this instability (D.J Cooper, 2002). Protein Z acts as a foam promoter by interacting
11
with other proteins and foam-positive compounds (Leisegang R., 2005,), such as iso-α-acids from hops (Ferreira I., 2005). Both protein Z and LTP1 are homologous to protease inhibitors and are not degraded by proteolytic enzymes during malting and mashing, but they are modified to some extent (Leisegang R., 2005)
Beer haze gives consumers the impression that the beer has been contaminated or that it has been stored too long. The beer haze is due to interactions between polyphenols and haze-active proteins which are formed during storage of the beer. Two beer haze-active proteins are protein Z and LTP 1. Some haze-active proteins (protein Z for example) are proline-rich and can be removed from the beer by filtrating with silicagel, which absorbs proline-rich proteins (Ilimure T., 2009, Robinson L., 2007).
1.3 High performance liquid chromatography
High performance liquid chromatography (HPLC) is a separation method that can be used both for qualitative analysis and for quantitative analyses. The HPLC-apparatus consists of an injector, a column with a mobile and a stationary phase, a pump system, a detector and a data collecting device.
When a mixture of analytes is injected to the column, the analytes are differently distributed between the solid and the mobile phase based on their distribution coefficients (Kd), which results in a separation of the analytes,. The distribution coefficient describes how the analyte distributes between two immiscible phases and is constant at a given temperature. For phases A and B the coefficient is given by the expression:
Kd = concentration in phase A concentration in phase B
12
The stationary and mobile phases are selected to be suitable for the analytes to be separated. An analyte that adsorbs weakly to the stationary phase is less retarded and reaches the detector faster then an analyte that is adsorbed stronger to the solid phase. For the mobile phase, isocratic elution or gradient elution can be used. When using isocratic elution the composition of the mobile phase is constant during the entire elution process, while a gradient elution is gradually changed in composition during the elution process.
It is important that the detector that is used has a high sensitivity since there are small quantities of analytes to detect (Wilson K., 2005). The most common detector in combination with HPLC it the ultraviolet visible (UV-VIS) spectrophotometer which reports the difference in the absorbance of light by the analyte and the solvent. There are different types of UV-VIS detectors; the simplest with a monochromator which selects a narrow band of UV-VIS light which passes through the sample, to more complex, for example photodiode array detector which allow a range of wavelength to be detected at the same time.
(Swadesh J., 2001)
In this experiment a size-exclusion HPLC (SE-HPLC) was used (also called gel filtration). It separate molecules based on their molecular size. The smaller molecules can enter the pores in the column and are thereby retarded. Larger molecules will not enter the pores and are eluted first. In SE-HPLC isocratic elution is used to elute the analytes (Wilson K., 2005).
13
2.0 METHODS AND MATERIALS
2.1 Beer brewing equipment
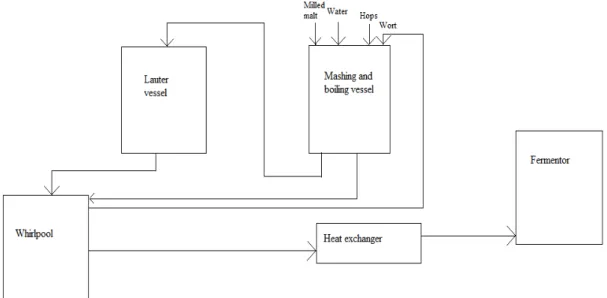
The experimental brewing equipment is manufactured by Tankki Oy in Tampere, Finland and consists of lauter vessel, mashing and boiling vessel, whirlpool, fermentor and heat exchanger, see figure 2. The grist mill is a GW 200, Oy Nord Mills Limited Ltd, Finland.
Figure 2. The brewing equipment in Helsingborg. Note: the fermentor was not used in my brewings, instead the beer was fermented on kegs.
2.2 Beer production
2.2.1 Milling and mashing
About 6,2 kg malted barley was crushed in the mill. Twenty-five litres of cold water was added to the mashing vessel and heated to 40 °C before the malt was added. The mashing was then controlled by the pre-set mashing program, see table I. The mash was heated 1 °C/min.
14 Table I. Mashing schedule.
Procedure Temperature Time
Mashing in 40 °C 0 min
β-glucane rest 45 °C 15 min
Protein rest 52 °C 15 min
β-amylase rest 62 °C 40 min
α-amylase rest 72 °C 25 min
Mashing off 76 °C 1 min
2.2.2 Lautering
The mash, now called wort, was pumped to the lauter vessel were it was left to settle for 15 minutes. The wort was filtrated with a flow rate of 450 ± 50 ml/min. After that the wort was pumped to the boiling vessel.
2.2.3 Wort boiling
The wort was boiled for 60 minutes and three addition of hops pellets were used: 11 g after 5 minutes of boiling, 9,5 g after 30 minutes of boiling and 8 g after 55 minutes of boiling. The hops pellets were first mixed with hot wort before it was added to the cooking vessel.
2.2.4 Clarification and cooling
After the cooking, the wort was transferred to the whirlpool at high speed and was left there for 15 minutes for sedimentation. The wort was then transferred through the heat exchanger to the keg were the first fermentation took place. The temperature of the wort was between 8-14 °C after cooling.
2.2.5 Pitching and fermentation
Thirty grams of freeze dried yeast was added to a bottle with sterilized water and a sterilized magnetic spinbar and was wetted for 30 minutes without shaking or stirring. The mixture was then stirred for 30 minutes at gentle speed. The wort in the
15
keg was then aired from a tube with compressed sterile air and then the yeast was added. The airing continued for 10 minutes and then the keg was sealed and placed in a fridge for two weeks with a temperature of 12 °C.
2.2.6 Retapping
After two weeks the beer was transferred with CO2 to another keg and then placed in a fridge for 40 days at the temperature of -1 °C. After 40 days the beer was bottle tapped.
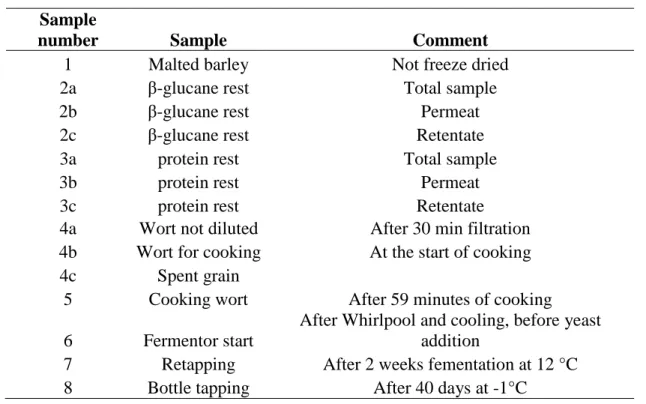
2.3 Sample collection
At each brewing process eight samples were taken at different steps at the brewing process, see table II.
Table II.
Sample schedule.
Sample
number Sample Comment
1 Malted barley Not freeze dried
2a β-glucane rest Total sample
2b β-glucane rest Permeat
2c β-glucane rest Retentate
3a protein rest Total sample
3b protein rest Permeat
3c protein rest Retentate
4a Wort not diluted After 30 min filtration
4b Wort for cooking At the start of cooking
4c Spent grain
5 Cooking wort After 59 minutes of cooking
6 Fermentor start
After Whirlpool and cooling, before yeast addition
7 Retapping After 2 weeks fementation at 12 °C
16
All samples, apart from sample 1, were put in a freezer until they were totally frozen and then freeze dried for 2 to 3 days. The samples were then crushed and placed in small pots and transferred to Alnarp for analysis.
2.4 SE-HPLC analysis
2.4.1 Sample preparation
Barely, malted barley and samples 2a, 3a, 3c, 4c, 6 and 8 have earlier been selected for SE-HPLC analyses by SLU.
The barley, malted barley and samples 2a – 4c were homogenised with an IKA WERKE A10 for 10 seconds (barley was homogenised for 16 seconds). Double samples were prepared by weighing in 16,5 (± 0,05) mg in 2 eppendorf tubes of each samples. The samples were dissolved in 1,5 ml extraction buffer (0,5 % dilute sodium dodecyl sulphate (SDS)), 0,05 M NaH2PO4, pH 6,9) by using Vortex Whirli VIB2 for a few seconds. The samples were shaken for 5 minutes at 2 000 rpm using IKA-VIBRAX-WXR and then centrifuged for 30 minutes at 12 000 rpm using Eppendorf Centrifuge 5415C. The supernatant were directly transferred to HPLC-vials. The proteins in these vials are the SDS-extractable proteins.
The pellets were dissolved in 1,5 ml extraction buffer and then sonicated for 45 seconds using Sanyo Sonipep 150. The samples were then centrifuged for 30 minutes and the supernatant were directly transferred to HPLC-vials. The proteins in these vials are called SDS-unextractable proteins, released by sonication.
2.4.2 SE-HPLC analyse
All the samples were analysed in a Waters 2690 Separation Module with a
Photodiode Array detector (996). Twenty microlitres of sample were injected and separated in a SE-HPLC Phenomenex colon (Biosep-SEC-S 4000 PEEK) with isocratic flow at 0,2 ml/min (50 % acetonitrile, 0,1 % triflouroacetic acid; 50% H2O, 0,1 %, trifluoroacetic acid).
17
The chromatograms were integrated, according to Larroque, O.R., 1996, using the integration software Millenium into four sections with decreasing molecular size:
large polymeric proteins (LPP) small polymeric proteins (SPP) large monomeric proteins (LMP) small monomeric proteins (SMP)
The extractable proteins are called eLPP, eSPP, eLMP and eSMP and the SDS-unextractable proteins are called uLPP, uSPP, uLMP and uSMP. From these data the percentage of large unextractable polymeric protein in the total large polymeric protein (%LUPP) was calculated as:
%LUPP = 100 × area (uLPP) area (uLPP + eLPP)
The percentage of total unextractable polymeric proteins in total polymeric proteins (%TUPP) were calculated as:
%TUPP = 100 × area (uLPP+uSPP)
area (uLPP + uSPP + eLPP + eSPP)
The percentage of small unextractable monomeric proteins in total small monomeric proteins (%SUMP )were calculated as:
%SUMP = 100 × area (uSMP) area (eSMP + eSMP)
The percentage of SMP in total protein was also calculated for all the samples (%SMP/TOT PR).
18 2.4.3 Statistical analyse
The difference in protein content in barley grown in Uppåkra or Fuglie with different amounts of nitrogen fertilizer added were analysed with two-way analysis of
variance (ANOVA) with replicates using Kyplot (version 2.0 beta).
3.0 RESULTS AND DISCUSSION
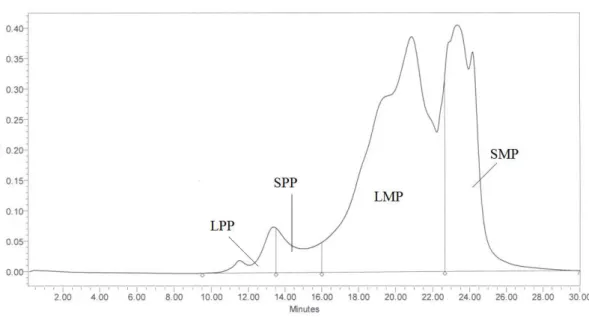
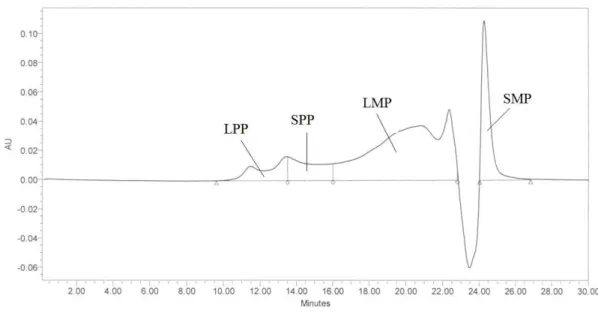
Two chromatograms were obtained for each sample: SDS-extractable proteins (proteins soluble in SDS) (see fig 3) and SDS-unextractable proteins (proteins soluble only after sonication) (see fig 4). The chromatograms were integrated into four sections with decreasing molecular size: large polymeric proteins (LPP), small polymeric proteins (SPP), large monomeric proteins (LMP) and small monomeric proteins (SMP).
Figur 3. Example of a chromatogram for SDS-extractable proteins. (LPP = large polymeric proteins, SPP = small polymeric proteins, LMP = large monomeric proteins, SMP = small monomeric proteins)
19
Figur 4. Example of a chromatogram from SE-HPLC for SDS-unextractable proteins. (LPP = large polymeric proteins, SPP = small polymeric proteins, LMP = large monomeric proteins, SMP = small monomeric proteins)
To study how the protein composition varies during the brewing process a diagram with the composition of LPP, SPP, LMP and SMP in each brewing step was constructed, se fig 5. Since Uppåkra 70 it is the only one with a complete list of samples it was chosen for the purpose.
Uppåkra 70 Protein composition
0 20 40 60 80 100 120 Bar ley Malt Bet aglu can rest Pro tein rest Ferm enta tion star t Bot tle ta ppin g % SMP LMP SPP LPP
20
Fig 5 shows how the protein composition varies during the brewing process, with no respect taken to whether the proteins are extractable or unextractable. It shows how both LPP and SPP are broken down into LMP and SMP during the brewing process. The amounts LMP are first increasing during malting, but after mashing these are also broken down into SMP. When malting, the LPP and SPP are broken down into LMP and SMP and it is likely to assume that some LMP are broken down into SMP as well. This continues during the beginning of mashing, but between the beta-glucan rest and the protein rest there are very small changes. At the start of fermentation there are almost no LPP or SPP left and many LMP has been broken down into SMP. In the final beer product there are no polymeric proteins left, and 70 % of the
proteins are SMP. This means that somewhere after the protein rest and before the start of fermentation the most of the proteins are degraded into small monomeric proteins, probably during the end of the mashing programme or during the wort boiling. It would be interesting to have the results from the start of wort boiling and at the end of wort boiling samples to easier follow the degradation of the proteins.
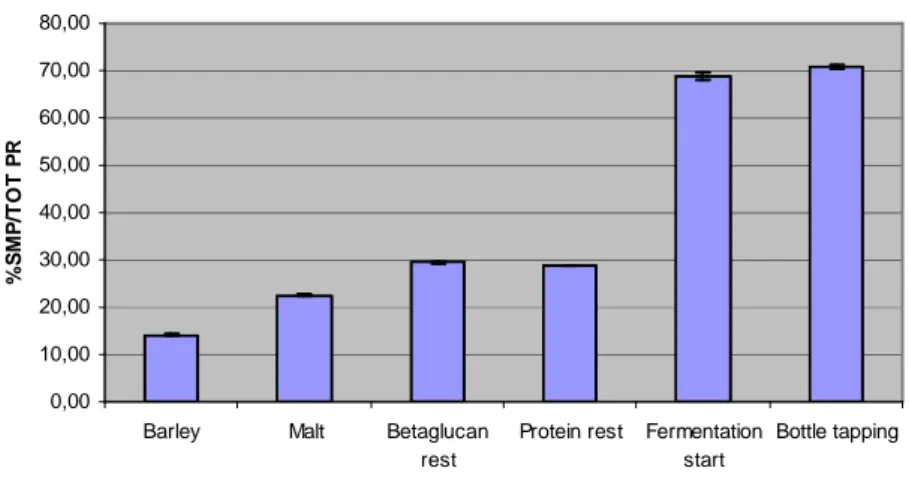
The SMP fraction contains the albumins, for example LTP1 and protein Z, that are involved in the beers foam and haze formation. But, LTP1 and protein Z is already present in the barley and is not denatured during the brewing process (though it is modified to some extent). It is therefore to be assumed that they are present in the SMP fraction in barley, which represents approximately 10% of the total protein in barley. It can then also be presumed that the SMP that are formed during the malting and brewing process are not LTP1 or protein Z. For an easier view how only the amount of SMP varies during the brewing process, see fig 6.
21 Uppåkra 70 %SMP/TOT PR 0,00 10,00 20,00 30,00 40,00 50,00 60,00 70,00 80,00
Barley Malt Betaglucan
rest
Protein rest Fermentation
start Bottle tapping % S M P /T O T P R
Fig. 6. How %SMP/TOT PR changes during the brewing process.
To examine if there is any difference in the protein composition in the different samples taken out from the beer brewing process depending on the place of growth and amount of nitrogen in fertilisation an ANOVA was performed on the following variables:
%LUPP: the percentage of large unextractable polymeric protein in the total large polymeric protein
%TUPP: the percentage of total unextractable polymeric proteins in total polymeric proteins
%SUMP: the percentage of small unextractable monomeric proteins in total small monomeric proteins
TOT U: total unextractable proteins TOT E: total extractable proteins TOT PR: total protein
%SMP/TOT PR: the percentage of total small monomeric proteins in total proteins
The total extractable proteins (TOTE), total unextractable proteins (TOTU) and total proteins (TOTPR) were calculated by adding LPP, SPP, LMP and SMP for
respective extractable, unextractable and total (extractable + unextractable) proteins, all these values, with their ANOVA results, are shown below in table III-XVI.
22 Table III.
Calculated values for barley. Column to the left with location, nitrogen add and repetition. Fields
marked - represent inconclusive or non-existing data.
Location
(Nitrogen:rep) %LUPP %TUPP %SUMP
TOTE (×108) TOTU (×107) TOT PR (×108) %SMP/ TOT PR Uppåkra (70:1) 25,75 26,33 19,84 1,05 2,72 1,33 14,32 Uppåkra (70:2) 28,81 28,15 20,54 1,03 2,90 1,32 14,08 Uppåkra (110:1) - - - - Uppåkra (110:2) - - - - Fuglie (70:1) - - - - Fuglie (70:2) - - - - Fuglie (110:1) 34,34 33,33 21,38 1,10 3,74 1,48 12,38 Fuglie (110:2) 33,63 31,75 19,62 1,15 3,54 1,51 12,73
Barley has not a completed list since the barley samples for Uppåkra 110 and Fuglie 70 could not be found. It is unfortunate; it should have been interesting to perform an ANOVA on these results to see if it is any difference in the protein content.
23 Table IV.
Calculated values for malted barley (1). Column to the left with location, nitrogen add and repetition. Fields marked - represent inconclusive or non-existing data.
Location
(nitrogen:rep) %LUPP %TUPP %SUMP
TOTE (×108) TOTU (×107) TOT PR (×108) %SMP/ TOT PR Uppåkra (70:1) 19,63 20,27 10,46 1,34 2,20 1,56 22,32 Uppåkra (70:2) 20,79 20,82 9,74 1,37 2,13 1,58 22,56 Uppåkra (110:1) 24,15 23,31 10,95 1,32 2,54 1,57 22,14 Uppåkra (110:2) 25,74 24,92 11,12 1,29 2,59 1,55 22,44 Fuglie (70:1) 25,98 24,21 9,68 1,32 2,14 1,53 23,23 Fuglie (70:2) 7,72 13,18 9,65 1,27 1,92 1,46 23,02 Fuglie (110:1) - - - - Fuglie (110:2) - - - -
Malted barley has not a completed list since the barley samples for Fuglie 110 could not be found. As for unmalted barley, it would be interesting to perform an ANOVA to find if there is any difference in protein content. The low values for Fuglie 70:2 are due to an error in the chromatogram and are therefore not reliable values. When comparing Uppåkra 70 and Uppåkra 110 an increase in %LUPP can be noticed as well as a small increase in %TUPP, but no increase in total protein. This indicates that higher amount nitrogen added to the soil gives an increase in unextractable proteins, but not in the total protein content, for malted barley.
24 Table V.
Calculated values for beta—glucan rest (2a). Column to the left with location, nitrogen add and repetition.
Location
(nitrogen:rep) %LUPP %TUPP %SUMP
TOTE (×108) TOTU (×107) TOT PR (×108) %SMP/ TOT PR Uppåkra (70:1) 19,32 17,50 8,08 1,29 1,56 1,44 29,63 Uppåkra (70:2) 21,26 18,59 8,03 1,29 1,56 1,44 29,34 Uppåkra (110:1) 21,02 18,83 7,21 1,53 1,83 1,71 27,46 Uppåkra (110:2) 20,23 18,13 7,53 1,49 1,75 1,67 27,33 Fuglie (70:1) 19,68 16,93 7,68 1,34 1,44 1,48 29,31 Fuglie (70:2) 18,54 16,46 7,37 1,37 1,44 1,52 29,17 Fuglie (110:1) 18,06 15,82 7,24 1,45 1,48 1,60 29,06 Fuglie (110:2) 18,63 16,41 7,17 1,47 1,52 1,63 28,40 Table VI.
Mean square from two-way ANOVA with replicates for beta-glucan rest (2a).
Source dF %LUPP %TUPP %SUMP TOTE TOTU TOT PR
%SMP/ TOT PR location 1 5,99* 6,90** 0,242* 2,71 × 1012 N.S 8,46 x 10¹²*** 1,60 x 10¹² N.S 0,730* nitrogen 1 0,0925 N.S 0,0105 N.S 0,505* 5,48 x1014*** 4,31 x 10¹²** 6,49 x 10¹⁴*** 2,23** Significant at * = P<0,05, ** = P<0,01, *** = P<0,005, N.S = not significant
The ANOVA-results from the beta-glucan rest shows that the two different locations do not have a significant difference in total protein content, but higher amount
nitrogen added to the soil shows a difference with high significance. It has previously been shown that more nitrogen added to the soil when growing wheat has resulted in an increased protein content (Labuschagne M.T., 2005). This seems to agree with the analysis for barley after the beta-glucan rest, but since this could not be observed for malted barley (and there were no values for barley to investigate) it is difficult to draw any conclusions. The higher amount of nitrogen does not seem to have any influence on %LUPP or %TUPP after the beta-glucan rest though.
25
The values for the beta-glucan rest shows that %LUPP, %TUPP, %SUMP and %SMP/TOT PR is quite unchanged when comparing the different places and
different added nitrogen. The total protein values though shows some difference with different added nitrogen, both Fuglie and Uppåkra has a small increase in total protein content with more nitrogen added to the soil.
Table VII.
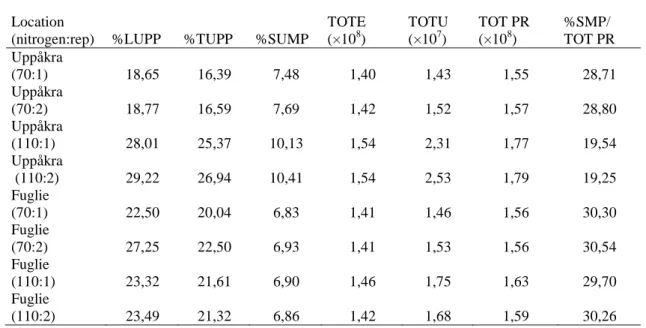
Calculated values for protein rest (3a). Column to the left with location, nitrogen add and repetition.
Location
(nitrogen:rep) %LUPP %TUPP %SUMP
TOTE (×108) TOTU (×107) TOT PR (×108) %SMP/ TOT PR Uppåkra (70:1) 18,65 16,39 7,48 1,40 1,43 1,55 28,71 Uppåkra (70:2) 18,77 16,59 7,69 1,42 1,52 1,57 28,80 Uppåkra (110:1) 28,01 25,37 10,13 1,54 2,31 1,77 19,54 Uppåkra (110:2) 29,22 26,94 10,41 1,54 2,53 1,79 19,25 Fuglie (70:1) 22,50 20,04 6,83 1,41 1,46 1,56 30,30 Fuglie (70:2) 27,25 22,50 6,93 1,41 1,53 1,56 30,54 Fuglie (110:1) 23,32 21,61 6,90 1,46 1,75 1,63 29,70 Fuglie (110:2) 23,49 21,32 6,86 1,42 1,68 1,59 30,26 Table VIII.
Mean square from two-way ANOVA with replicates for protein rest.
Source dF %LUPP %TUPP %SUMP TOTE TOTU TOT PR
%SMP/ TOT PR location 1 0,456 N.S 0,00405 N.S 8,38*** 5,34 × 10¹³** 2,34 x 10¹³** 1,47 x 10¹⁴** 75,0*** nitrogen 1 35,6* 48,6** 3,60*** 1,20 x10¹⁴** 6,78 x 10¹³*** 3,67 x 10¹⁴*** 48,0*** Significant at * = P<0,05, ** = P<0,01, *** = P<0,005, N.S = not significant
The ANOVA results for the wort after the protein rest shows significant differences for almost all the data, apart from %LUPP and %TUPP with different locations, which showed a significant difference before the protein rest. But these values are not to rely on because %LUPP and %TUPP for Fuglie 70:2 seems to be to outliers.
26
When study the data in table VII one can notice the difference between the locations, which ANOVA can not find, probably is due to the odd value for Fuglie 70:2.
Before the protein rest there were no significant difference between Fuglie and Uppåkra’s total protein content, but after the protein rest there was a significant difference (p<0,01). Notable is that the total protein content increase more for Uppåkra when more nitrogen is added to the soil, than for Fuglie.
Table IX
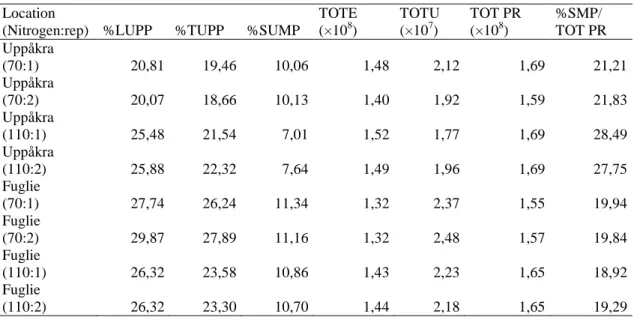
Calculated values for proteinrest retentate (3c). Column to the left with location, nitrogen add and repetition.
Location
(Nitrogen:rep) %LUPP %TUPP %SUMP
TOTE (×108) TOTU (×107) TOT PR (×108) %SMP/ TOT PR Uppåkra (70:1) 20,81 19,46 10,06 1,48 2,12 1,69 21,21 Uppåkra (70:2) 20,07 18,66 10,13 1,40 1,92 1,59 21,83 Uppåkra (110:1) 25,48 21,54 7,01 1,52 1,77 1,69 28,49 Uppåkra (110:2) 25,88 22,32 7,64 1,49 1,96 1,69 27,75 Fuglie (70:1) 27,74 26,24 11,34 1,32 2,37 1,55 19,94 Fuglie (70:2) 29,87 27,89 11,16 1,32 2,48 1,57 19,84 Fuglie (110:1) 26,32 23,58 10,86 1,43 2,23 1,65 18,92 Fuglie (110:2) 26,32 23,30 10,70 1,44 2,18 1,65 19,29 Table X.
Mean square from two-way ANOVA with replicates for protein rest retentate.
Source dF %LUPP %TUPP %SUMP TOTE TOTU TOT PR
%SMP/ TOT PR location 1 40,5** 45,3*** 10,6*** 1,87 × 1014* 2,83 x 1013** 7,00 x 10¹³ N.S 57,4*** nitrogen 1 3,80 N.S 0,285 N.S 5,25*** 1,63 x1014* 7,35 x 1012 N.S 1,01 x 10¹⁴ N.S 18,7*** Significant at * = P<0,05, ** = P<0,01, *** = P<0,005, N.S = not significant
The results for the protein rest retentate (table IX) show some interesting data. Uppåkra shows no difference in total protein content when more nitrogen is added to the soil, but an increase can though be seen for %SMP/TOT PR. This could not be seen for the total sample for the protein rest (3a). This suggests that the proportion of
27
small monomeric proteins (SMP) is increasing in the protein rest retentate sample when more nitrogen is added to the soil in Uppåkra (not in Fuglie), but not in the total sample after the protein rest. One explanation is that the nitrogen could cause SMP to be more unextractable, and this explains why a difference can be seen in the protein rest retentate and not in the total sample after the protein rest.
Table XI
Calculated values for spent grain (4c) in the different barleys. Column to the left with location, nitrogen add and repetition.
Location
(Nitrogen:rep) %LUPP %TUPP %SUMP
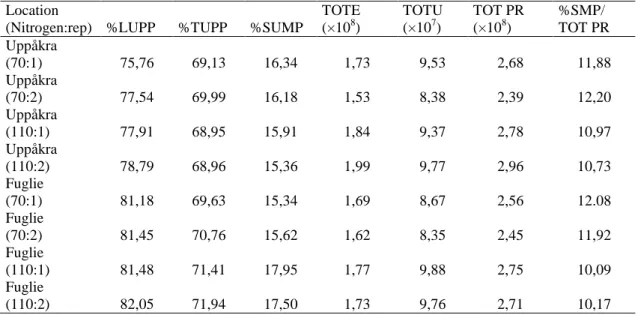
TOTE (×108) TOTU (×107) TOT PR (×108) %SMP/ TOT PR Uppåkra (70:1) 75,76 69,13 16,34 1,73 9,53 2,68 11,88 Uppåkra (70:2) 77,54 69,99 16,18 1,53 8,38 2,39 12,20 Uppåkra (110:1) 77,91 68,95 15,91 1,84 9,37 2,78 10,97 Uppåkra (110:2) 78,79 68,96 15,36 1,99 9,77 2,96 10,73 Fuglie (70:1) 81,18 69,63 15,34 1,69 8,67 2,56 12.08 Fuglie (70:2) 81,45 70,76 15,62 1,62 8,35 2,45 11,92 Fuglie (110:1) 81,48 71,41 17,95 1,77 9,88 2,75 10,09 Fuglie (110:2) 82,05 71,94 17,50 1,73 9,76 2,71 10,17 Table XII
Mean square from two-way ANOVA with replicates for spent grain.
* = P<0,05, ** = P<0,01, *** = P<0,005, N.S = not significant
When examining the result in table XI, without taking any regards to the ANOVA results, no big differences can be seen in any of the results, relatively many other samples. Though, the ANOVA results show that there are some significant differences, but they are not that large as have been seen before. This suggest that
Source dF %LUPP %TUPP %SUMP TOTE TOTU TOT PR
%SMP/ TOT PR location 1 32,6 ** 5,63* 0,858* 1,14 × 1014 N.S 1,92 x 10¹² N.S 1,45 x 10¹⁴ N.S 0,284* nitrogen 1 2,31 N.S 0,382 N.S 1,31* 6,89 x 1014* 1,85 x 1014* 1,59 x 1015* 4,67***
28
location and amount nitrogen added to the soil do not have a great influence on the protein content in the spent grain.
Table XIII
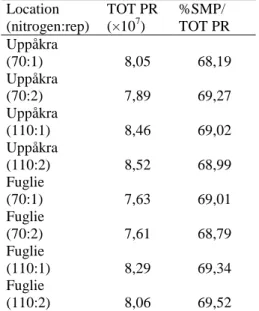
Calculated values for fermentation start for the different barleys. Colum to the left with location, nitrogen add and repetition.
Location (nitrogen:rep) TOT PR (×107) %SMP/ TOT PR Uppåkra (70:1) 8,05 68,19 Uppåkra (70:2) 7,89 69,27 Uppåkra (110:1) 8,46 69,02 Uppåkra (110:2) 8,52 68,99 Fuglie (70:1) 7,63 69,01 Fuglie (70:2) 7,61 68,79 Fuglie (110:1) 8,29 69,34 Fuglie (110:2) 8,06 69,52 Table XIV
Results from two-way ANOVA with replicates for fermentation start.
Source dF TOT PR %SMP/TOT PR
location 1 2,26 x 10¹³** 0,179 N.S nitrogen 1 5,74 x 10¹³** 0,328 N.S * = P<0,05, ** = P<0,01, *** = P<0,005, N.S = not significant
The ANOVA results for sample “fermentation start” shows that there is a significant difference (p<0,01) in total protein content, both when changing locations and
nitrogen add. No difference could be seen for %SMP/TOT PR, neither for location or added nitrogen.
29 Table XV
Calculated values for bottle tapping (8). Column to the left with location, nitrogen add and repetition. Location (nitrogen:rep) TOT PR (×108) %SMP/TOT PR Uppåkra (70:1) 1,64 71,08 Uppåkra (70:2) 1,64 70,68 Uppåkra (110:1) 1,86 69,41 Uppåkra (110:2) 1,85 69,46 Fuglie (70:1) 1,58 70,51 Fuglie (70:2) 1,58 70,50 Fuglie (110:1) 1,70 70,68 Fuglie (110:2) 1,69 70,58 Table XVI
Results from two-way ANOVA with replicates for bottle tapping
Source dF TOT PR %SMP/TOT PR
location 1 2,50 x 10¹⁴*** 0,342* nitrogen 1 5,44 x 10¹⁴*** 0,868** * = P<0,05, ** = P<0,01, *** = P<0,005, N.S = not significant
The ANOVA results for bottle tapping shows that there there are significant differnces in both location and nitrogen in fertilisation (p<0,005) in total protein content. But when the data in table XV is examined, differences in SMP/TOT PR can hardly be seen. The difference that ANOVA can find is so small that it is not likely that it has an influence on the beer in reality. A bigger difference can be seen in total protein content, but since there are almost no changes in SMP, which are the proteins with known influence on the beer, this has probably no influence on the beer.
It would be interesting to go further with the project and get hold of which specific proteins that differs with different locations and amount of nitrogen. Does it have any impact on the beer haze active proteins or maybe foam positive proteins? Even though there are small changes over all for SMP, it could be big changes for one specific protein. If it was shown that the location and amount nitrogen added in the
30
soil for the grown barley has an impact on proteins involved with the quality of the beer this would be important for many breweries. In that case it would be easier for the brewery to achieve the optimal final product by choosing a specific location for growing barley, or to change the amount of nitrogen added to the soil.
Noteable in the results are the total protein content in the protein rest retentate sample. This sample is in fact quite like the spent grain in theory, only it is taken out before the hole mashing programme is completed and it is not sparged, it is just a retentate. But when comparing this sample with the total protein rest sample and with the spent grain sample, some interesting facts can be seen. The total protein content in Uppåkra 70 (first repetition) protein rest sample is 1,55 × 10⁸ area units (since no reference was used in the measurements no quantitative unit can be presented, the values are only compared with each other), 1,69 × 10⁸ area units for the protein rest retentate sample and 2,68 × 10⁸ area units for spent grain (values from tables VII, IX and XI). So, there is a small increase for the protein rest retentate sample comparing with the protein rest sample, and a bigger increase in the protein content when comparing the protein rest retentate sample with the spent grain. This pattern can be seen for all the different barleys. This shows that it is the sparging of the spent grain that contribute the most to yield a good exchange in lautering, the retentate still contains dissolved substances that is wanted in the beer. This is why sparging is so important in beer brewing, if there was no sparging a lot of the dissolved substances would be left in the spent grain.
Since Uppåkra 70 is the only one of the four different barleys with complete data, it was chosen for the purpose to investigate the changes in protein composition and changes in extractability during the brewing process. The mean and standard derivation was calculated for each sample and from this, diagrams was constructed where %LUPP, %TUPP, %SUMP and the protein composition were followed throughout the brewing process, see figur 7, 8 and 9. (As protein rest retentate not is a total sample and spent grain is removed from the beer, these two are not in the
31
diagrams). The diagram with %LUPP, %TUPP and %SUMP shows changes in extractability during the brewing process.
Uppåkra 70 %LUPP 0 5 10 15 20 25 30 35
Barley Malt Betaglucan
rest
Protein rest Ferment ation start Bottle tapping % L U P P
Fig. 7. How %LUPP varies during the brewing process.
Figur 7 shows that the percentage of large unextractable polymeric protein in total large polymeric proteins decreases when the barleys is malted, from 27% to 20 %. After the beta-glucan rest and the proteins rest throughout the mashing the % LUPP is about unchanged. When the beer is lautered all the unextractable proteins is left in the spent grain and the wort only contains extractable proteins. This does not change during fermentation or storage for 40 days.
32 Uppåkra 70 %TUPP 0 5 10 15 20 25 30
Barley Malt Betaglucan rest
Protein rest Fermentation start Bottle tapping % T U P P
Fig. 8. How %TUPP varies during the brewing process.
Fig 8 shows similar results as for Uppåkra 70 %LUPP, the only difference is that %TUPP is decreasing slightly more during mashing then what %LUPP did. These data suggest that during mashing there are more small polymeric proteins then large polymeric proteins that transforms to extractable proteins. This could be because the smaller proteins easier transforms extractable then the larger proteins.
Uppåkra 70 %SUMP 0,00 5,00 10,00 15,00 20,00 25,00
Barley Malt Betaglucan rest
Protein rest Fermentation start Bottle tapping % S U M P
33
The percentage of small unextractable monomeric proteins in total small monomeric proteins (%SUMP) varies different then %LUPP and %TUPP. After malting only half of the unextractable proteins in barley are left, the other have transformed into extractable proteins. After the beta-glucan rest a small decrease in %SUMP can be observed, which could not be seen for %LUPP. After the protein rest no changes can be observed. This data also suggests that smaller proteins easier transform
extractable then larger proteins.
4.0 CONCLUSIONS
•
During the beer brewing process the polymeric proteins are degraded into monomeric proteins and in the final product approximately 70 % are small monomeric proteins, the rest are large monomeric proteins. There are no polymeric proteins left in the final product.•
The most of the proteins are degraded into small monomeric proteinssomewhere between the end of the protein rest and the start of fermentation.
•
In the final beer product the ANOVA results shows a significant difference both in total protein content and %SMP in total protein between the two locations as well as for the amount of nitrogen added to the soil. The differences in %SMP in total protein were however small and are therefore not likely to have a great influence on the beer.•
The unextractable proteins were transformed to extractable during the malting and mashing and after lautering no unextractable proteins are left in the wort.•
It would be interesting to further examine which specific proteins that differ with location and nitrogen add. It would also be interesting to examine more samples taken from the beer brewing process, for examples the samples taken before and after wort boiling to follow the degradation of the proteins in a greater detail.34
5.0 REFERENCES
Briggs D.E., Hough J.S., Stevens R., Young T.W. (1981) Malting and brewing science volume 1, Malt and sweet wort, New York: Kluwer Academic/Plenum Publishers
Cooper D. J.,. Husband F. A,. Mills E. N. C, and Wilde P. J., (2002) Role of beer lipid-binding proteins in preventing lipid destabilization of foam, Journal of Agricultural and food chemistry 50, 7645-7650
Curioni A., Pressi G., Furegon L., Peruffo A. D. B., (1995) Major proteins of beer and their precursors in barley: Electrophoretic and immunological studies, Journal of Agricultural and food chemistry 43, 2620–2626
Ferreira I., Jorge K., Nogueria L., Silva F., Trugo L., (2005) Effects of the
combination of hydrophobic polypeptides, iso-α acids and malto-oligosaccharides on beer foam stability, Journal of Agricultural and food chemistry 53, 4976–4981
Hough J.S., Briggs D.E., Stevens R., Young T.W. (1982) Malting and brewing science volume 2, Hopped wort and beer, Gaithersburg, Maryland: Aspen Publishers
Iimure T., Nankaku N., Watanabe-Sugimoto M., Hirota N., Tiansu Z., Kihara M., Hayashi K,. Ito K,. Sato K., (2009) Identification of novel haze-active beer proteins by proteome analysis, Journal of Cereal Science 49 141–147
Iimure T., Takoi K., Kaneko T., Kihara M., Hayashi K., Ito K, Sato K., Takeda K. (2008) Novel prediction method of beer foam stability using protein Z,
barley dimeric α-amylase inhibitor-1 (BDAI-1) and yeast thioredoxin, Journal of Agricultural and food chemistry 56, 8664–8671
35
Labuschagne M.T., Meintjes G., Groenewald F.P.C. (2006) The influence of different nitrogen treatments on the size distributionof protein fractions in hard and soft wheat, Journal of Cereal Science 43 315–321
Larroque, O.R., Gianibelli, M.C., Batey, I.L., MacRitchie, F., (1996). Identification of elution subfractions from the first peak in SE-HPLC chromatograms of wheat storage protein. Wrigley, C.W., (Ed.), Proceedings of Sixth International Gluten Workshop, Cereal Chemistry Division, Royal Australian Chemical Institute, North Melbourne, Australia, 288-293
Leisegang, R.; Stahl, U. (2005) Degradation of a foam-promoting barley protein by a proteinase from brewing yeast, J. Inst. Brew. 111, 112-117
Robinson L., Healy P., Stewart D., Eglinton J., Ford C., Evans D., (2007) The identification of a barley haze active protein that influences beer haze stability: The genetic basis of a barley malt haze active protein, Journal of Cereal Science 45, 335– 342
Silva F., Nogueira L. C., Gonçalves C., Ferreira A. A., Ferreira I., Teixeira N. (2008), Electrophoretic and HPLC methods for comparative study of the protein fractions of malts, worts and beers produced from Scarlett and Prestige barley (Hordeum vulgare L.) varieties, Food Chemistry 106, 820–829
Swadesh J., (2001) HPLC: practical and industrial applications, Crc Press
Treimo J., Aspmo S. I., Eijsink V. G. H., Horn S. J., (2008) Enzymatic solubilization of proteins in brewer’s spent grain, Journal of Agricultural and food chemistry 56, 5359-5365
Wilson K, Walker J, (2005), Principles and techniques of biochemistry and molecular biology, Hong Kong: Cambridge University press