MASTER
THESIS
Master Program in Business Development, 120 ECTS
Halmstad, May 2013
Winning Customers in the Era of Cloud
Business Intelligence: !
Key Adoption Factors from a Small and
Medium Enterprise perspective
Alessandro Agostini!
Supervisor: Henrik Florèn
Final Dissertation in Technical Project! 15 ECTS
Acknowledgements
This work marks the conclusion of the first year master’s program in Business Development and Management of Innovation. As the name implies, innovation has been one of the recurrent topic throughout the course. For this reason, I wanted to incorporate an element of newness in the final work, trying order to push forward the knowledge in a particular area. The field of Business Intelligence(BI) is truly an interesting one, that offers multiple paths to investigate. I chose my niche in two ways: from one side, I restricted the study to SMEs, since historically the business intelligence market has been driven by big companies who had the resources to purchase these expensive IT solutions. Even though Business Intelligence in SMEs is not a new research, I regard appropriate to give more consideration to it.
On the other side, the element of newness mentioned before is the cloud technology, whose significant commercial distribution started only few years ago. Hence, the focus will be on cloud Business Intelligence in small and medium sized enterprises. I firmly believe that any work of a certain magnitude requires passion as the first element to make it successful. Previous to this research, I was involved in a project outside the university that not only did it give me the competencies necessary to engage on this study, but also motivated me to pursue a subject completely unknown at that time. Having said that, I really enjoyed developing this investigation and I learnt priceless lessons that will stay with me forever. I sincerely hope that the outcomes of this thesis will be helpful both in providing useful insights to marketing managers and in improving the understanding of small and medium sized companies' needs in the domain of Businesss Intelligence.
Finally, I would wish to extend my deepest thanks to the following people:
• Henrik and Joakim, the supervisor and examiner, for tutoring and supporting throughout the process;
• My classmates who gave me valuable suggestions during the seminars and the class discussion;
• All the companies that took the time to participate in this study. Without them it would have not been possible;
• My opponents, whose constructive feedbacks helped me to improve the quality of the study;
• Sandeep Rao for inspiring, leading, teaching and challenging me on a daily basis.
Abstract
Due to the fast development of new technologies, the Business Intelligence market is changing rapidly, forcing vendors to adapt their offerings to the customers’ needs. As the amount of data available to companies has been substantially increasing in the past years, the need of suitable software tools that perform the right analyses became essential, even in the small and medium sized business' environment. The previous literature,focused on big firms and traditional implementation of Business Intelligence solutions, highlighted the importance of understanding the key factors in successful projects. In the past few years, a new delivery model for Business Intelligence software is taking place: the cloud computing. To date, key factors for adopting cloud Business Intelligence in small and medium sized enterprises (SMEs) have not been systematically investigated. Existing studies have rarely considered these arguments and we lack of a proven framework. This paper is aimed to fill this gap and the structure of the article is subordinated to this objective.
Firstly, the thesis offers an overview of the subject and the terminology used in it with the purpose of facilitating the understanding of a rather complex argument. Therefore, it starts with a short historical overview of the Business Intelligence sector, it defines the term Business Intelligence, and it explains both the characteristics of the Business Intelligence systems (cloud vs on-premise) and the importance of having a business intelligence solution for SME.
Subsequently, the theoretical framework of this study is defined, combining the prior theories and empirical data collected through the interviews with four Business Intelligence vendors and customers. Initially, the existing Critical Success Factors (CSFs) of IT and BI projects proposed by different authors in the literature are reviewed. Afterwards, the evaluation criteria for the cloud software are taken into consideration. By integrating insights drawn from these studies, as well as adding new factors coming from the interviews, a framework has been created and utilized as a basis for the further questionnaire development.
The choice of pursuing both the quantitative and qualitative approaches is aimed at improving the study’s reliability. Empirical data are mainly primary data, collected during a survey and four interviews, supported by secondary data such as general companies' reports, market and trends analysis from trustworthy sources.
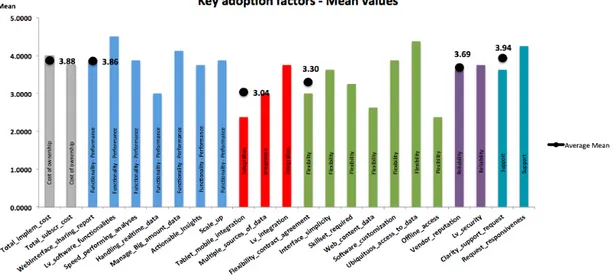
Based on the findings, the author of this thesis has ranked the key aspects of a cloud BI adoption in SMEs. It is revealed the most important key adoption factors that SMEs evaluate when purchasing a cloud BI solution are the level of software
functionalities, the ubiquitous access to data, the responsive answers to customer support requests, the ability to handle big amount of data and the implementation cost.
Regarding the managerial implications, the study’s practical relevance consists in offering to BI suppliers' managers, executives and decision-makers interesting areas of discussion for improving the knowledge of SMEs' needs. Moreover, the results of this investigation can be used by Business Intelligence newcomers as a guidance for evaluating solutions available in the market.
Acronyms and abbreviations
BI= Business Intelligence
SME= Small and Medium sized Enteprises RQ= Research Question
IT= Information Technology S-a-a-S= Software-as-a-Service P-a-a-S= Platform-as-a-Service I-a-a-S= Infrastructure-as-a-Service
CRM= Customer Relationship Management CSF= Critical Success Factor
KPI= Key Performance Indicators ERP= Enterprise Resource Planning HR= Human Resources
Table of Contents
1 Introduction ... 1
1.1 Background ... 1
1.2 Problem area ... 2
1.3 Purpose and research question ... 3
1.4 Chapters alignment ... 4
2 Previous research and definition of key concepts ... 5
2.1 Small and Medium sized Enterprises ... 5
2.2 Business Intelligence overview ... 6
2.2.1 Evolution of Business Intelligence ... 6
2.2.2 Definition of Business Intelligence ... 6
2.2.3 BI systems architecture ... 7
2.2.4 Cloud SaaS vs. traditional BI solutions: part one ... 8
2.2.5 Cloud SaaS vs. traditional BI solutions: part two ... 9
3 Literature review and research design ... 10
3.1 Key adoption factors: definition ... 10
3.2 Chapter’s structure ... 11
3.3 Key adoption factors in Business Intelligence ... 11
4 Research Methodology ... 14
4.1 Research purpose ... 14 4.2 Research design ... 15 4.3 Research approach ... 15 4.4 Research strategy ... 16 4.5 Literary sources ... 17 4.6 Empirical material ... 174.7 Sample and limitations ... 20
5 Results and analysis ... 22
5.1 Stage one: categorization of key adoption factors and discussion ... 22
5.1.1 Key factors from the qualitative interviews ... 24
5.2 Stage two: findings and discussion ... 27
6 Conclusions ... 35
6.1 Practical implications ... 35
6.2 Theoretical implications ... 36
6.3 Shortcomings of the study ... 37
6.4 Suggestions for further research ... 37
Table of Figures
List of Figures
Figure 1 - Classification of BI software (Vesset and McDonough, 2007) ... 6
Figure 2 - Business Intelligence framework (Watson and Wixon, 2007) ... 7
Figure 3 - Cloud computing ... 8
Figure 4 - SMEs Business Intelligence adoption ... 44
Figure 5 - Adoption process ... 9
Figure 6 - Evaluation Criteria and CSFs in the adoption process ... 11
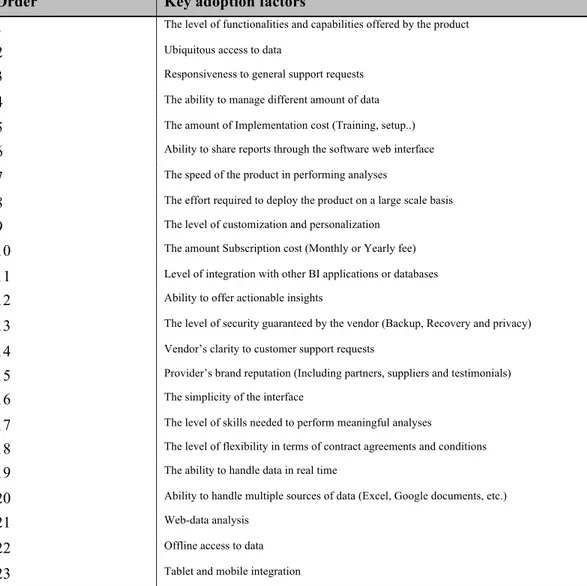
Figure 7 - Key adoption factors – descending order ... 28
Figure 8 - Payment method, customer service and type of preferred solutions ... 32
Figure 9 - Key adoption factors - Mean Values ... 28
List of Tables
Table 1 - Research methods ... 15Table 2 - Software-as-a-service evaluation factors ... 13
Table 3 - CSFs for IT/BI software ... 12
Table 4 - Categorization of key adoption factors for Saas BI ... 23
Table 7 - Key adoption factors - descending order ... 29
1. Introduction
This chapter includes a short overview of the Business Intelligence market, followed by the problem discussion and the proposed research question.
1.1 Background
The amount of data available for analyses is growing relentlessly and IBM estimates 90% of the data in the world has been created in the last three years (IBM research, 2011; Negash, 2004). In the last thirty years, storage space has been endlessly increasing whereas its cost has followed the opposite trend (Storage Trend study). Nowadays, more and more businesses are realizing the massive potential that lies in their data. Potential that can be leveraged to make better decisions, offer more value to both customers and shareholders, and discover patterns that could be “disruptive” (Scholz et al., 2010; Sheikh, 2011; Nyblom et al., 2012). The discipline that specializes in turning data into useful information is called Business Intelligence
(BI). Why is important for the economy of a company to have better information?
Answering this question is crucial, as remarked by other authors (Nyblom et al., 2012; Watson and Wixom, 2007).
Having access to the right information at the right time increases the likelihood of taking better decisions (Yeoh and Koronios, 2010). This will bring tangible benefits to the organization, which I categorize in Financial and Non-Financial. Revenue and cost are two important metrics for tracking the financial health of a company (Rust, 2002). The importance of any IT solution can be measured in terms of how it affects, directly or indirectly, the two aforementioned metrics (Poston & Grabski, 2001; Tata Consulting Service White paper, 2012). As a consequence, even the benefits of a BI system are measured in terms of “increased revenue” or “decreased costs”. Examples of benefits are the acquisition of new customers, upselling/cross-selling techniques, optimization of resource allocation, lowering operating costs and improve customer service (Vodapalli, 2009). Søilen and Sabanovic (2012) found that a quickier decision-making process was the main benefit users experienced with a BI adoption, which indirectly has a role in improving either the revenue or the cost. Watson and Wixon (2007) do not limit themselves to specify a single benefit, but they claim business intelligence solutions are important in the whole process that leads to better decisions, namely from gathering and storing data to supporting for the accomplishment of strategic business objectives.
Having said that, most of the benefits are difficult to quantify in terms of revenue or cost, since some of them are hidden behind the multiple activities characterizing an organization. All of these benefits are named “Non-Financial” (Raisinghani, 2004). “In today's competitive environment , Business Intelligence software systems have
become a central concept. In the competition that exists, it is important for a company to have efficient and effective software systems to collect, process and store data of various kinds. For example, you have to have a good system for customer management, finance, sales monitoring and many more” (Nyblom et al., 2012).
Therefore, the competitive advantage can be achieved not only through the innovation in markets or products. Storing, collecting and analysing of information have become a new frontier of competitiveness, and some scholars foresee that data will become a new “corporate asset” and main source of revenue (Brown et al., 2011; Raisinghani, 2004). Many CIOs (Chief Information Officers) have been considering Business Intelligence a top priority for their organizations (Gartner, 2013), after many data
analytics best practices proved to offer enormous benefits to enterprises and individuals (LaValle et al., 2011; May, 2009). Moreover, the benefits arising from the collection and analysis of data are not restricted to a specific industry, but they may relate to the majority of organizations (Gangadharan and Swami, 2004; Raisinghani, 2004). Sure enough, many sectors have already gained benefits from data, but a lot of organizations still need to understand how to obtain value from it (LaValle et al., 2011). Below are only few examples drawn from the world of data analytics’ best practises (Raisinghani, 2004):
• The financial services are deeply influenced by the insights coming from data analysis. New spending patterns can emerge, individual credit history can be built, and the money transactions help to analyze different customers behaviours.
• The education sector is definitely a beneficiary of efficient data management. Analyze figures coming from computerize software tests can offer insights that lead to better students test assessment.
• Food and agriculture are two areas of main concern for the governments worldwide, especially due to the ongoing increase in the world population. Predicting the food production trends can reduce waste and spoilage or improve the availability of crop storage.
Historically, the BI systems have been mainly adopted in large and multinational enterprises (Olszak and Ziemba, 2012; Wong, 2005) which could afford the hefty cost required in terms of money, expertise and capabilities. As remarked by other scholars (Søilen et al., 2012; Hwang et al. 2004), the resources necessary to implement a traditional BI tool are not available in most SMEs. Bergeron reports similar findings and suggests that conventional BI systems would not meet the needs of SMEs (Bergeron, 2000; InsideInfo Whitepaper). Furthermore, despite all the precautions taken, the enormous failure rate that characterizes BI projects, over 50%, (Beal, 2005; Meehan, 2011; Laskowski, 2001; Legodi and Barry, 2010 found in Adamala and Cidrin, 2011) does not encourage SMEs to invest in these risky activities.
Although major organisations have led the way in introducing and implementing Business Intelligence solutions, the recent increase of globalization, competition and the amount of data to be processed has been forcing SMEs to evaluate the purchase of BI tools (Olszak and Ziemba, 2012; Wong, 2005). These software applications do help a small business compete with larger ones, increase market share or provide insights and patterns that otherwise can not be seen (Grabova et al., 2010). Olszak and Ziemba (2012) surveyed business-owners and mangers of SMEs, who confirmed the importance of analysing data even in a small company:
"In our companies, as in large enterprises, there is a need for fast and accurate assessment of market needs, effective discovering of market niches and avoidance of unnecessary costs" (Olszak and Ziemba, 2012).
1.2 Problem area
In the last few years, uncertain and turbulent economic conditions have forced companies, small as well as big ones, to find ways for streamlining operations and cutting costs in many areas (Östling and Fredriksson, 2012; Sheikh, 2011). Moreover, the increase in data volume calls for an efficient way to manage the information within an organization, especially of a small and medium size where the use of Information Technology has consistently lag behind (Rath et al.).
The advent of cloud computing could represent a breakthrough for the IT segment, since the advantages brought in by this technology are particularly appealing to SMEs, and it potentially provides a solution for the two issues above-metioned (Benlian et al., 2009; Rath et al.). Following is an excerpt of the most significant:
• Limited financial risk: cloud solutions are generally characterized by low implementation costs, affordable monthly subscriptions that guarantee the use of the service, limited hardware expenses and the possibility to rescind the contract at anytime (Finch, 2007; Sheikh, 2011).
• An efficient way to manage the information: cloud computing, supported by the continuos increase in broadband availability (Sheikh, 2011), underlies systems that help managing the information in a ubiquituos and pervasive manner, across different platforms and applications (Doukas et al. 2010). • The ease-of-use of a cloud software removes the technological barriers that
might exist in SMEs, which might not have specialized and skilled people able to use complex IT systems. Cloud software can be effortless managed by both beginners and advanced users (Sheikh, 2011).
The importance of this technology is also demonstrated by the growth achieved in the recent years. Cloud Software-as-a-service (SaaS) market grew over 17% in 2012, reaching $14.5 billion in revenue and it is expected to hit $22 Billion in 2015 (Bucur, 2012). IDC forecasts that the amount of revenue generated by SaaS BI suppliers will expand three times as fast as the overall BI market for the year 2013, logging a Compound Annual Growth Rate (CAGR) of 22.4% (Deng and Zhang, 2012).
“On-demand computing or Software-as-a-service is the future of software and the future of BI, at least for the small-medium size business market, if not for a majority of standard enterprise reporting applications" - The DataWarehouse Institute, March 2007 (Sheikh, 2011, pp.7).
Therefore, if SMEs can find ways to successfully deploy cloud BI systems, it is reasonable to assume that those solutions will boost their market competitiveness and provide a means to manage the information more efficiently. However, despite all of the promising numbers and high expectations, the SaaS Business Intelligence market currently represents only 3% of the total BI turnover and the adoption rate among SMEs is still low (Figure 4; FSN, 2012; Rath et al.; Scholz et al., 2010). A variety of factors might explain this poor result, such as the novelty of SaaS technology, which has still to spread its power, or the fact that applications characterized by a high strategic importance for a company, such as BI, experience a lower adoption in a cloud setting.
Business Intelligence, cloud computing and SMEs are the subjects of extensive discussion in the literature: BI in SMEs (Olszak & Ziemba, 2012; Scholz et al., 2010; Nyblom et al., 2012; Wong, 2005), cloud BI (Sheikh, 2011; Bucur, 2012), adoption factors for cloud computing in SME (Rath et al.) cloud Enterprise Resource Planning systems (Östling & Fredriksson, 2012) to name just a few, but there is still a lack of knowledge on what happens specifically in the area of cloud SaaS Business
Intelligence for SMEs.
1.3 Purpose and research question
The volatile market conditions force Business Intelligence suppliers to adapt their offerings to the current customers’ needs. The knowledge of which key factors affect
the decision of a SME to adopt a cloud BI solution is rather unexplored. An ability to investigate it would have some practical and theoretical benefits:
• Understanding the real needs of SMEs in terms of managing the information, through the adoption of BI systems, in a more comprehensive way. The “use” of information has a drammatic influence on the performance of a small and medium sized organization (Lybaert 1998 found in Scholz et al., 2010). In addition, BI systems appeared to be adopted mostly in large and international companies and, thus, previous studies have been focused on those organizations (Scholz et al., 2010; Olszak and Ziemba, 2012; Wong, 2005). Nonetheless, the needs of an SME are quite different than big companies' ones (Scholz et al., 2010; Olszak and Ziemba, 2012).
• Preventing the development of initiatives or projects with poor market appeal or suggesting the BI suppliers to focus on critical issues that otherwise would have been overlooked – resulting in a more compelling offering for the customers .
• Providing a solid grounds for future research by validating and adding new perpectives to the current studies in the field of Business Intelligence. This study is partially built on previous knowledge of the adoption factors of Business Intelligence / IT software. The value of these studies will obviously decline with age, given the rapid advancement of technological innovation (Yeoh and Koronios, 2010).
The research would fill gaps in the theoretical field and will provide interesting managerial implications by answering the following Research Question (RQ):
What are the key factors for the adoption of a cloud BI solution in small and medium sized enterprises?
The objective of this thesis is to investigate what are the adoption factors for cloud BI solutions and how managers of cloud BI suppliers and SMEs can act on those factors. The paper reviews both the existing CSFs and the software evaluation criteria proposed by various authors in the literature. By combining these two sources of body of knowledge, the author creates a table that guides the identification of possible improvements in the literature and he tests its validity through multiple interviews. Finally, the revised version of the table will serve as a basis for the questionnaire development, whose results help answering the RQ.
1.4 Chapters alignment
Many studies deal with complex arguments that may not be easy to follow and grasp for the readers. Hence, it is of primary importance to present ideas in a logical and structured manner. In chapter one I describe the research background, the scope and limitations and the significance of this investigation, whose results can be applicable to a number of different sectors. Regarding the motivations that led me to investigate this domain, I briefly explained them in the acknowledgments section.
Next chapter, number two, will serve as an introduction to the argument of Business Intelligence in small and medium sized enterprises. Research works that deal with this type of organizations should provide a definition of a small and medium sized enterprises, since an unique agreement has yet to be found. Therefore, here I will define the boundaries of a SME and then continue with an overview of the business Intelligence subject, its definition, the main characteristics and the comparison between two different delivery models for Business Intellience solutions.
In chapter three, I present the literature review on Critical Success Factor for Business Intelligence with a focus on SMEs, and the evaluation criteria for IT software and SaaS solutions. Further, there is a description of how I have combined together these two sources of body of knowledge, which resulted in a table used as a bedrock for the following questionnaire (table 4).
In chapter four I will be discussing in detail the research methodology chosen. In particular, the purpose of the study, the research approach and strategy, the sample selection and the implications of my decisions. Chapter five is dedicated to the analysis of empirical data and it is divided into two parts. The first one is a summary of the main discussions that took place in the qualitative interviews, while in the second one I analyze the results coming from the questionnaire.
The last Chapter, number six, ends the overall thesis and provides the conclusions and implications of the study, both theoretical and managerial.
2. Previous research and definition of key concepts
Even though the focus of this investigation is not the exaplanation of the business intelligence market as a whole, I believe it is worth providing a brief introduction and explanation to the argument, due to the unfamiliarity that many have with some terminologies or processes. In this way, I have the opportunity to clarify some parts and guide the reader toward the focus of the research.
I deliberately decided to divide this section in two distinctive parts, each of them dedicated to the review of a specific area. In the first part I introduce the definition of small and medium sized enterprises (SMEs). The second part is about the Business Intelligence domain. Here, several sub-sections are presente: the history of Business Intelligence; a short explanation of Business Intelligence systems; a comparison between and cloud SaaS vs traditional BI solutions.
2.1 Small and medium sized enterprises
A unique definition of small and medium sized enterprise has not been decided yet (Carter and Jones-Evans, 2006) and, for the purpose of this study, a company is considered a SME if it fulfils the following requirements:
• Up to 500 employees and $25 M in annual revenue in the Unites States (Carter and Jones-Evans, 2006).
• Less than 250 workers; a maximum annual turnover of €50 million or €43 million in the balance-sheet, for european enteprises (Carter and Jones-Evans, 2006).
• For asian companies there is not an official definition and it varies greatly from country to country. For instance, chinese companies with 2000 employees can still be considered medium businesses, whereas in Lao, a company with more than 100 employees is considered a big company (Harvie, 2004; Xiangfeng, 2007).
Since this study encompasses businesses belonging to different countries, I will use all the three the above-mentioned definitions.
2.2 Business intelligence overview 2.2.1 Evolution of business intelligence
Business Intelligence is a term that may seem unknown to some, but it has roots long back in the past. It is commonly agreed the term Intelligence has been coined the first time by IBM analyst H.P. Luhn. He defined it as “the ability to apprehend the
interrelationships of presented facts in such a way as to guide action towards a desired goal” (Luhn, 1958). Therefore, the first decision-support systems were born
and further developed in the following years, becoming important IT solutions for supporting the decision-making process. In 1989, Howard Dresner proposed the widely accepted definition of Business Intelligence, still used today; ”concepts and
methods to improve business decision making by using fact-based support systems”
(Watson and Wixon, 2007).
2.2.2 Definition of business intelligence
After a detailed analysis of the literature, there exists so many and different definitions of BI that is fundamental to pick one and stick with it in the whole paper. Hence, with the term Business Intelligence I refer to the “processes, techniques or tools that support the making of faster and better decisions” (Pirttimäki and Hannula, 2003).
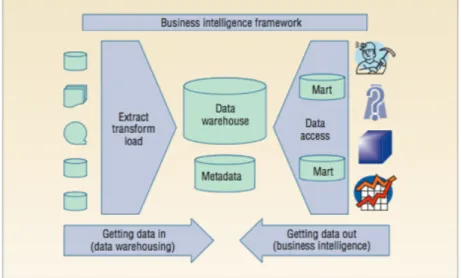
Taking as a reference the number of articles being published in the last 24 months, the hype around Business Intelligence has increased significantly, indicating that BI systems represent an important component of a modern enterprise’s information infrastructure, as they contribute to its success and competitiveness (Davenport et al., 2010). Moreover, the possibility to dig deeper into the consumer behaviors by analyzing multiple sources of data has become a central concept and activity within an organization (Nyblom et al., 2012). This study is not aimed at describing the business intelligence software in details, but clarifying some simple concepts related to the main functionalities is crucial to grasp the further sections of the paper. Historically, it was essential to not confuse the terms business analytics and Business Intelligence. They were not interchangeable and the best explanation of the differences has been given by Vesset and McDonough (2007) through the use of a self-explanatory image (Figure 1).
As the figure shows, the BI tools/software represented only a small set of a broader market segment called business analytics. In particular, we refer to the Business Intelligence application as the category involved in querying, reporting and analysis of data through the use of complex techniques.
Things started to change in the last years when the interest around the business intelligence market rose significantly, with a substantial number of new companies entered into this sector. This rapid increase might have caused the misuse of the term Business Intelligence, which has been referred wrongly to other types of software (Søilen and Hasslinger, 2012). Moreover, it is possible to find companies, that claim to offer Business Intelligence products, whose characteristics do not belong to any specific category defined by Vesse and Mcdonough (2007). As a consequence, the business intelligence market has been evolving in a more business homogeneous environment (Søilen and Hasslinger, 2012) where the boundaries defined by Vesse and Mcdonough (Figure 1) have been crossed many times. Given the previous considerations and for the purpose of this study, I consider appropriate to provide a definition of the BI systems:
“BI systems combine data gathering, data storage, and knowledge management with analytical tools to present complex internal and competitive information to planners and decision makers” (Negash, 2004, pp. 178).
2.2.3 BI systems' architecture
Short description of the basic BI functionalities
One of the main benefits offered by business intelligence solutions is the representation of structured and unstructured data in an easy and understandable format. Yet, the use of graphic and visualization tools to “make meaning” of data is only the final result of multiple processes taking place within a complex architecture. Details are not necessary for this research, but I want to provide a schematic overview of these processes.
Retrieving the previous definition of Business Intelligence, the act of taking better decisions is the ultimate stage of a process that starts with the collection of data coming from heterogeneous distributed systems. Then, the data will be consolidated
into a unique model and finally it will be used to feed the front-end applications for driving business analysis, reporting and querying (Vodapalli, 2009). It is possible to categorize all these processes in two main phases. The first one is to take all the data relevant to the company and keep it in specific storage place(s) called data warehouse(s). This process is called Getting data in (Watson and Wixon, 2007). The second step is called Getting data out, namely the action of retrieving all the data and show it in a comprehensible way: charts, table, maps and all visual expedients that make raw data easy to understand (Watson and Wixon, 2007). Therefore, in this brief paragraph I have explained what Business Intelligence is and what are the two main steps that characterize these IT tools: Getting data in and Getting data out.
2.2.4 Cloud SaaS vs traditional BI solutions: part one
From the late 1990s, many companies started using BI systems for two reasons: keep their knowledge stored in a single place and leverage it to gain better understanding of the business environment. Historically, the implementation of a BI software has been mostly a privilege of the big companies, who could afford the high costs that characterize these IT systems (Scholz et al., 2010; Olszak and Ziemba, 2012; Wong, 2005). As a matter of fact, the traditional BI systems were built on-premise, physically installed and run in the building of the company using the software. Therefore, on-premise BI systems were tailored to the specific needs of the
company, and this approach often had costs not sustainable for a small or medium sized business. For the sake of clarification, in this paper I will use
interchangeably the terms on-premise and traditional BI systems. In the last years, a new way of utilizing software has been taking place:
“Cloud computing is a model for enabling convenient, on-demand network access to a shared pool of configurable computing resources (e.g., networks, servers, storage, applications, and services) that can be rapidly provisioned and released with minimal management effort or service provider interaction” (Feenstra et al., pp. 3).
In general, cloud computing can be classified in three different layers:
Software-as-a-service (SaaS), Platform-as-a-Software-as-a-service (Paas), and Infrastructure-as-a-Software-as-a-service (Iaas)
(Zhang et al., 2010, Feenstra et al.), which represent the different delivery models for the cloud services (Östling and Fredriksson, 2012) (Figure 3).
The SaaS model, which will be the focus of this paper, can be defined as “renting” the software to customers who can access it through the web (Sheikh, 2011). During my research, I have noticed some ambiguity surrounding the “cloud” and “SaaS” definitions, which have often been confused. Hoping to shed some light, following is a short explanation:
“Software as a Service (SaaS) is defined as a software application delivery model, where a software vendor deploys and hosts software applications in a multi tenant (cloud) platform for its customers to operate the application over the Internet as services" (Liu et al., 2010).
All SaaS is cloud computing, but not all cloud computing is SaaS. In this article, I focus only on SaaS vendors and customers. From this point onwards, whenever I use the term cloud BI, I will refer to the top layer of the cloud infrastructure: SaaS cloud Business Intelligence.
2.2.5 Cloud SaaS vs traditional BI solutions: part two
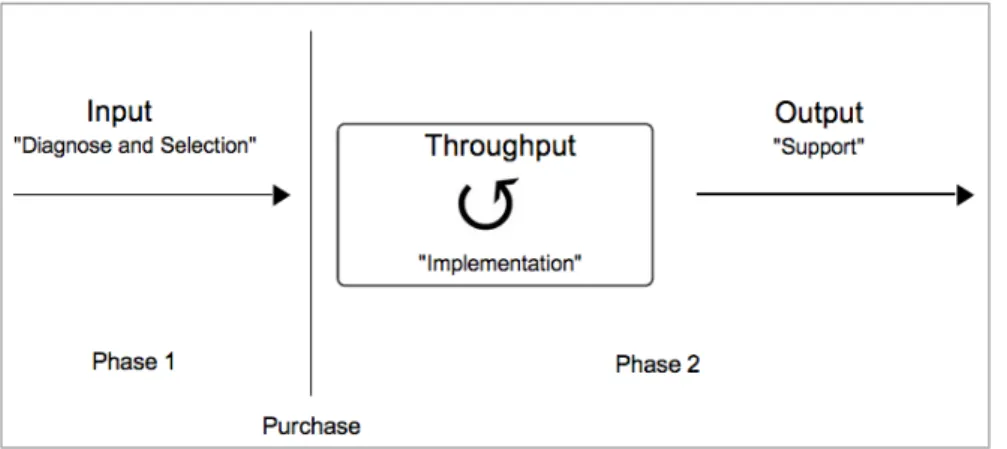
This section has been created to provide a deeper understanding of the differences between these two implementations models. A two phases framework is created to guide the explanation.
The depth reached in the research of IT and BI implementation software is astounding. To explain all the processes involved, different frameworks have already been created (Moss and Atre, 2003; Vodapalli, 2009). Even though the focus of my research is not on the traditional IT implementation, I reckon it is worth to provide a simple framework that will both serve as a guidance throughout the paragraph and explain the rationale behind the choices made in chapter 3.
As figure 5 represents, the adoption of an IT software can be divided into two phases: the first one, which I call diagnose and selection phase, takes place before the software is purchased, while phase two occurs after the acquisition and can be divided into implementation and support. In the diagnose and selection phase, a company evaluates its own business and functional requirements and how the new business intelligence solution could impact the corporate objectives (Moss and Atre, 2003). During this process, the prospect assesses the software’s features and verifies if they fulfil the requirements.
In the implementation phase, the project roadmap is defined and rolled-out. The main activities here are the assessment of the existing infrastructure, the definition of the plan and its milestones, the promotion of acceptance within the company.
The latest phase is referred to the after-sales support. The importance of this phase is also crucial. Training, maintenance, performance monitoring and general supporting arethe main activities performed in this step.
Having said that, the differences between the cloud and traditional BI are substantial in all three steps. I am particularly referring to the amount of resources required. Evaluating the needs of the company before purchasing any solution is of extreme importance. During a traditional BI implementation, the BI vendors’ representatives work together with the client’s team, in order to understand the company's needs. On the cloud BI side, this process is often carried out by the prospect, who self-evaluates its needs and browse different websites in search of the best solution.
Moving back to traditional BI software, after the prospect has agreed to purchase the solution, the implementation phase starts. Generally, this is the part where the bulk of the time and resources is spent, lasting years in some cases (Watson and Wixom, 2001). There is an iterative process where continuous adjustments are necessary to customize the solution to end users’ requirements. Moreover, overcoming resistance of some employees to accept a new solution is not an easy task and it could hinder the success of the project. For cloud software, the implementation phase does not require much time, since the majority of solutions are pre-packaged, with only few adjustments and customizations available.
After the implementation is completed, the vendors’ responsibility is to make sure the solution is effectively utilized by the employees - through the help of training programs, maintenance activities and performance monitoring. On the other hand, even though some cloud BI vendors offer similar services, the supporting activities are mostly related to troubleshooting and can be carried out via phone or web interactions, with the aim of keeping costs low.
3. Literature review and research design
This chapter reviews the existing evaluation criteria and Critical Success Factors proposed by various authors in the literature.
3.1 Key adoption factors: definition
Before presenting the research works of other authors, a definition of the key factors has been highly recommended. In this investigation, the key adoption factors refer to a combination of critical success factors and software evaluation parameters. According to Rockart (found in Vodapalli, 2009), Critical Success Factors (CSFs) represent a number of areas where the achievement of great results will ensure a competitive position for the individual, department or organization (Anthony, Dearden and Vancil, 1972 found in Olszak and Ziemba, 2012). It is worthwhile remembering that a mere list of key success factor does not automatically imply the success of the project (Adamala and Cidrin, 2011). As remarked by other scholars (Yeoh and Koronios, 2010), a list of key success factors identified for the development of Information Systems, such as BI, is only a small part of the tasks necessary to ensure the project’s completion. The key factors represent the areas that, if successfully managed, can increase the likelihood of a successful adoption.
Software evaluation criteria refers to making preference decisions over the available alternatives that are characterized by multiple attributes (Jadhav and Sonar, 2009).
3.2 Chapter’s structure
The structure of this chapter has been divided into two sections, using “Figure 5:
Adoption process” as a guidance: Evaluation Criteria and Critical Success Factors (CFSs):
My initial research revealed that the key factors concerning the adoption of a Business Intelligence software have been considerably covered in a number of academic articles (Adamala and Cidrin, 2011; Yeoh and Koronios, 2010; Vodapalli, 2009), both in term of SMEs (Olszak and Ziemba, 2012; Wong, 2005) and Software-as-a-service (Godse and Mulik, 2009). However, the key factors in adopting SaaS Business Intelligence solutions in SMEs are not widely treated. Little has been said regarding the connection between SMEs and cloud BI, therefore there is a lack of a proven framework that could have been used for analyzing the domain. I decided to develop my own one, following a similar approach adopted by other scholars (Scholz et al., 2010; Yeoh and Koronios, 2010).
3.3 Key adoption factors in Business Intelligence
As part of this study, I have extensively researched on the key factors mentioned by other authors in articles, journals, periodicals, reports and executive white papers. Other scholars (Scholz et al., 2010) faced a similar challenge during an investigation traditional BI systems. They developed a framework to link IT software adoption in SMEs, BI adoption and BI success factors. The following are the two areas I will take into consideration in building the framework that helps me answering the RQ:
• Critical success factors: CSFs for IT/BI software implementation: focus on small and medium sized enterprises
• Evaluation Criteria : IT packages and Software-as-a-Service evaluation criteria The factors belonging to these distinctive areas will be combined, resulting in a table that will be initially refined with the results from the qualitative interviews and then tested with a self-completion questionnaire.
CSFs for IT/BI software implementation: focus on small and medium sized enterprises
Critical Success Factors (CSFs) in BI have been treated by many authors (Eckerson, 2005; Wise, 2007; Yeoh and Koronios, 2010; Olszak and Ziemba, 2012) and they could be considered as “a set of tasks and procedures that should be addressed in
order to ensure BI systems accomplishment” (Olszak and Ziemba, 2012). In this
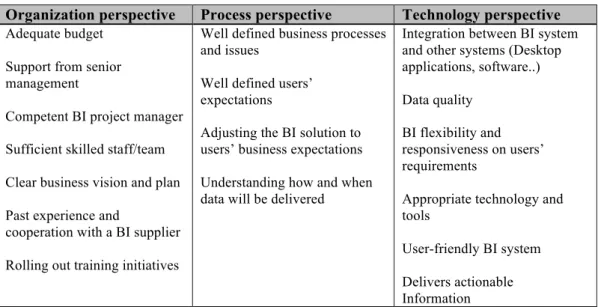
paragraph, those factors are reviewed and particular attention will be paid to the ones related to small and medium sized companies. Table 3 summarizes the literature on the argument:
Organization perspective Process perspective Technology perspective
Adequate budget Support from senior management
Competent BI project manager Sufficient skilled staff/team Clear business vision and plan Past experience and
cooperation with a BI supplier Rolling out training initiatives
Well defined business processes and issues
Well defined users’ expectations
Adjusting the BI solution to users’ business expectations Understanding how and when data will be delivered
Integration between BI system and other systems (Desktop applications, software..) Data quality
BI flexibility and responsiveness on users’ requirements
Appropriate technology and tools
User-friendly BI system Delivers actionable Information
Table 3: CSFs for IT/BI software (Olszak and Ziemba, 2012; Scholz et al., 2010; Nyblom et al., 2012; Eckerson, 2005; Wise, 2007; Yeoh et al., 2010; Watson et al., 2004)
The bulk of studies on Critical Success Factors have been heavily focused on large companies and it is believed that not all the factors can applicable to the small and medium sized enterprise environment (Wong, 2005; Bergeron, 2000; InsideInfo Whitepaper). These studies analyzed traditional and expensive IT/BI projects, commonly characterized by long implementation periods; whereas the typology of BI systems I am going to focus on this study requires a minimal implementation effort (Sheikh, 2011). Given this premise, the use of past research on critical success factors seems inappropriate for the purpose of this study. Indeed, as previously described in the chapter two, there are substantial differences between cloud and traditional BI implementation, in terms of resources, complexity, and architecture. In reality, those research offered me valuable foundations applicable throughout the whole research. Certainly, not all factors present in the table 3 will appear in the final framework and some of them have been adjusted to fit the context of this investigation. Elements such as clear business vision and plan, support from senior management, well defined
business processes and issues, sufficient skilled staff are typical of long IT projects,
which require multiple interactions between the client and the vendor, given the amount of resources required to roll-out the initiative. The overall process of adopting a cloud Business Intelligence solution is less complex and these factors do not play a major role. Another example is Rolling out training initiatives, which represents a customer support activity. Generally, SaaS BI software is easy to use and the training
support is mainly delivered through online libraries, tutorial videos, 24/7 call center, email services and alike.
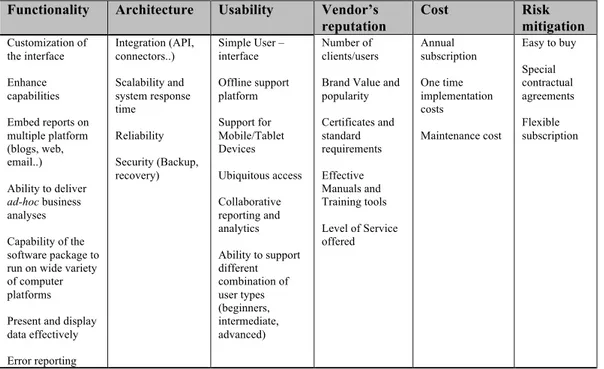
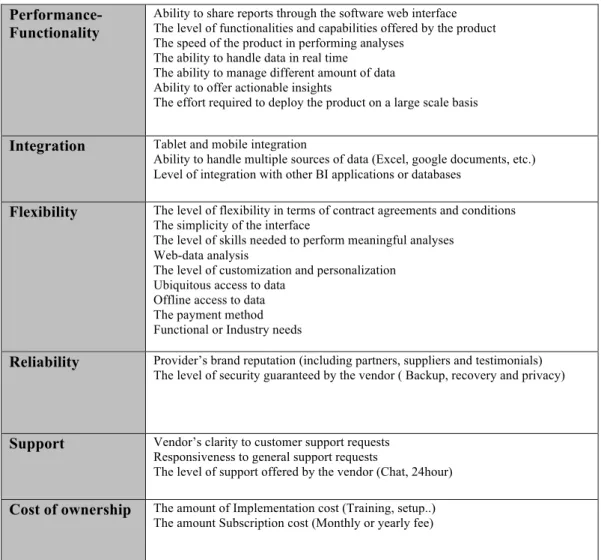
IT packages and software-as-a-service (SaaS) evaluation criteria
In this section I will discuss the different criteria that are evaluated before the purchase of a software. I will focus on the IT solutions evaluation criteria, with a specific consideration for SaaS cloud factors. Research on the key criteria for purchasing cloud SaaS software has been carried out by some authors (Godse and Mulik, 2009; Benlian et al., 2009; Sheikh, 2011; Sharma et al., 2010; Xin and Levina, 2008; Jadhav and Sonar, 2009). Given the focus of this paper on cloud SaaS software, is necessary to understand precisely which are the fundamental factors that drive the purchase of these solutions. Table 2 has been originally developed by Godse and Mulik (2009) and groups together, in s simple and comprehensive way, the most important evaluation factors characterizing cloud SaaS software. However, during my research I have found other factors not listed in the original version of the table, which I improved with the new discoveries, resulted in the following:
Table 2: Software-as-a-service evaluation factors (Godse and Mulik, 2009; Benlian et al., 2009; Sheikh, 2011; Sharma et al., 2010, Saugatuck Technology report, 2009, Jadhav and Sonar, 2009)
Functionality: “It represents the sum or any aspect of what a product, such as a software application or computing device, can do for a user” (SearchSoa, 2005). One
of the main concern that potential customers have, before buying any SaaS product, is to understand the real functionalities. In the previous paragraphs I highlighted some benefits of cloud products. However, by comparing cloud BI and traditional BI’s functionalities, the former comes off worst. The limited customization allowed by a SaaS products is far outdone by traditional solutions, which provide cutting-edge analyses created specifically for the needs of different set of clients.
Architecture: In this category we refer to the security, reliability, scalability and
integration of the IT architecture. Security is a crucial aspect that every SaaS vendors should address, clarifying doubts that companies have in letting third-parties manage
Functionality Architecture Usability Vendor’s
reputation Cost Risk mitigation
Customization of the interface Enhance capabilities Embed reports on multiple platform (blogs, web, email..) Ability to deliver ad-hoc business analyses Capability of the software package to run on wide variety of computer platforms Present and display data effectively Error reporting Integration (API, connectors..) Scalability and system response time Reliability Security (Backup, recovery) Simple User – interface Offline support platform Support for Mobile/Tablet Devices Ubiquitous access Collaborative reporting and analytics Ability to support different combination of user types (beginners, intermediate, advanced) Number of clients/users Brand Value and popularity Certificates and standard requirements Effective Manuals and Training tools Level of Service offered Annual subscription One time implementation costs Maintenance cost Easy to buy Special contractual agreements Flexible subscription
confidential and sensitive information (Godse and Mulik, 2009). Scalability refers to the ability of the product to maintain the same performance despite the increase in utilization. Reliability indicates the product’s ability to work and remain available to the users under specific environmental conditions for a given amount of time. Finally, a product is easily integrated if it can be combined with other applications.
Usability: this section refers to all the features that facilitate the interaction between
the user and the software. Examples are the user-interface and all the tools that support the customers in troubleshooting (Godse and Mulik, 2009). Even though the SaaS products are generally easier to use than traditional software, there are different level of “usability”.
Vendor reputation: This specific attribute is valid for all software purchases,
irrespective of the product's features and architecture. Therefore, my initial assumption is that it should be taken into consideration also for cloud solutions.
Cost: The total cost of ownership is composed of two elements. The consulting and
configuration services go under the name of implementation cost. The monthly or annual fee that is due to the supplier in exchange of the right to utilize the software is named subscription cost (Godse and Mulik, 2009).
Risk mitigation: In these section I grouped all the activities that facilitate the
transition to a new product.
The next step would be to combine the two tables (table 2 and 3) and improve the results with up-to-date information gathered from the qualitative interviews. I do not present the final result here, but it can be found in chapter 5 (table 4).
4. Research methodology
In this chapter, I will offer a detailed explanation about the research process as a whole, the strategy and approach adopted throughout the study and the sample selection. Overall, the aim of this chapter would be to describe the measures adopted to assure reliability and validity.
4.1 Research purpose
As explained in the Vodapalli’s article (2009), the objectives of an academic study can be categorized as:
• Exploratory: if the study is aimed at discovering “what is happening; to seek
new insights; to ask questions and to assess phenomena in a new light”
(Saunders et al., 2000 cited in Vodapalli, 2009).
• Descriptive: if the goal is to describe a process, event or a situation (Vodapalli, 2009). There is no need to clarify the problem, which is already defined.
• Explanatory: Studies that seek to find and explain relationships among variables.
My study is mainly exploratory as I wish to explore, through data collection, the key adoption factors in cloud Business Intelligence. Given the previous considerations, a mixed approach will be used regarding the research design.
4.2 Research design
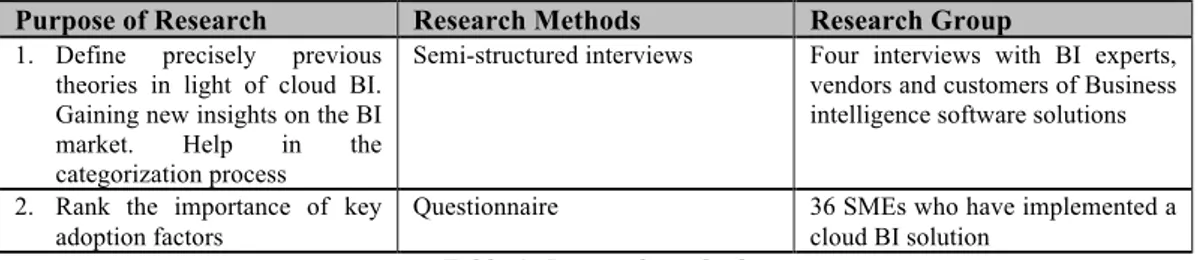
Table 1: Research methods
Stage one: qualitative – Define precisely the previous theories, gain up-to-date market insights and categorization of key factors.
Primarily, extensive literature review in two main domains has been conducted and the result has been summarized in a draft table (Not included here). The subsequent step involved the analysis of the table, aimed at identifying possible weaknesses or improvements agreed by BI experts, daily BI users and BI vendors. Indeed, some previous theories explain the factors in generic terms, while this investigation is aimed at representing the key adoption factors for SME in a detailed way. This process is done through four interviews and this research assumes that experts' judgments and experience could add important value in situations where theory is incomplete or obsolete (Yeoh and Koronios, 2010). The number of qualitative interviews has not been decided beforehand, but after four discussions I considered sufficient the amount of data gathered. Moreover, further understanding of the current market situation was not worth, given the time and resources' constraints. Finally, the factors coming from the literature review, improved with the interviews’ data, were consolidated into a single table (table 4 ).
Stage two: quantitative - Empirical assessment of the model
Due to the limited academic literature, the stage one was used to provide a solid grounds for the following analysis. Here, the preliminary table (table 4), resulting from the qualitative interviews was further assessed and validated with a quantitative method. Based on this table, all the content was carefully shaped into a survey (further details provided in section 4.2). This research instrument was used to capture respondents’ perceptions and empirically classify the importance of the factors. A pool of candidates, who fulfilled the following requirements, has been selected:
“SMEs’ employees who use a cloud Business Intelligence solution”.
It is important to highlight that all the participants did not have any relationship with the author.
4.3 Research approach
According to Bryman & Bell (2011), epistemology is a theory of knowledge and concern of what is considered as acceptable knowledge in a particular discipline. As remarked by the two authors, “methodologies justify methods, and methods produce knowledge, so methodologies have epistemic content”. Thus, the first point of every research should start with a decision of our epistemological position (Carter and Little, 2007) and I consider important dedicate some space of the methodology section to discuss this matter.
From the perspective of epistemological positions, quantitative studies are more related to the positivism and not to the interpretivism, which is the basis for qualitative research, as it leverages social science methods to understand human behaviours, sentiments and beliefs (Bryman & Bell, 2011). Given the previous consideration, both a positivist (mostly) and interpretivist (to a certain degree)
Purpose of Research Research Methods Research Group
1. Define precisely previous theories in light of cloud BI. Gaining new insights on the BI market. Help in the categorization process
Semi-structured interviews Four interviews with BI experts, vendors and customers of Business intelligence software solutions 2. Rank the importance of key
adoption factors
Questionnaire 36 SMEs who have implemented a cloud BI solution
approach helped me in choosing the right methodologies to capture all the nuances involved in Business Intelligence decisions.
As explained in table 1, this study is divided into two parts but there is only a single final objective: Understand the key factors for the successful adoption of a cloud BI solution in small and medium sized enterprises, according to the opinions provided by Business Intelligence consumers. To reach this aim, it was necessary to rank the key factors in a mathematical way and therefore the study can be classified as quantitative. However, to make sure the final results truly represent the reality of the cloud BI adoption process, I also leveraged four qualitative interviews, which laid the ground for the main analysis.
According to Hammersley (1996, found in Bryman & Bell, 2011), mixed-approaches can be divided into three categories: facilitation, triangulation and complementarity.
Facilitation is referred to the use of a particular research strategy as an aid to the other research strategy (Bryman & Bell, 2011). In this case, the empirical facts and
the prior theories complement, validate and reinterpret each other, resulting in a more reliable investigation. Even though Bryman and Bell (2011) claim the choice of a mixed approach is still considered controversial by some scholars, they also mention it has grown steadily from the past years and more and more studies rely on it. However, being aware of the critics raised to mixed approaches, careful considerations were made and following is an explanation of why I chose the
faciliation approach. During the literature review process, I strived to consider the
most up-to-date resources, given the fast-changing nature of cloud technology (cloud technology growth outpaces the overall IT industry, Gartner, 2013). For this reason, the qualitative interviews have been necessary in order to validate and, if needed, enhance the results found by other scholars with up-to-date primary data. The outcome of this process is a framework (table 4), which has been used as a basis for the questionnaire development.
4.4 Research strategy
The research strategy was not clearly defined from the very beginning, since discoveries throughout the process led to changes and improvements. Having being influenced by articles who treat similar subjects (Godse and Mulik, 2009; Adamala and Cidrin, 2011), my first hypothesis was to conduct exclusively a quantitative research and understand in a measurable way what are the factors that play an important role, for a small and medium sized enterprise, in the decision of purchasing a SaaS cloud BI product. At first sight the method made completely sense to me. In spite of that, after listening the advice of supervisors and being inspired by some principles found in Bryman and Bell’s book (2011), I made the decision to modify the approach and include the explorative interviews. This combined procedure resulted in a more effective understanding of the current BI market situation and improved the reliability of the study (Bryman and Bell, 2011). In order to offer solid contributions to a new field of research, I believe a mixed approach is the most effective one. This statement has been reinforced by Onwuegbuzie & Leech (2005) who affirm “mono-
method research is the biggest threat to the advancement of the social sciences”.
4.5 Literary sources
The theories used for the analysis of the empirical findings are structured around two themes which describe the key adoption factors for Business Intelligence software in an organization. Since SaaS Business Intelligence in SMEs is a rather new field of research, the sources of information I used are quite disparate. First and foremost, as
suggested by Bryman and Bell (2011), I leveraged online databases and scientific journals such as ABI inform, Google Scholar, Journal of Computing, Journal of Intelligence Studies in Business and Journal of Accounting, to name just a few. These sources offered the right overview of the Business intelligence market. Another step, whose importance has been remarked by previous scholars (Bryman and Bell, 2011), was the careful choice of keywords. The most used in my research were: cloud, cloud software, Business Intelligence, Business Intelligence SME, SaaS Business Intelligence SME, cloud Business Intelligence, success and choice factors BI (SMEs), implementation factors SaaS BI, selection criteria IT software, evaluation criteria BI in SMEs. Once an article was found, close attention has been paid to the references, and this snowball approach allowed me to find other valuable sources unknown at that point. Articles focused on the success factors proved to be particularly useful, such as Adamala and Cidrin (2011) and Olszak and Ziemba (2012), while Søilen’s studies offered a constant guide throughout the project. Regarding the structure and language of my study, Vodapalli (2009) and Yeoh & Koronios (2010) have been a great source of inspirations.
4.6 Empirical material
To deepen the understanding and assure a certain level of reliability, three different data sources were used:
Secondary data
Being the IT a fast changing market, paper older than five years could offer outdated information that lead to the wrong conclusions. I can not overstate enough the importance of leveraging up-to-date information in studies related to fast changing markets. Therefore, throughout the paper not only do I use books or publications, but I also extensively rely on recent research papers and analyses made by trustworthy professional firms (Gartner, Aberdeengroup and IDC) or directly by Business Intelligence suppliers, which proved to be useful for gaining information about market forecasts and trends. These sources also proved to be valuable for other scholars who studied Business intelligence (Søilen et al., 2012). The main underlying reason of leveraging multiple resources was to gain an overview of the companies involved in the market and a better understanding of the latest trends that characterize this business segment.
Qualitative interviews
The purpose of the interviews has been previously explained. According to Bryman and Bell (2011), interviews can be conducted in three different ways: unstructured, semi-structured and structured. The choice among them depends both on the research question and the type of study conducted. In this paper, a semi-structured approach was chosen given the explorative aim of the interviews, as suggested by other scholars (Barriball & While, 1994): gain additional insights on the latest trends in the BI market, leverage the interviewee’s first-hand experience in using BI software and specify previous theories in the context of cloud BI for SMEs. The semi-structured interviews were designed in accordance to the guidelines in Bryman and Bell’s book (2011).
All interviews started with the appreciation for the time allocated, followed by an introduction of the author and the project. Warm-up questions were prepared in advance, and then a discussion was built upon interviewees’ answers. If the interviewees’ answer started becoming too vague and not focused on the main
argument, I made sure to bring back the discussion to the right track, by asking open- ended questions related to the six categories listed in table 4. Examples are “Could
you tell me which functionalities are more requested by the customers” or “How could the total cost of ownership influence the ultimate decision to purchase a solution”.
Extensive research of the interviewees’ background and their companies has been performed beforehand, aimed at spotting common areas of discussion and create a pleasant atmosphere to facilitate the talking (Bryman and Bell, 2011).
All interviews were held through Skype and notes have been taken for future reference. Even though face-to-face interviews are preferred for in-depth studies aimed at grasping nuances in the interviewees’ behaviours, video-calls through Skype also represent an effective way, given money and distance constraints (Hay-Gibson, 2009). It is worthwhile remembering that investigators should weigh the pros and cons of every research method, according to their specific study (Wilson, 2012). The first BI expert is the co-founder of RJ Metrics (www.rjmetrics.com), a Philadelphia based company that sells cloud Business Intelligence/Analytics solutions, with a focus on e-commerce organizations. The other knowledgeable person in the area of Business Intelligence is the Marketing Manager of Insightsquared (www.insightsquared.com), whose main offering is centered on sales analytics, optimization and forecasting. Both companies deal repeatedly with small and medium sized business owners, and the information provided during the conversation were of great helpfulness. Given their significant experience and the job roles, these two people could be considered suitable for offering an up-to-date view of the key adoption factors in the BI market.
Regarding the BI users’ point of view, the first interview has been conducted with the marketing director of a mexican company with less than 150 employees, which provides solutions for Human Resource departments (anonymity has been preserved according to his wishes). The second was an interview with the head of the analytics department of Soliditet, a 100+ years old Stockholm based company with 250 employees, market leader in providing credit and business information for companies based in the nordic regions.
In all cases, the author was evaluating the importance of particular factors drawn from the literature and he further investigated the areas repeatedly mentiones by the interviewees.
Web-based questionnaire
Another source of primary data comes from the self-completion questionnaire. The purpose of the questionnaire was to rank the importance of the factors listed in table
4. As aforementioned, the limitations posed by the RQ highly restricted the available
representative sample. Being aware of this difficulty, I made sure to have a pool of respondents large enough to draw some insightful conclusions.
Following is a description of the various steps adopted to achieve the consensus of a company to participate in the study.
• A list of Business Intelligence vendors has been created, combining different web-sources (Start2Cloud.com, Entrepreneur.com, TCS.com, Gartner.com, Slideshare.net).
• Today several companies use an @info email address, which collects all the secondary requests (Søilen and Sabanovic, 2012). By using info@ address there is a concrete risk of no response at all (Saunders, Lewis and Thornhill, 2007 found in Søilen and Sabanovic, 2012). This explains the importance of finding the right person in a company, who can provide insightful information
useful to reach the research’s objective. The method I used for collecting “good” email addresses was to browse the vendors’ website and visit the section clients/customers, where is possible to find a list of customers, successful stories, case studies and often a reference person. I used that as a primary source of customers’ information. In addition, similar studies conducted within the field of cloud BI has been searched.
• Given the limited number of resources to find available customers and the skepticism around surveys (Bryman and Bell’s book, 2011), I preferred to not send all the questionnaire in one batch. As remarked by other scholars (Bryman and Bell, 2011; Saunders, 2007 found in Søilen and Sabanovic, 2012), a compelling and appealing introductory text is important to increase the response rates and therefore I tested the effectiveness over two rounds. In the first one, three different texts have been created and each of them sent to three email addresses. The email’s script with the highest response (33%) has been selected for further improvements. In the second round, three other text has been build around the selected script and the same approach was repeated, by only increasing to five the number of email addresses.
• The most effective script achieved two responses out of five (40%), and it served as a default script.
A testing approach is recommended prior to conduct any real questionnaire or interviews (Bryman and Bell’s, 2011). It helps revealing whether the words, structure or presentation are clear to the recipient. There is not a rule of thumb applicable to all types of questionnaires, but I have used some common practises aimed at improving the response rate (Oracle research, 2012). Regarding the measurements used in the survey, following is a description of the approach.
The surveys' rating scales are either unipolar or bipolar (Bryman and Bell, 2011). An unipolar scale induces a respondent to think about the presence or absence of a quality; a bipolar scale persuades the respondent to balance the response according to two poles. Despite the opinions of some scale enthusiasts, there is not an empirical evidence that demonstrates the superiority of a precise number of scale points in every situation (Oracle research, 2012; Krosnick, 1999). According to the findings of professor Krosnick (Krosnick, 1999), a 5-point scales are suitable when rating against one attribute, whereas 7-point scales are recommended when rating against polar opposites. Hence, for the purpose of my survey, the respondents’ perceptions were captured using an unipolar five-point scale, since I need to measure only the key factors, and therefore is implicitly assumed a positive connotation. The scale ranges from “Not important” to “Critical” as shown below:
• 1 - Not important
• 2 - Slightly important (Good-to-have) • 3 - Moderately important
• 4 - Very important • 5 – Critical
It is worthwhile noting that every number has been associated to verbal labels, since respondents are more accustomed with rating scales and verbal labels (Krosnick, 1999). This scale was then grouped into three levels – Not fundamental, important,
essential. Not fundamental comprised the “not important” and “slightly important”
scales; “moderately important” and “very important” were denoted important; and “critical” was marked as Essential.