Valuation of environmental impacts
and its use in
environmental systems analysis tools
Sofia Ahlroth
Division of Environmental Strategies Research – fms
Department of Urban Planning and Environment
Title: Valuation of environmental impacts and its use in environmental systems analysis tools Author: Sofia Ahlroth
PhD Dissertation 2009-10-25
Environmental strategies Research – fms Department of Urban Planning and Environment KTH Architecture and the Built Environment Royal institute of Technology
100 44 Stockholm TRITA-SOM- ISSN 1653-6126 ISRN
Abstract
Valuation of environmental impacts in monetary terms is a both difficult and controversial undertaking. However, the need to highlight the value of ecosystem services in policy decisions has become more and more evident in the face of climate change and diminishing biodiversity in the sea and other ecosystems. Valuing non-market goods and services, like ecosystem services, is a lively research field within environmental economics, and valuation methods have been considerably elaborated in the last ten years. Performing a valuation study is however often both costly and time-consuming. In practical policy analyses, there is often a need for readily available valuations of different impacts, either to use as a proxy for a market price or as weights to summarise impacts from different products or projects in a concise way. This thesis explores and develops several ways to include valuation of environmental impacts in different policy tools, such as cost-benefit analysis, environmental accounting and life-cycle analysis
In the 1990s, statistical bureaus in many OECD countries, as well as UNSTAT, Eurostat, World Bank and OECD, started to develop environmentally adjusted national accounts, the aim being to give a more comprehensive and correct picture of real growth. The first paper in this thesis is a part of the Swedish attempts to construct and calculate an environmentally adjusted NDP (net national product). This work involved putting a price on non-marketed environmental goods and assets. The valuation methods used in paper I include many of the available methods to value non-marketed goods and services.
Valuation of environmental impacts and/or environmental pressures is used in a number of environmental systems analysis tools besides environmental accounting. Examples are Cost-Benefit Analysis, Life Cycle Assessment, Life Cycle Cost analysis, Strategic Environmental Assessment and Environmental Management Systems. These tools have been developed in different contexts and for different purposes; the way valuation is used also differs. In paper II, the current use of values/weights in the tools is explored, as well as the usefulness of a common valuation/weighting scheme and necessary qualities of such a scheme. In the third paper, a set of generic weights meeting these criteria is developed.
Some of the generic values in the weighting set are taken from directly from other studies, while some are calculated by applying a benefit transfer method called structural benefit transfer on results from selected valuation studies. The method is tested on a number of valuation studies in the fourth paper.
Climate change will have a significant impact on Sweden during this century, both positive and negative. In the fifth paper, a rough estimate of the impacts on man-made capital and human health is presented. The study is an example of an impact assessment including only marketed assets valued with market prices, except for the loss of human lives, which is valued with an estimate based on willingness-to-pay studies. In the last paper, the economics of sustainable energy use is discussed; what is a sustainable energy price, and how might growth be affected if energy use is limited to a sustainable level? The discussion is based on two different models of thought: a back-casting study, describing how a sustainable future society might look
like, and economic scenarios projected with general equilibrium models. We find that both the sustainability scenarios and the economic scenarios include some tensions that might not be highlighted as long as they stay within their own reference space.
Key words: valuation, weighting, ecosystem services, climate change, impact assessment
Tack
Jag vill börja med att tacka Göran Finnveden och Bengt Kriström, som varit huvudhandledare för denna doktorsavhandling respektive min licentiatavhandling i naturresursekonomi. Ni har båda inspirerat mig till att genomföra dessa projekt, och gett stöd och uppmuntran under vägen. Göran har dessutom haft ett beundransvärt tålamod med de utflykter åt annat håll som jag gjort under min tid på KTH. Stort tack till er båda! Tack också till Björn Hårsman och Thomas Sterner för granskning av avhandlingen och för värdefulla kommentarer.
Under båda dessa perioder har jag dessutom haft förmånen att ha två underbara personer som biträdande handledare. Anni Huhtala coachade mig genom licentiat-tiden, gav råd och hjälp och konstruktiv kritik, och inte minst mycket stöd genom en tid då jag var sjuk i långa perioder. Det är också Annis förtjänst att avhandlingen (som är en monografi) blev till den artikel som är inkluderad i denna avhandling.
På fms har Mattias Höjer varit mitt ständiga stöd, även långt innan han formellt blev min biträdande handledare. Allt från uppiggande konsertbesök när hälsan återigen dunkade ner mig i soffan hemma, till roliga gemensamma projekt, uppmuntran och konstruktiv hjälp i avhandlingsskrivande och kursläsning. Mattias, du har varit en ovärderlig vän!
Under min doktorandtid har jag träffat många intressanta och inspirerande personer. Stort tack till mina närmaste kolleger på fms, inom MEMIV-projektet och i
PlusMinus-programmet för trevlig samvaro, intressanta diskussioner, simturer på GIH-badet, utflykter och glada middagar. Jag vill särskilt tacka min kära rumskamrat Sara, en person med underbar humor och stor värme. Det har varit många skratt och diskussioner om livet – för att inte tala om inredning av nya hus och planering av trädgårdar. Tack också till Maria, för hjälpsamhet med stort och smått och trevliga skype-diskussioner sent på kvällarna.
Jag vill också tacka Danne som beredvilligt ställt upp närhelst jag drabbats av matematiska grubblerier. Tack till mina vänner och min familj, som följt mig genom denna långa resa, i upp- och nerförsbackar. Ett särskilt tack till min älskade Petter, som är en ständig glädjespridare.
Slutligen, tack till Claes som håller sitt löfte och älskar mig i nöd och lust. Tack för allt stöd, i vardagslivet och i arbetslivet, för coachning och uppmuntran, och för att du fyller mitt liv med kärlek och äventyr.
Preface
During my years working as an environmental economist in different governmental bodies, I have frequently had reason to ponder over the question whether it is a good idea to use monetary valuation or not. This issue is often very controversial in interdisciplinary environments, but it is also much discussed between environmental economists. A common argument in favour of valuation is that it is a way to make the environmental impacts visible in impact assessments and hence in policy decisions. But to many people, the idea to put a price on the environment is preposterous. Putting a price on assets like environmental quality is definitively a tricky business, which involves reducing very complex phenomena to a one-dimensional unit, and to compare changes in environmental quality to goods traded on a market. A vital point, however, is that you can and should not value very large changes in vital goods. The rationale for using valuation is that you value marginal changes. Another important recognition is that monetary valuation measures changes in welfare, not ecological sustainability, and should be interpreted correspondingly.
This is not the place for thorough discussion of this interesting but difficult issue. There are many interesting papers on the subject, such as the eloquent paper by David Pearce, “Economic Valuation and Ecological Economics” (CSERGE Working Paper PA 97-01). All in all, I believe that within its limitations, valuation may be valuable tool. Sometimes quite simple comparisons of costs and benefits can provide very useful information about whether a project is worthwhile or not, and although the benefits need not always be expressed in monetary terms, this may provide valuable extra information. In many cases, we need to prioritise between different alternatives, and there are no simple answers how that should be done. Valuation may be one part of the solution. It can be used for both ordinal and cardinal ranking, depending on the situation. In this thesis, I have looked into different ways to apply valuation in various contexts.
I have for the most part of my life been working in governmental agencies, ministries and governmental commissions, which all have been quite close to policy making. The focus in this thesis is accordingly to develop methods that are useful in practical work, and to bridge the gap between theory and practice as well as between disciplines. I have been able to benefit from the knowledge of experts in many fields: my colleagues in the interdisciplinary research group at the department of Environment Strategies Research – fms at the Royal Institute of Technology (KTH) and in the research programmes MEMIV (Common Methods in Environmental Systems Analysis Tools) and PlusMinus (Economic Assessment for the
Environment). My supervisor Göran Finnveden and co-supervisor Mattias Höjer, have given valuable support throughout this process. I also wish to thank Björn Hårsman and Thomas Sterner for reviewing the thesis and giving valuable comments. This thesis has been funded by MISTRA, EMFO and the Swedish EPA, for which I am grateful. I also wish to thank the National Institute of Economic Research for funding time to finalise the first paper.
ABSTRACT 3
TACK 5
PREFACE 7
1. INTRODUCTION 11
AIM OF THE THESIS 11
2. SELECTED METHODS FOR VALUATION AND ECONOMIC ASSESSMENTS 12
2.1VALUATION OF ENVIRONMENTAL GOODS AND SERVICES 12
2.1OVERVIEW OF WEIGHTING METHODS 16
2.2VALUATION OF GLOBAL WARMING 22
2.3GENERAL EQUILIBRIUM MODELS 23
3. METHOD 25
3.1GREENING THE NATIONAL ACCOUNTS 25
3.2USE OF VALUATION IN SELECTED ENVIRONMENTAL SYSTEMS ANALYSIS TOOLS 26
3.3GENERIC VALUES FOR ECOSYSTEM SERVICES 26
3.4TESTING THE STRUCTURAL BENEFIT TRANSFER METHOD 28 3.5COSTS AND BENEFITS OF CLIMATE CHANGE IN SWEDEN 29 3.6SUSTAINABLE ENERGY PRICES AND GROWTH 30
4. RESULTS 32
4.1GREENING THE NATIONAL ACCOUNTS 32
4.2USE OF VALUATION IN SELECTED ENVIRONMENTAL SYSTEMS ANALYSIS TOOLS 33
4.3GENERIC VALUES FOR ECOSYSTEM SERVICES 35
4.4TESTING THE STRUCTURAL BENEFIT TRANSFER METHOD 38 4.5COSTS AND BENEFITS OF CLIMATE CHANGE IN SWEDEN 41 4.6SUSTAINABLE ENERGY PRICES AND GROWTH 43
5. DISCUSSION 45
APPENDICES
PAPER I CORRECTING NDP FOR SO2 AND NOX EMISSIONS:IMPLEMENTATION OF A THEORETICAL MODEL IN PRACTICE.REVIEW OF INCOME AND WEALTH,2003,49:425-440
PAPER II VALUATION AND WEIGHTING IN ENVIRONMENTAL SYSTEMS ANALYSIS TOOLS.SUBMITTED. PAPER III ECOVALUE08– A NEW VALUATION METHOD FOR ENVIRONMENTAL SYSTEMS ANALYSIS
TOOLS.SUBMITTED.
PAPER IV CONVERGENT VALIDITY TEST OF STRUCTURAL BENEFIT TRANSFER: THE CASE OF WATER QUALITY.SUBMITTED.
PAPER V COSTS AND BENEFITS OF CLIMATE CHANGE: A BOTTOM-UP ANALYSIS.SUBMITTED. PAPER VI SUSTAINABLE ENERGY PRICES AND GROWTH:COMPARING MACROECONOMIC AND
1. Introduction
Today there is a widespread awareness that most of our actions have consequences for the environment. Decision makers need to take environmental impacts into account when making decisions about projects and investments. Results from impact assessments can however be both extensive and diverse, which makes comparison of alternatives difficult. To help decision makers to interpret the results, many impact assessment tools include a possibility to aggregate results to an index or a few indicators, by translating them into a common unit. In economic tools like cost-benefit analysis, impacts on non-marketed goods are monetized to make them comparable to monetary costs and benefits. In other tools, e.g. life-cycle assessment (Udo de Haes et al. 2002) and strategic environmental assessment (Brown and Therivel, 2000), weighting in order to aggregate the results is often made by monetary valuation, but need not be. Monetary valuation can be done in several ways, each of which has their pros and cons. In this thesis, I use several monetary valuation methods to integrate ecosystem impacts into environmental systems analysis tools.
Aim of the thesis
The main aim of the thesis is to develop, apply and discuss the use of monetary valuation of environmental impacts in environmental systems analysis tools. Specific objectives are to:
• Link empirical estimations of a partially environment-adjusted NDP to a theoretical framework, and compute a NDP adjusted for impacts from eutrophication and acidification. (Paper I)
• Survey the use of valuation/weighting in environmental systems analysis tools and outline a common taxonomy for valuation/weighting methods (Paper II) • Develop a weighting method for use in different environmental systems
analysis tools (Paper III)
• Perform a validity test of a benefit transfer method suggested for constructing generic values for use in environmental systems analysis tools (Paper IV) • Compute tentative damage costs of two scenarios for the impacts of climate
change in Sweden (Paper V)
• Examine the macroeconomic impacts of sustainability scenarios developed with back-casting methods and discuss the role of energy prices in a society with sustainable energy use (Paper VI)
In the following, I will start with a short discussion on the use of monetary valuation and give an overview of valuation methods, which is central to the four first papers. A In sections 2.2 and 2.3, I give a brief background to the impact assessment of climate change provided in paper V and a short description of general equilibrium models, which are the topic of paper VI. Methods used in the papers are described in section three, followed by results in section four. In the last section, the results and implications of the choice of valuation methods are discussed.
2. Selected methods for valuation and economic assessments
2.1 Valuation of environmental goods and services
Environmental impacts from economic activities are a classic example of market failure, where the market fails to allocate scarce resources to generate the greatest social welfare. Causes for market failure include e.g. non-competitiveness, asymmetric information, externalities arising due to lack of property rights and public goods (Boadway and Bruce 1984). Environmental goods and services are often characterized by lack of property rights and are often public goods. Externalities exist when one person’s actions affect other people, who do not receive any compensation for damages or pay for benefit gained (Hanley et al 2007). Typical examples in the environmental area are emissions from industries or discharge of wastewater where the affected population is not compensated for the damages incurred.
Many environmental goods are also public goods. This means that the use of the good by one agent does not preclude its use by other agents. If it is technically impossible or too costly to deny open access to environmental resource, then market allocation is likely to be inefficient (Hanley et al 2007). Thus it is also a question of lacking property rights; “everybody’s property is nobody’s property” (Gordon 1954). This gives rise to the dilemma known as “tragedy of the commons” (Hardin 1968), which may cause depletion or degradation of natural resources.
There are several environmental systems analysis tools that address the issue of including environmental aspects into decision processes and impact assessments. Cost-benefit analysis is one such tool, which aims at assessing all costs and benefits of a project or policy in an explicit quantitative analysis. The underlying purpose is to get as much benefit for a certain amount of money as possible (Hanley and Spash 1993). It is based on welfare economic theory, which can be viewed as “an investigation of methods of obtaining a social ordering over alternative possible states of the world (…). The ranking of social states is inevitable a normative procedure; it involves making value judgements.” (Boadway and Bruce 1984). The approach is to
compare apples and pears by way of converting them to the same unit, i.e. money. For non-marketed goods and services like environmental services and other welfare aspects (e.g. comfort and time consumption), market prices need to be imputed to make them comparable to those that have a market price. The main methods employed by economists are usually divided into two approaches, revealed and stated preferences, where the value of environmental quality or environmental services is estimated by inferring values from related marketed goods or by constructing hypothetical markets (Hanley et al. 2007).
Though applied in cost-benefit analyses since the sixties (Hanley and Spash 1993) the valuation of assets like environmental quality in monetary terms is still a controversial undertaking. Discussions involve the validity of measuring the value of things like environmental assets by their economic value, and about what the economic values actually express (Kopp et al 1996, Pearce 1997). An underlying assumption when measuring willingness-to-pay is that people have a set of defined preferences over goods and services that can be ordered in a logical and consistent way (Boadway and Bruce 1984). Critics maintain that this is not the case for all possible instances, but that people construct preferences as choice occasions come along, making valuation of unfamiliar, complex phenomena very context-sensitive (O’Connor 2000).
In every-day life trade-offs are done continuously, both by individuals, companies and politicians. It can be argued that all choices between alternatives imply a valuation, implicitly or explicitly (Sugden and Williams, 1978). Sagoff (1988) maintains that environmental values are beyond the market, so that no amount of money could substitute for a loss of an environmental asset. The conclusion is that environmental valuation should not be contemplated. Bennett (2001) notes that although this line of argument may be compelling, we do not always act that way. Choices are made to sacrifice environmental values to achieve other goals and comments: “That is not to say that 'the environment' is not valuable. In aggregate, the environment is infinitely valuable to humanity. (…) What it does say, however, is that changes to the environment at the margin are not infinitely valuable and as such society is willing to give up some of it to achieve other goals.” (ibid.) Using quantitative tools and valuation methods is a way to make these trade-offs explicit.
Another objection to the use of monetary valuation is related to the Kaldor-Hicks criterion, which states that project increases social welfare if the gainers could compensate the losers and still be better off. This implies that all losses can be compensated for, and that gains and losses are comparable. Some analysts find indications in contingent valuations studies that this notion is not accepted by everyone. In that case, the criterion does not hold (Spash and Hanley 1995). Furthermore, the Kaldor-Hicks criterion does not require that compensation is actually given. However, it can be maintained that it constitutes a problem if compensation cannot be or is not paid (Turner 1979).
Another common criticism of the Kaldor-Hicks criterion is that it does not take into account the assumption of diminishing marginal utility for income: taking one dollar from a poor person causes a greater loss in utility than taking a dollar from a rich one (Johansson 1993). Instead it is based on the assumption that the value of a given individual income increase is independent of the income level. Thus the effects on income distribution from a policy measure is disregarded. Say that we consider a policy measure which is paid by everyone, but benefits only people in high-income groups. The total income change may be positive, i.e. have a positive cost-benefit ratio, but the policy measure might still be turned down in a referendum. In a cost-benefit analysis this problem may be treated by assigning different social welfare weights to different individuals, e.g. more to the poor (Ray 1984). These aspects, however important, are not discussed further in this thesis.
Another aspect which is not explicitly treated in this thesis is uncertainty. Virtually all decisions are made under uncertainty. The outcome of a project is assessed with a certain degree of likelihood. For simplicity, it is the expected outcome that is discussed in this thesis. In practical applications, the possibility for other outcomes should be taken into account. This is especially true for projects with long-term impacts.
There are several aspects of valuation that often cause misunderstanding. It is essential to be clear about which value the methods actually capture. It is important to note that the term value as used here should be understood in the meaning economic value (Kopp et al 1996). This means that the valuation provides an estimate of the price of a good, not its value in the ordinary sense of the word. A price is characterized by being the value attached to the marginal unit of a good, at current demand and supply. Some of the conflicts about valuation of the environment is due to a confusion of marginal and non-marginal values, as discussed by Bennett (2001), cited above. When we talk about “value”, we often implicitly refer to the total value of an asset or service. As an illustration, we can think about the value of drinking water. At the current supply and demand of water in Sweden the marginal value of an extra litre of water is insignificant, though the total value of drinking water is very high, possibly infinite (Paulrud 2004). If the marginal value at current supply and demand is used for assessing the value of water in a situation with water scarcity, this would clearly be an underestimation.
Monetary measures of economic value are inferred from the actions that people make in accordance with their preferences. This is based on the fundamental economic assumption that the satisfaction of individual preferences gives rise to individual well-being. The assumption is that individuals know what is good for them, and that they act in a manner consistent with these preferences in a desire to increase their well-being (Boadway and Bruce 1984). This assumption, called the “preference
satisfaction assumption”, has been called in question by philosophers like Sagoff (1998) and Scanlon (1991), who bring forward that satisfaction of preferences does not necessarily produce social well-being. Costanza (2001), among others, argues that basing valuation on current individual preferences and utility maximization alone does not necessarily lead to ecological sustainability or social fairness.
To some extent, the disagreement stems from different interpretation of the term “preferences”. Many economists maintain that the individual preferences measured include not only egoistic goals of personal well-being, but also aspects of the greater good for society and future generations (Kopp et al 1997). Non-use values of environmental amenities are one such example. But there is also a fundamental difference in views on how social well-being should be determined, and if the sum of individual preferences actually is a good proxy for social welfare.
Another issue concerns by which criterion the value is determined. As noted by Costanza (2001), welfare measures do not necessarily capture ecological sustainability (which is also related to the discussion above on marginal and non-marginal values). Common to valuation methods based on welfare economics is that they concern the value to humans, i.e. anthropocentric values, disregarding the intrinsic value of natural resources (Hanley and Spash, 1993). Ecological economists try to avoid this by taking another approach and take a certain environmental standard as point of departure, allocating other resources subject to this condition (Neumayer 2003). Still it is of course our preferences that guide the analysis, whether they are primarily based on current knowledge about the nature or some other value base (Hanley et al.2007).
The concepts of weak and strong sustainability reflect the two approaches, i.e. to take the ecological or the economic sphere as starting point. There are several interpretations of these concepts (Mäler 2007). Here, I will use the definition of Pearce and Atkinson (1993). According to their definition, weak sustainability requires that the real value of the total capital stock (i.e. man-made capital, human capital and natural capital) be non-declining. Thus different forms of capital are assumed to be substitutes for each other. It is also presumed that they can be aggregated in the same unit. The "strong sustainability" approach is not only concerned about keeping the aggregate stocks of capital constant, but it also requires that the stocks of natural capital (ecological assets) should not decrease over time (Pearce and Atkinson 1994). This means that reductions in natural capital cannot be substituted for by increases in man-made or human capital (Hanley et al 2007). The latter concept implies that natural resources constitute an absolute boundary, while in weak sustainability resources such as knowledge and technical advances can substitute for depletion or degradation of natural resources.
Examples of weak sustainability indicators are green net national product and Genuine Savings (Hanley et al. 2007). Both indexes extend a conventional national account index by way of including depreciation of natural capital (see e.g. UN 2003, Ahlroth 2001, Hamilton 1996, Pearce and Atkinson 1993). Strong sustainability indicators include distance-to-goal approaches and ecological footprints (Hanley et al. 2007). One example of a distance-to goal indicator is the “greened economy GDP” (UN 2003, Brouwer et al. 1999, Hueting et al. 1992), where GDP is adjusted for the cost of reaching environmental goals. Ecological footprints (Rees and Wackernagel 1994) is a concept that measures the land requirement for meeting demands of e.g. a country, arising from energy use, consumption, transport and waste.
How to measure social welfare and attach values to different goods and services without using individual preferences or information from markets is not easily resolved. Who would decide which weights to allocate to different environmental and services? The dilemma is an old one; Plato presented a famous solution with his advocacy for the “philosophers’ state” (Liedman 1981). An alternative approach is to use political decisions as an expression of society’s preferences, thus leaning on manifestations of representative democracy (Finnveden et al. 2002). There are several suggestions for a valuation procedure for policy that include other social and political dimensions, such as multicriteria analysis and procedures using citizen’s involvement (see e.g. Spash et al 2009, O’Connor 2000, Pearce and Turner 1990).
In the following, a short description of different valuation methods is given, with a focus on monetary valuations methods, as these are the ones used in this thesis.
2.1 Overview of weighting methods
There are several methods for valuing environmental goods, each with their advantages and disadvantages. The scope of the methods varies significantly: some cover pure economic losses, some impute values by using different types of costs and some attempt to measure welfare losses. The latter may include both use and non-use values. The latter refers to the value that people derive from goods independent of any use, present or future, that they might make of those goods, in contrast to use values, which people derive from direct use of the good (Mitchell and Carson 1989). Non-use values may include quasi-option values (the value of preserving options for future use given some expectation of expanding knowledge.), existence values (the value of knowing that an amenity exists) and values to future generations.
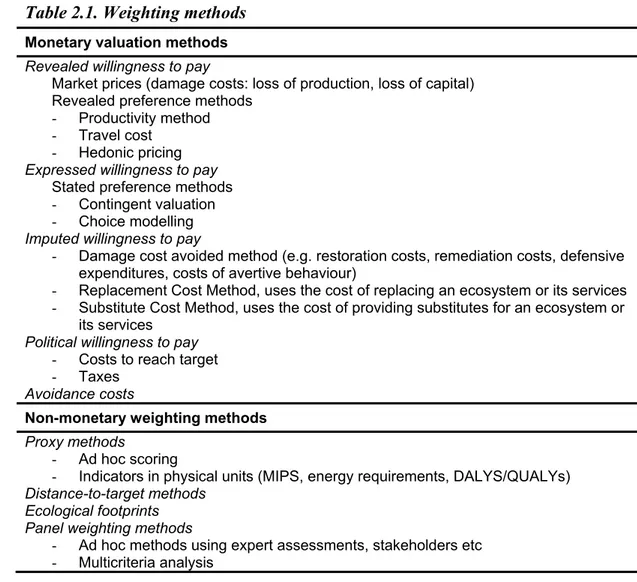
There are several classifications used for sorting up the methods. The classification used in Table 2.1 is developed in paper II.
Table 2.1. Weighting methods
Monetary valuation methods Revealed willingness to pay
Market prices (damage costs: loss of production, loss of capital) Revealed preference methods
- Productivity method - Travel cost
- Hedonic pricing
Expressed willingness to pay
Stated preference methods - Contingent valuation - Choice modelling
Imputed willingness to pay
- Damage cost avoided method (e.g. restoration costs, remediation costs, defensive expenditures, costs of avertive behaviour)
- Replacement Cost Method, uses the cost of replacing an ecosystem or its services - Substitute Cost Method, uses the cost of providing substitutes for an ecosystem or
its services
Political willingness to pay
- Costs to reach target - Taxes
Avoidance costs
Non-monetary weighting methods Proxy methods
- Ad hoc scoring
- Indicators in physical units (MIPS, energy requirements, DALYS/QUALYs)
Distance-to-target methods Ecological footprints Panel weighting methods
- Ad hoc methods using expert assessments, stakeholders etc - Multicriteria analysis
Monetary methods
Revealed willingness to pay
Market prices provide a marginal valuation of goods and services at the current level of supply and demand. In revealed preference methods, the analyst seeks to value non-marketed goods by using information on people’s expenditures on related marketed goods (Hanley et al. 2007). Market-related damage costs may include both value of lost property and the value of production losses.
The production function approach is applicable in cases where the environmental goods/services are some (or one) of the inputs to produce a marketed good (Champ et al. 2003). An appropriately specified production function may indicate the contribution of these inputs to the output and from this information one may deduce the benefit due to these inputs.
In travel cost studies, the environmental good valued is outdoor recreational resources, such as a national park or a beach (ibid.). Expenditure on travel costs is seen as complementary to consumption of the recreation good. The willingness to pay (WTP) for environmental quality can be inferred by differences in expenditures for similar sites. In the hedonic pricing method, the value of a commodity is explained as a bundle of characteristics, of which one or more may be environmental (ibid.). The most common application is to value a commodity by studying how it affects the value of real estates. For example, noise can be valued by estimating differences in house prices as a function of the noise level. For both the travel cost and the hedonic pricing method, applications are limited. There are also several other problems with linking the market data to the environmental amenities, such as identifying all factors that influence consumers’ choices.
Stated willingness to pay
In stated preference methods, estimates of individuals’ values for environmental quality are elicited by making surveys where they are asked to state their preferences. This method is the most comprehensive since it captures both use and non-use values. In the most frequently used method, contingent valuation, the respondents are asked to state their willingness to pay (WTP) for an increase in environmental quality, contingent on a carefully structured hypothetical market (Hanley and Spash 1993).
There are several potential biases, i.e. that the values differ systematically from “true” values, involved in stated preference methods (Bateman and Willis 1999, Carson et al. 2001). They include
• Hypothetical market bias: the fact that choices are made in a hypothetical market situation made cause people to neglect their budget constraint, which may lead to overestimates. There are several studies that find that hypothetical intentions are good predictors of actual behaviour, while some others have found that the difference is random, i.e. not constituting a bias. Hanley and Spash (1993) conclude that it seems to depend on how the questions are asked in the CV study.
• Scope bias or embedding: insensitivity to the quantity or scope of the good being provided
• Strategic bias or free riding bias: if respondents believe that bids will be actually be collected, they may understate their WTP. On the other hand, if the respondent wants the good to be provided, there may be an incentive to over-state his WTP, thereby ensuring the provision of the good.
• Design bias: The way information is presented to the respondents may influence their responses.
• Mental account bias or part-whole bias: when individuals’ WTP responses fail to distinguish between the specific good which they are asked to value [the ‘part’] and the wider group of goods [the ‘whole] into which that specific good falls (Kahnemann and Knetsch 1992).
In choice modelling, preferences are elicited in a slightly different way, where respondents are asked to rank different alternatives. Choice modelling includes a range of methods, e.g. contingent ranking, paired comparisons and choice experiments. In choice experiments, respondents are asked to choose between alternative goods, defined in terms of their attributes, one attribute being a monetary cost (Louviere and Henscher 2000). This allows the analyst to derive a monetary value of each of the attributes.
Revealed and stated preference methods are usually quite costly and time consuming to apply. In practical applications, there is often neither the time nor the money to perform new valuation studies. Instead, readily available values from existing valuation studies are used. The practice of using values derived for e.g. a certain site as proxies for another site is called benefit transfer. In benefit transfer, estimates from one or more original studies is transferred a new context or site, usually after adjusting them in some way. The adjustments may involve taking account of differing socio-economic characteristics of the population concerned, or different characteristics of the valued site or good (Hanley et al. 2007). The transfer can be done by adjusting mean WTP from the original study or by using a benefit transfer function, where WTP for the policy site (the new context) is calculated by inserting data from the policy site into the WTP function estimated for the study site (the original context).
Another approach is doing a meta analysis of existing valuation studies concerning a certain good, i.e. a statistical analysis where estimates of WTP is the dependent variable and characteristics of the good and the survey populations as well as details of the methodology followed are independent variables (Shresta and Loomis 2003).
Imputed willingness to pay
The cost methods are based on the assumption that, if people incur costs to avoid damages caused by lost ecosystem services, or to replace the services of ecosystems, then those services must be worth at least what people paid to replace them.
The use of avoidance costs, e.g. the cost of reducing emissions, is problematic since the costs are not linked to the extent of the damages, and are thus not related to the perceived severity of the problem1. There is no a priori reason why costs would be commensurate with the benefits they provide. Possibly, they are the lowest limit to the benefits when purely economic considerations are made. They are best used when
avoidance measures are actually decided upon, i.e. there is an explicit will to pay the costs (Kopp et al 1996, Mishra 2006). The replacement cost method and the substitute cost method can be used to value damages, as well as to value an environmental asset or service. Some of these cost measures, like household defensive expenditures and avertive behaviour, can also be included in a production function (e.g. triple-glazed windows to produce silence).
Political willingness to pay
The costs for reaching established targets can be interpreted as a willingness to pay of society, as represented by the elected politicians (Finnveden et al. 2002). Setting a target for e.g. pollution or the protection of an ecosystem involves an implicit valuation, since the decision shows the decision maker’s willingness to pay what it will cost to reach the target. The correct measure is then the cost that is known to the decision maker when the target is set.
Similarly, taxes are a way to internalise the externalities caused by consumption and production. The taxes imposed on e.g. air emissions may be interpreted as a political valuation of the externalities caused (Finnveden et al. 2002). It can be argued that since taxes are typically set with regard to many aspects other than the environmental impacts, e.g. income allocation issues and competitiveness of domestic industry, this is not a valuation of the damages from pollution. However, that the valuation is done with other societal considerations taken into account does not necessarily invalidate the interpretation, since prices are always set in relation to the utility of other goods.
Avoidance costs
Valuation with avoidance costs means estimating what it would have cost to limit e.g. emissions to e.g. a sustainable level alternatively to limit the effects of the emissions to a certain limit (NIER 1998). The difference between this and costs-to-reach-target estimates is that the limits chosen are not decided upon by any actor but by the analyst, so that it does not represent anybody’s willingness-to-pay, but shows a hypothetical situation. This may be used in e.g. greened economy GDP calculations (UN 2003).
Non-monetary methods
Proxy methods
Proxy methods are the simplest way to weigh different kind of environmental impacts against each other. They use one or a few quantitative measures stated to be indicative for the total environmental impacts (Lindeijer 1996). Proxy approaches are limited in scope since they do not attempt to cover all types of environmental impacts, but pick a
few ones that are judged to be important (Finnveden et al.2002). No intereffect weighting is thus attempted. Examples of proxy approaches include energy requirements, Total Material Requirement (TMR) and DALYs/QALYs (disability/quality adjusted life years). The ecological footprints method was developed by Rees and Wackernagel (1994). It measures how much land and water area a human population requires to produce the resource it consumes and to absorb its wastes, using prevailing technology (Global Footprint Network, 2009). Problems with this approach include the implicit assumptions that all unbuilt land is equally valuable and that substitution in resource use is a negative thing, Furthermore, ecological footprints measure is not robust to changes or variation in underlying efficiency parameters, e.g. yield factors (Hanley et al. 2007).
Distance-to-target methods
These methods evaluate different environmental impact categories depending on the distance between e.g. current level of environmental pollution and a future environmental target value (Weiss et al. 2007). When targets are set, there is no requirement that they should be of equal importance. Thus some weighting between impacts needs to done. However, in many applications the targets are just assumed to have equal weights, implying that intereffect weighting is lacking (Finnveden et al. 2002).
Panel weighting methods
Using panels for eliciting preferences and judgments can be done in many different ways. Panels can consist of experts, stakeholders or lay people, and the elicitation process can be organised in many ways (Seppälä 1999).Ad hoc-methods are used in many instances, some of which have develop sets of generic weighting factors, e.g. Ecoindicator99 (Goedkoop and Spriensma 1999). Multicriteria analysis is a set of methods that are designed to handle problems characterised by multiple objectives (Belton and Stewart 2002). The methodologies typically aim at quantifying tradeoffs among attributes. How this is done and the requirements for elicitation of weighting factors vary between methods (Pearce and Turner 1990). Similar to stated preference methods, these methods are relatively resource-intensive to use, and generic values derived with these methods are therefore most commonly used in practical applications.
Linking causes to effects
The valuation in a cost-benefit analysis typically concerns a change in the quantity or quality of an environmental asset, e.g. damages due to air pollution. The “damage costs”, i.e. the value of the environmental quality lost, can be valued directly, without linking the damages to the damaging agent, e.g. pollution. To derive a price for the
pollutants from the damage value, it is however necessary to establish this link. This can be done by dose-response or exposure-response functions. While the use of exposure-response functions for health effects is rather common (see e.g. European Commission 2005, Rabl 1998), information on links between dose and response for effects on ecosystems is still very sparse (Samakovlis 2008). A rough allocation of damage values to the causing agent, e.g. a pollutant, can be done by dividing the total damage value by the deposited amount of the pollutant. This however will yield an average value instead of a marginal value.
2.2 Valuation of global warming
There is a large body of literature on the topic of valuation of global warming (Tol 2008). Many of the studies use global models to assess the damages from global warming in economic terms (ibid). The models used are integrated assessment models (IAM), which include knowledge from research in multiple disciplines (Weyant et al. 1996). The models generalise knowledge about the damages on man-made capital and human health from different impacts like flooding, storms and high temperature to mathematical relationships between temperature increase and damages (Nordhaus 2007). Most analyses include primarily damages to marketed assets, excluding other welfare effects and damages to non-marketed assets (Tol 2008). There are also numerous partial analyses studying the effects of global warming on certain sectors, like agriculture and tourism (Cline 2007, Wietze and Tol 2001). Ecosystem impacts, when included, are mainly described in qualitative terms (e.g. Stern 2006).
The damage assessments include a number of assumptions and simplifications, not all of which are generally accepted. Controversial issues include the choice of discount rate, the shape of damage function and the valuation of human lives (equity between developing/developed countries) (IPCC 2001, ch.19; Nordhaus 2007).
On the national level, there are several studies regarding vulnerability to climate change. Examples include analyses for the Netherlands (Netherlands Environmental Assessment Agency, 2005), Germany (Zebisch et al, 2005) and Denmark (Danmarks miljøundersøgelser, 2002). However, these are mainly qualitative analyses, in some cases with quantitative calculations for a few sectors, such as agriculture and forestry. The Finnish research programme FINADAPT include quantitative analysis of the impact on rural businesses, tourism and the energy sector, as well as flooding of buildings (Perrels et al, 2005). The calculations show a slight positive net effect, primarily due to improved higher growth in forestry and increased tourism.
In Sweden, the governmental Commission on Climate Change and Vulnerability made a comprehensive bottom-up assessment of damages to different sectors and geographical areas (SOU 2007:60). The purpose of the analysis was different from the purpose of the global analyses referred to above. While the global analyses aim at
giving a rough estimate of foreseeable damages from global warming, the analysis of the Commission was a practical vulnerability assessment, aiming at identifying areas where preventive measures should be taken and how to adapt social planning to future conditions (ibid.).
The assessment was based on climate scenarios from the Swedish Meteorological and Hydrological Institute (SMHI), which were regionalisations of IPCC:s climate scenarios (ibid.). SMHI produced a large number of maps showing differences in various climate indicators, which were used to assess impacts on different sectors. The working groups included experts on communications, technical support systems, physical planning, building, forestry, agriculture, fishery, tourism, human health, animal health, drinking water supply and terrestrial, freshwater and marine ecosystems. The information gathered provide a comprehensive body of knowledge that can be used as a starting point for national and regional adaptation policies as well as input to quantitative analyses. The assignment included assessment of overall costs due to impacts from climate change, which required a higher degree of quantification of the damage assessment than in the country assessments mentioned above. The direct impacts on production sectors other than the agricultural and forestry sectors proved difficult to assess. Thus there was no basis for using economic modelling, since the identified direct damage costs were not judged to be of a magnitude that would affect relative prices in the economy, but an overall assessment of the costs and benefits of possible scenarios was attempted.
2.3 General equilibrium models
Computable General Equilibrium (CGE ) models are based on microeconomic theory and the notion of equilibrium between supply and demand, obtained through the price mechanism (Ginsburgh & Keyzer 2002). They typically simulate a market economy characterised by perfect competition, perfect information, no public goods, no externalities and constant return to scale. Imperfections can however be introduced, such as imperfect competition in the labour market and in certain production sectors (Capros et.al. 1997, Balistreri 2002).
CGE models are typically built around an input-output core where intermediate demand of the production sectors is modelled (Shoven and Whalley 1992). The representation of the production side is usually rather disaggregated, to capture different features of different type of production. Final demand is represented by household consumption, public consumption, investment, exports and imports.
The production and consumption functions are specified according to a mathematical form that exhibits suitable economic properties (Dervis et al. 1982). The model is calibrated to a chosen base year (i.e. parameters are scaled so that the model
reproduces the data from the base year). The behaviour of the economic agents is depicted through price elasticities, which show how responsive firms and households are to changes in prices. The price elasticities are linked to substitution elasticities, which determine how easily firms can change their mix of input goods (ibid.). In an environmental-economic model, energy use and emissions from production sectors and final demand is typically included (Söderholm 2007).
CGE models do not generate forecasts, but rather what-if scenarios (Börjeson et al. 2006) and are used for long-term policy analysis of e.g. taxes and regulations. This is in contrast to econometric models, which are based on statistically established relations between economic variables, estimated on historical data (Green 2003). Income and expenditures must balance, but there is no requirement for markets to be in equilibrium. They are used for macroeconomic analyses and forecasts (ibid.).
There are several so-called 3E-models (linking environment, energy, economy) on the European level, both pure CGE-models, econometric models with an input-output module and integrated assessment models (IAMs), which include both economic and physical modules (Ahlroth et al. 2003). In Sweden, the models used in the environmental-economic area are primarily of the CGE type (Söderholm 2007). Examples of governmental reports that include environmental-economic policy analysis with CGE models are the Long Term Survey (SOU 2000:7), the Climate Committee (SOU 2000:23), the Resource Efficiency Committee (SOU 2001:2) and Carlén (2007).
The assumption in CGE models that markets clear after an initial perturbation, i.e. that prices adjust so that supply and demand balances, implies that the time horizon is medium or long term, which means a period of at least 10-15 year (Shoven and Whalley 1992). To generate a base scenario, exogenous variables and parameters in the model are adjusted to mimic a probable economic development during the relevant time period. Subsequently, the policy to be analysed is imposed on the economy, such as e.g. a different tax policy. Results include the impact from the policy on e.g. macroaggregates (GDP, consumption etc), income allocation, economic structure, energy use and emissions per sector (Östblom and Berg 2006, Söderholm 2007).
3. Method
As should be clear from the previous section, integrating environmental impacts into environmental systems analysis tools requires several choices to be made. First, the analyst must decide whether to use valuation or not. This includes determining the desired level of aggregation. Secondly, a valuation method must be chosen. This choice must be made with regard to the tool used. In this thesis, valuation of ecosystem impacts is done in two different contexts. The first is the national accounts: the aim is to integrate the ecosystem effects from eutrophication and acidification into the national accounts, to compute a partially adjusted Net Domestic Product (NDP). The second is to determine generic values for a range of ecosystem impacts, which can be used in several environmental systems analysis tools.
3.1 Greening the national accounts
Integrating environmental effects into the national accounts poses special problems, since the environmental entries need to be compatible with the conventional accounts. This means e.g. that the sectoral division of the national accounts must be followed, and that the values used should be similar to market prices. Some impacts are already included in the national accounts, implicitly or explicitly. It may be of interest to account for some of the implicit effects separately, but they should not be deducted since they have already reduced conventional NDP. The time dimension is also important. Some items are included in the conventional flow accounts, but not in the stock accounts, or vice versa. Current effects like production losses due to the flow of pollutants are implicitly included in the national accounts, but future impacts on production and consumption due to the increase in the stock of pollution is not taken into account.
To sort out these different aspects, it is helpful to use a model. In a seminal paper, Weitzman (1976), first formalised the idea of the national income concept interpreted as the Hicksian definition of income. Hartwick (1990), Mäler (1991) and Dasgupta (1993) focus on the welfare interpretation of the national income concept, and extend this welfare measure to include welfare emanating from the environment.
To formalise the empirical work carried out to include impacts from eutrophying and acidifying pollutants in the national accounts, an optimal control model (Seierstad and Sydsaeter 1987) is developed in paper I. The model includes four capital stocks: man-made capital, natural resources, labour and pollution. The utility function includes consumption, emissions and the stock of pollutants. Thus there is disutility from both the flow effects of emissions (e.g. air quality) and stocks (e.g. content of acidifying pollutants in the soil). The stock of man made capital changes due to investment (production less consumption), “ordinary” depreciation, depreciation due to pollution and cost of abatement measures. The natural resource stock, which includes forest and
fish, changes subject to growth and harvest. The labour stock changes subject to emissions flows, and the pollution stock changes according to emissions less abatement, natural dissipation and export, plus imports (via air). The resulting expression for and environmentally adjusted NDP (EDP) showed which value that should be included for each impact.
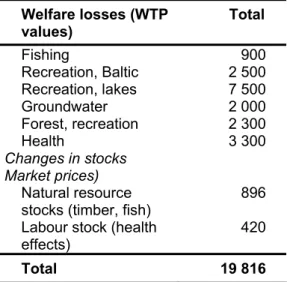
Subsequently, empirical data is inserted into the model, to calculate EDP. The valuation include production losses valued with market prices, welfare losses valued with contingent valuation and wealth effects valued by cost of actions taken to avoid damages. Environmental protection expenditures linked to pollution is estimated, though they are not part of the adjustment, since they are already a part of NDP . In addition, abatement costs for reducing the emissions to the level specified in environmental targets are also estimated, to show the cost of reducing Swedish emissions contributing to the calculated damages.
3.2 Use of valuation in environmental systems analysis tools
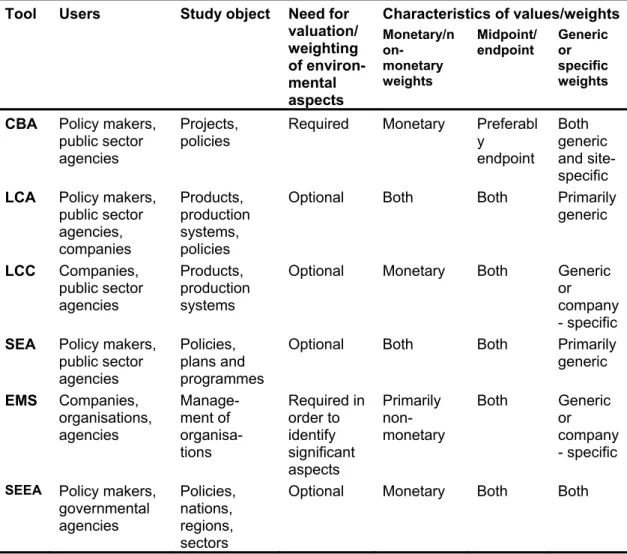
Valuation is also used in many other systems analysis tools, such as Cost-Benefit analysis (CBA), Life-cycle Assessment (LCA), Strategic Environmental Assessment (SEA), Life-cycle Costing (LCC) and Environmental Management Systems (EMS). The values used can be in monetary terms and used as monetary values, or just used as weights, to aggregate different kind of impacts. In paper II, current use of valuation in different environmental systems analysis tools is surveyed and requirements for values/weights in the tools are explored. We examine common traits and analyse whether there are benefits of using common valuation/weighting schemes in different tools, and if so, how such a scheme should look like. Furthermore, a taxonomy for valuation methods that encompasses all valuation methods used in different tools is suggested.
3.3 Generic values for ecosystem services
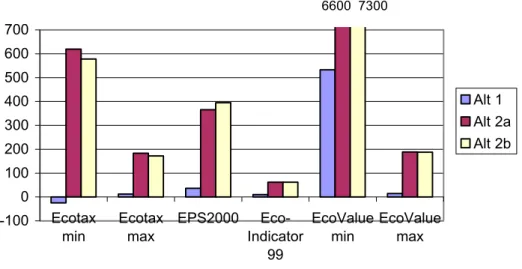
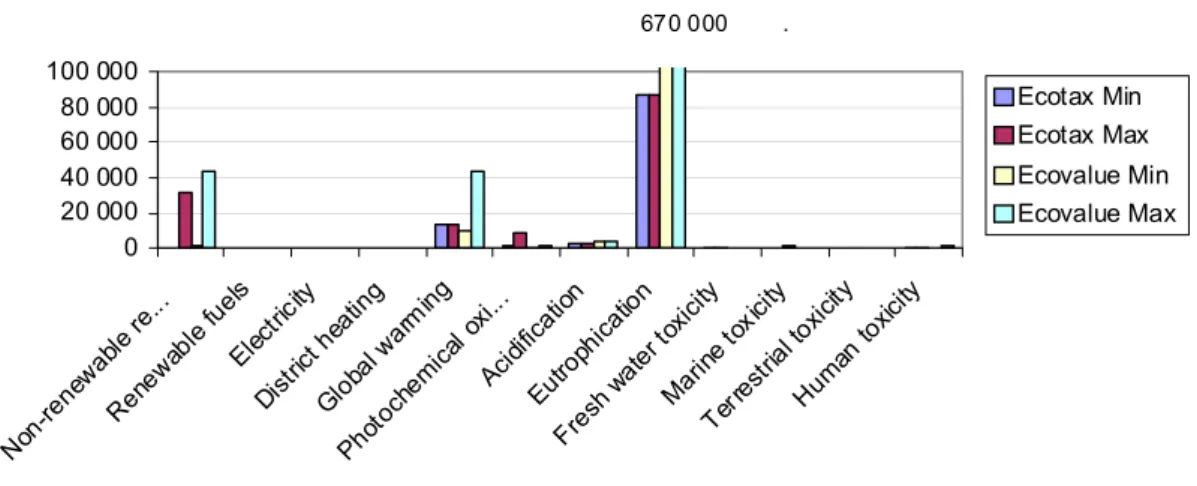
In paper III, a generic set of values/weights for use in different environmental systems analysis tools is developed and tested. The weighting set is designed according to the findings in paper II, which implies that the set should use a monetary valuation method and be consistent in the use of method. The primary choice is revealed and stated preference methods, which measure welfare loss from environmental impacts. Values are attached to different impact categories like global warming, eutrophication, acidification and human health. For two impact categories, other valuation methods were used. Estimations of welfare effects from global warming was not available, so damage costs including only material damages and health effects was used. For depletion of non-renewable resources, unit rent (i.e. rent less extraction costs) is used as a proxy for scarcity rent.
The weighting set is tested for three case studies, to see which environmental impacts are identified as the most important and compare to results using other weighting sets. The case studies are an LCA of a waste management proposal (Nilsson et al 2005), the environmental impact from Swedish agriculture assessed with a hybrid IOA-LCA method (Engström et al 2007) and an LCA of the environmental impacts of a grenade (Hochschorner et al 2006). The weighting sets included in the comparison are Ecotax02 (Finnveden et al. 2006), Ecoindicator99 (Goedkoop and Spriensma 1999) and EPS2000 (Steen 1999).
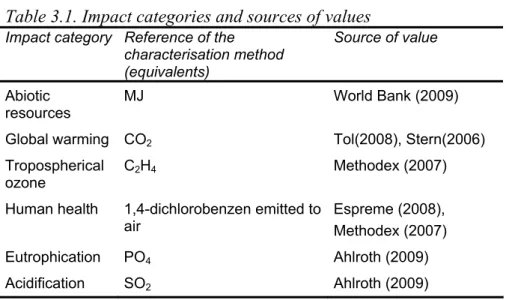
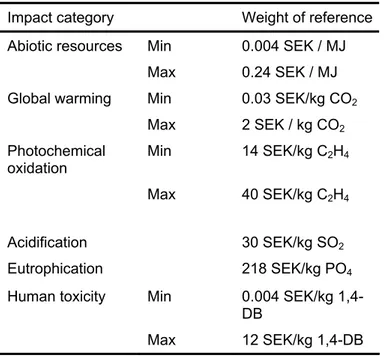
For the weighting set, existing generic values are used when available. The impact categories and the sources used are shown in Table 3.1. For some of the impacts, where existing damage estimates differ substantially, the choice of indicator value is not evident. For these impacts, we adopted a min/max approach, to make it possible to evaluate results with different assumptions about the damage values.
The substances contributing to these impact categories, except acidification, are converted to equivalents using the CML baseline characterisation method (Guinée et al, 2002). For acidification, local allocation factors are applied, due to the difference in soil conditions between Europe and Scandinavia. For abiotic resources, a thermodynamic method based on exergy (available energy) content is used (Finnveden and Östlund, 1997). This approach is chosen as a relevant measure for resource consumption (ibid.).
Table 3.1. Impact categories and sources of values
Impact category Reference of the characterisation method (equivalents)
Source of value
Abiotic
resources MJ World Bank (2009) Global warming CO2 Tol(2008), Stern(2006)
Tropospherical
ozone C2H4 Methodex (2007) Human health 1,4-dichlorobenzen emitted to
air
Espreme (2008), Methodex (2007) Eutrophication PO4 Ahlroth (2009)
Acidification SO2 Ahlroth (2009)
Depletion of abiotic resources is valued in the same way as in the Genuine Savings measure by the World Bank (2009), i.e. by the unit rent (price less unit extraction cost). Since unit rent per exergy content varies considerably between different materials, min/max values are given.
Since greenhouse gases affect the climate on a global level, and cutting down on emissions in Sweden will not significantly decrease damages from climate change here, the value used is global damage costs related to global emissions.
Tol (2008) makes a meta-analysis of “the social cost of carbon” from 211 estimates, and finds that a median estimate is $20 per ton C. The latest assessment is the Stern review (Stern 2006). Here, we use the median estimate from Tol (2008) and the higher boundary Stern estimate as min/max-values, to fully illustrate the span in the estimates. It should be noted that the damage value of global warming include mainly impacts on marketed assets. Impacts on human health are included, but other welfare effects from global warming are not (Stern 2006), which means that these values are underestimates of the total value.
For human toxicity and damages from tropospherical ozone, generic values are available from the ExternE project and its offsprings (Espreme 2008, Methodex 2007). Photochemical oxidants, which contribute to forming tropospherical ozone, are represented by VOC. The min/max values pertain to different assumptions on the valuation of mortality and the threshold for damages from ozone. As indicator for human toxicity, values for several substances are available. A min/max approach is thus used.
For the ecosystem impacts of eutrophication, valuation studies exist but generic values have not been calculated. To get a value for eutrophication consistent with the other values in the set, benefit transfer using existing CV studies from freshwater lakes and rivers as well as coastal areas is performed and aggregated to a national average value (Ahlroth, forthcoming). The value for acidification is updated from Ahlroth (2001).
3.4 Testing the structural benefit transfer method
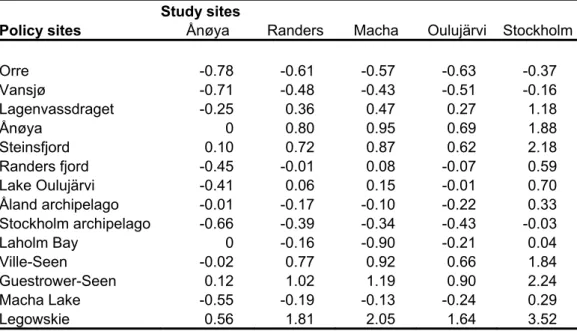
For the derivation of a generic value for eutrophication used in paper III, a method called structural benefit transfer is used (Smith et al.2002). The method is based on a theoretical framework where WTP estimates from studies concerning the same good are linked to the same utility function, which is calibrated with data from the studies. The functional forms used are based on theory rather than empirical estimation, much like in CGE modelling (see section 2.3). The transfer function takes the level of quality, the size of the quality change and mean population income into account.
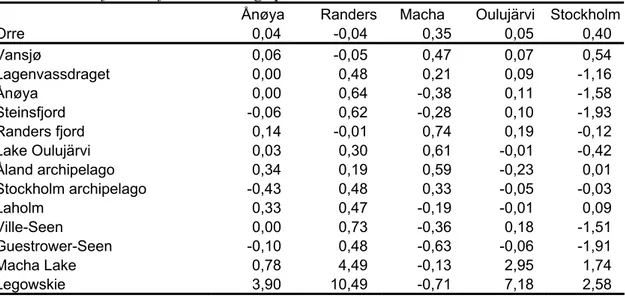
In paper IV, the transfer method is tested for convergent validity2 using 14 valuation studies from countries in northern Europe. The studies all concern the value of improved water quality due to reduced eutrophication. Similar contingent valuations
2 A test of whether transferred WTP for a given environmental quality change significantly different
studies of increased water quality related to eutrophication were available for all the sites. Benefit transfer functions for five of the sites are calibrated and used for testing transfer results. In the transfer, the functions are adjusted for income levels as well as differences in the level and size of quality change at each site. Error rates for the transferred values in relation to the WTP estimates from the original studies are calculated, and the results are compared to error rates using unit value transfer. The unit value transfer is done by using the point estimate from the study site (i.e. the site for which the valuation study was done) to the policy site (i.e. the site for which the WTP estimate from the study site is used as an approximation of the “true” value), only adjusting it for exchange rates.
3.5 Costs and benefits of climate change in Sweden
As mentioned above, there are many assessments of the damage costs of climate change on the global scale. Quantified analyses of costs for specific countries are not as common. Most country-specific assessments are in qualitative terms (SOU 2007:60, annex B35). In Sweden, the governmental Commission on Climate and Vulnerability (SOU 2007:60) performed a detailed analysis compiling the knowledge of experts from governmental and municipal authorities as well as researchers in different scientific fields. The damage cost calculations shown in paper V were done for the Commission. Potential damage costs and benefits in Sweden are estimated given two different climate scenarios, High and Low. They represent “medium high” and “medium low” emission paths, corresponding to an increase in average global temperature of about 2.5 and 3.5 degrees C˚ to the year 2100, respectively. The costs calculations are to be seen as a possible future - “what if”-scenarios in the terminology of Börjeson et al (2006).
In contrast to many global or regional analyses, where economic or integrated assessment models are used, this is a bottom-up analysis. The advantage is that the analysis rests upon as detailed analysis for each sector as possible with current knowledge, data and tools. On the other hand, the interlinkages in the economy are not captured. Furthermore, production losses are difficult to asses and are largely missing in the analysis.
The data and information used were compiled by the working groups attached to the Commission on Climate and Vulnerability. Climate scenarios from the Swedish Meteorological and Hydrological Institute (SMHI) are used to develop two scenarios, outlining damages occurring in different sectors and regions given the changes in temperature, precipitation etc implied in the climate scenarios. The costs for capital losses and restoration of damaged assets of these scenarios are computed, along with decreased costs and increased revenues. For damages that are reparable, restoration costs are used for valuation of man-made capital. Otherwise, loss of capital is valued
with market prices for the assets (e.g. real estate lost due to landslides). Morbidity impacts are valued with market prices (production losses) and remediation costs. Mortality is valued by contingent valuation estimates of the value of a statistical life (VSL).
Part from health effects due to the warmer climate, welfare effects are missing from the calculations. Risks to human lives from extreme weather events are not included. Ecosystems will change in many ways. Examples include lower salinity of the Baltic Sea, overgrowing of bare mountain regions and increased eutrophication of both lakes and seawater, with loss of biodiversity as a result. Warmer temperatures may imply both negative and positive effects.
There are also probable impacts on the economy which are not included. Production losses in industry and service sectors due to both extreme weather events and the long-term changes in temperature and precipitation were not possible to estimate.
3.6 Sustainable Energy Prices and Growth
While the previous papers focus on valuation of environmental impacts, paper VI takes another viewpoint. If we have a sustainable society, what would that imply for the economy in general and for energy prices in particular? Is a sustainable energy use compatible with low energy prices?
We use two quite different perspectives to look at these issues. One is macroeconomic modelling (see section 2.3) and the other is backcasting, an explicitly normative futures study approach (Börjeson et al. 2006). In the paper we follow the backcasting approach described by Höjer and Mattsson (2000).A characteristic part of backcasting as defined here is that target-fulfilling images of the future (often called scenarios) are developed. In the classification of Börjeson et al. (2006), the scenarios developed in a backcasting study are normative, while macroeconomic general equilibrium models provide what-if scenarios, a form of predictive scenarios contingent on certain development of exogenous variables.
The issue of long-term sustainable energy prices is in fact fundamental for both those perspectives, and still it is rarely in focus in such studies. We also discuss why the pictures we get of future possible development paths are so different if we use a macroeconomic model from when using a sustainable energy backcasting scenario.
Macroeconomic models, like general equilibrium models typically do not take ecological limits into account (Daly and Farley 2003). They usually do not deal with large changes in the economic conditions and are therefore not adapted to internalising a shortage of energy into the model or handling major changes in prices.
Changes in behaviour and the development of new types of services are other aspects that are usually not explicitly treated.
In backcasting, as defined in the paper, macroeconomics is usually not taken into account explicitly. There is usually no consistency analysis or discussion of the effects on economic aspects such as prices and the structure of the economy. Instead, the focus of backcasting studies is to illustrate situations where some high-level targets are fulfilled (Dreborg 1996; Höjer and Mattsson 2000).
In the first section of the paper, we compare the assumptions made in some economic scenarios for the period 2000 to 2030, used by the Swedish Ministry of Finance, with scenarios produced in a Swedish back-casting study on sustainable cities (Gullberg et al. 2006). The economic and sustainability scenarios are compared with respect to technical change, consumption of services and working hours. Furthermore, two different developments of the energy price are analysed from a macroeconomic perspective.
In the future study, sustainable energy use means that global energy supply has a very low share of non-renewables and that a nation’s inhabitants do not use more energy per capita than would be possible on a global scale (Gullberg et al. 2006). Technological development is assumed to be increasingly focused on enhancing resource productivity in addition to labour productivity. Two scenarios are chosen from the backcasting study scenarios – Beat and Slow (referred to as the ”sustainability scenarios”). They both represent scenarios with a very low energy use – 60 per cent lower per capita than today. But they differ in terms of time use and economic growth. In Beat, people work on average just as much as they do today. Following growth in productivity they are on average richer than they are now. The increased income is to a great extent spent on services for making daily life more comfortable and on knowledge that have increased in status. In Slow, people use the increasing productivity to reduce working hours. They work on average 25 percent less than today and they have about the same economic standard.
In the economic scenarios, changes are mainly assumed to follow ongoing trends. No specific changes in technology, energy use or energy supply is taken into account. In the Long Time Survey (SOU 2000:7), it is assumed that technology change and thus productivity follows a trend, based on historical data. In a scenario devised by the Resource Efficiency Committee (SOU 2001:2), however, productivity is assumed to grow slightly faster than average for the last 20 years, partly as a result of investments in education and on-the-job training. In addition, there are assumptions about trends in resource efficiency, based on analysis of the development 1957-1996. Part of the economic growth is assumed to be used for cutting down on working hours. Thus this scenario comes closer to the sustainability scenarios.
4. Results
4.1 Greening the national accounts
The model developed for environmentally adjusted national accounts in paper I shows that different impacts should be valued with different types of values, which implies that different valuation methods should be used. In Table 4.1, the included impacts and the valuation method used for each of them are shown.
Table 4.1. Components in the valuation study and corresponding valuation method
Environmental protection
Liming, sewage water treatment
Restoration costs, avertive costs
expenditures Health care, catalytic
converters Remediation costs, avertive costs Corrosion Damage estimated with dose-response
function, valued with market prices
Changes in market
value Nitrate in groundwater Avertive costs
Corrosion Damage estimated with dose-response function, valued with market prices
Production losses Timber growth ”
and stock effects Fish stock ” Labour supply (health) ” Crop damages ”
Welfare effects Health Stated preference valuation
Recreation, groundwater
quality Stated preference valuation
The resulting expression for an environmentally adjusted NDP (EDP) is
) (X X P E P X g S L K C
EDP = + & +ρL&+ρS&+ρS X & + E + X + &
where C = consumption, K& change in stock of man-made capital, = change in labour stock, change in natural resource stocks, E = emissions, X = pollution stock, = L& = S& =
X& change in pollution stock, Pi = utility of good i in monetary terms, ρi = market price of good I and gx = the impact from pollution on the growth of the natural resource stock. The price of the aggregated consumption good is normalised to 1. The first two terms correspond to conventional NDP, with a disaggregation for environmental effects. The last two terms represent the disutility that the households experience due to the current flow of emissions and the change and current level of the pollution stock.
Thus we see that change in capital stocks is valued by their market price. The stock of pollution (X) should be valued also by the disutility to individuals, as should the flow of emissions (E).