J
Ö N K Ö P I N GI
N T E R N A T I O N A LB
U S I N E S SS
C H O O LJÖNKÖPI NG UNIVER SITY
I n v e s t m e n t U n d e r U n c e r ta i n t y
- Risk Assessment in Emerging Market Countries
Paper within Bachelor Thesis in Economics Author: Marina Boltenko (870505-0907)
Ivan Arkhipov (860618-P215) Tutor: Prof. Andreas Stephan
Ph.D. candidate Jan Weiss Jönköping January 2009
i
Bachelor thesis in Economics
Title: Investment Under Uncertainty – Risk Assessment in Emerging
Market Countries
Authors: Marina Boltenko
Ivan Arkhipov
Tutor: Professor Andreas Stephan
PhD. candidate Jan Weiss
Date: January 2009
Keywords Risk assessment; Emerging markets; Investment; Bank approach;
Uncertainty.
JEL Classifications: O5, P5, F2, F4
Abstract
The overall purpose of the paper is to see how crediting institutions assess risks in emerging market countries. The paper describes prevalent economic and social conditions for each of the selected emerging market countries (Brazil, China, Kazakhstan, India, Russia and Ukraine) as examples of recent attractive investment locations in quest of higher returns. Second, recognizing the importance of ratings for risk management in credit institutions, the authors show what determines country ratings made by main rating agencies by running a linear regression on several macroeconomic indicators and the country ratings. It is also explained what the most widely-used ratings mean and described the correlation between the ratings as well as between the macroeconomic indicators and the ratings. The authors also describe the characteristic approach of a Scandinavian bank towards dealing with risk factors in emerging market countries. Concluding comments: risks happen to be inbound in the bank interest rates; there is no common pattern for banks to apply to all the emerging market countries and each market should be analyzed separately. Nordic banks have a relatively safe and careful strategy concerning lending in the emerging markets.
ii
Table of Contents
1 Introduction
1.1 Background of the Study ... 3
1.2 Purpose ... 3
1.3 Organization of the Study ... 4
1.4 Methodology ... 4
1.5 Literature Review...5
2 Theoretical Framework
2.1 The Markowitz Portfolio Theory... 82.2 Credit and Country Risk ... 9
2.3 Business Risk Factors and Components ... 10
2.4 Country Risk in Emerging Markets ... 12
2.5 Risk Assessment Framework ... 13
2.6 Credit Risk Management According to New Basel Capital Accord ... 13
2.7 Credit Risks and Risk Rating Systems ... 14
3 Data and Statistical Method
3.1 Data ... 16 3.1.1 Brazil ... 16 3.1.2 China ... 18 3.1.3 Kazakhstan... 21 3.1.4 India ... 23 3.1.5 Russia ... 25 3.1.6 Ukraine ... 27 3.2 Statistical Method ... 293.3 Limitations of the Approach ... 33
4 Analysis ... 34
5 Results ... 36
6 Conclusions and Suggestions
6.1 Discussion and Conclusion ... 376.2 Limitations ... 38
6.3 Proposals for Further Research ... 38
References ... 39
Appendix 1 ... 41
Appendix 2 ... 41
Appendix 3 ... 42
Appendix 4 ... 43
Appendix 5 ... 44
Appendix 6 ... 46
Appendix 7 ... 48
Appendix 8 ... 52
Appendix 9 ... 53
Appendix 10 ... 57
3 1. INTRODUCTION
1.1 Background of the Study
Nowadays, it is difficult to find a single-standing prosperous bank that has never been a target for acquisition. The global trend in banking industry all over the world is characterized by mass mergers, centralization, reduction in the number of small banks and domination of bank holding companies, with extended chains of services and branches. In the process of global integration, Scandinavian and Western European commercial banks were not exceptions and most of them (SEB, Swedbank, Nordea, Handelsbanken, etc.) pioneered in the “stormy” environment of new markets for financial services.
Current uncertain business environment implies that crediting institutions face higher risks and need sound risk management in order to minimize risk exposure. Better approach and deeper analysis of country specific factors helps commercial banks to allocate resources in the process of risk estimation. Risk management techniques have evolved over time, though credit rating systems remain one of the cornerstones of credit risk management. Notwithstanding, credit risk can only be minimized, but not eliminated. Due to substantial differences in creditworthiness, nominal interest rates for bank loans in emerging market countries include larger risk premiums than in stable developed economies. The dynamic environment of the emerging markets nevertheless implies that banks would have to align with classical principals of precise calculation of risks and profitability of investment projects in order to establish good investments possibilities (Ross & Westerfield, 2005). The return expected above the risk-free rate is known as a market risk premium (MRP), and can be seen as a compensation for an extra risk. Thus, uncertain business environment is incorporated in higher interest rates for commercial loan takers, such as small and medium enterprises (SMEs) in emerging countries. The topic of interest rates and risk premiums is relevant because interest rates available from commercial banks represent cost of debt for investors. In case of SMEs that do not issue shares, cost of debt represents the main source of finance together with internally generated cash flows (Damodaran, 2001). Therefore, they influence investment profitability, capital investment decision and investment opportunity. Cost of debt allows weighing the benefits of the potential investment with the liabilities and allows determining the true cost of taking an investment project.
1.2 Purpose
The overall purpose of the paper is to see how crediting institutions assess and manage risks in emerging market countries (EMCs), what factors are considered by crediting institutions when they face risks of crediting investments in uncertain environment of EMCs.
4
1.3 Organization of the Study
First of all, the paper describes the prevalent economic, financial, social conditions in typical emerging market countries to determine what distinguishes those countries from stable economies and to see the similarities and differences among emerging country markets. The authors look at the problem not only in the scale of emerging markets of Eastern Europe, but rather consider other countries of the world, so that each country would represent a region. Therefore, we take Brazil, China (continental), Kazakhstan, India, Russia and Ukraine as examples of large emerging markets that have recently been attracting attention of banks and individual investors in quest of higher returns.
Second, recognizing the importance of ratings for risk management in credit institutions, the authors show what determines country ratings made by main rating agencies by running a linear regression on several macroeconomic indicators and the country ratings. Furthermore, it is explained what the most widely-used ratings made by rating agencies mean. Also the authors briefly look at the correlation between the ratings as well as between the macroeconomic indicators and the ratings. The writers do not look at the relation between risk and the risk factors because the dynamic view over investment opportunities (Prostacos, 1983) and a great variety of factors (variables) involved into estimation of risk (Chapman & Ward, 2003) seem to make it irrelevant to run any sort of regression analysis of ordinary least squares. The result of such model would be misleading to large extent, probability of autocorrelation or spurious correlation is high as well as the probability of Type I and Type II statistical errors. Therefore, it is assumed that conclusions, made from running a regression model can be misleading, and thus, this type of method is avoided in the work on the topic.
Third, the authors describe what approach and methodology commercial banks pursue towards valuation of credit risks under uncertain environment with respect to the newly introduced Basel II International Convergence of Capital Measurements and Capital Standards. Here we also describe the characteristic approach of a Scandinavian bank towards dealing with risk factors in emerging market countries and the ways the bank uses to monitor debtors’ actions for sound payback.
1.4 Methodology
In order to see how commercial banks deal with credit risk management in emerging market countries (EMCs), a composite questionnaire is composed which addresses either Risk Management departments or Emerging Markets’ departments of several Scandinavian banks (Nordea, Swedbank, SEB, Handelsbanken). Those banks were one of the first and remain among the most active players in emerging markets, especially in Eastern Europe and Commonwealth of Independent States (CIS) countries. In the questionnaire the authors try to obtain information that would help create a general image of overall complex bank’s approach towards financing corporations, exports and investment projects in emerging market countries. It was possible to receive responses from several banks (Nordea and Swedbank). Furthermore, publicly available official reports on risk management and valuation as well as country reports issued by banks
5 (SEB, Swedbank, Handelsbanken) are analyzed for the paper. Those reports help clarify some crucial issues in bank’s approaches, without asking the bank officials directly, as far as the information has already been published. Further on, the information received from the banks on each question was analyzed together with the published reports. As a result, similarities in practices of such kind of operations were found. Thus it enables to come to a general conclusion on characteristic similar practices and approaches of Scandinavian banks dealing with credit risks in emerging countries and better understand, to what extent the label “Emerging Market” influences on the decision of the credit interest rate and terms of business loans.
1.5 Literature review
Firms need financing for capital expenditures, working capital, and other long-term uses. Therefore, the study of cost of debt and its determinants remains relevant. There have been a number of surveys on the way firms establish long-term financing strategies. They show that most of financing for positive net present value (NPV) projects is provided from internally generated cash flows. As a last resort a firm will use externally generated cash flow, and the first one to use is debt. Common stock is used last (Donaldson, 1961). These results are consistent with the international financial patterns in sources of funds as a percentage of total sources held by OECD (OECD, 1995).
One of the cornerstone theories, which can be also applicable within the frame of the paper, is Harry Markowitz’s theory of portfolio diversification and risk, described in his work “Portfolio Selection” (1952). Markowitz highlighted the way, how investors could reduce the standard deviation of portfolio returns by choosing stocks, which are not highly correlated. The author also emphasized that risk aversion would be one of the core factors driving investors’ decisions. Therefore, Markowitz concludes that investors with high risk aversion would tend to prefer holding diversified portfolios to minimize the risk associated with variance of returns. Based on this theory, it is generally believed that risk-averse investors try to maintain diversified portfolios.
However, empirical studies exploring the link between risk aversion and portfolio diversification do not necessarily support Markowitz mean-variance theory. For instance, the study of Barasinska, Schäfer and Stephan (2008) explores the link between risk aversion of households and their portfolio diversification using a large sample of German households. Main demographic characteristics (age, gender, number of children) of the members of household are controlled in the study. Moreover, information on socioeconomic status of household members (education, occupation, self-employment, income and ownership of financial assets) is provided. Despite some limitations, it was found that “self-declared risk aversion and actual behavior in diversifying investments do not always match as expected from the portfolio theory.”
The paper by Ricardo Caballero (1991) shows that asymmetric adjustment costs are not sufficient to cause negative relation between investment and mean-preserving changes in uncertainty. What is also needed is imperfect competition. The author also finds that the asymmetry of adjustment costs does not influence greatly the sign of the
investment-6 uncertainty relation. Decisions of investors depend to a large extend on the price of capital and the expected marginal profitability of capital. Therefore, the sign of the investment-uncertainty relation is mainly established by the convexity of marginal profitability of capital in regards to prices. On the other side, with imperfect competition, the marginal profitability of capital is greatly influenced by the level of capital. Having much capital is worse than having little capital (Caballero, 1991).
In the paper of Baum, Caglayan and Talavera (2006) the impact of measures of uncertainty on firms’ capital investment behavior is investigated, using a panel of U.S. firms. The authors consider three forms of uncertainty affecting firms’ investment decisions. Those are own uncertainty that is derived from firms’ stock returns, market uncertainty derived from Standard & Poor’s 500 index returns and the relations between intrinsic and extrinsic uncertainty. It was found that “own uncertainty has a negative impact on investment in a model incorporating a measure of Tobin’s Q, and a measure of Capital Asset Pricing Model based uncertainty has a negative effect on investment”. Furthermore, it was found that market uncertainty has a positive impact of firm investment (Baum, Caglayan & Talavera, 2006).
There have been several researches conducted, using such statistical methods as principal component analysis and stepwise regressions that enable to prove that investment risk in EMCs is priced within the higher risks premiums, without taking into consideration firm-specific factors, such as beta coefficient, size and price-to-book value ratio for listed companies (Girard & Rahman, 2007). However, Girard and Rahman look at the problem of risk premiums at the equity market, whereas the problem of risk premiums on the debt market is considered in our paper. The results of Girard & Rahman, 2007 show that interest rates are relatively high in the countries with high risks.
Brigo and Pallavicini (2006) look at how counterparty risk influences interest rate by estimating the correlation between the default of an event and interest rates. For their studies they use a stochastic intensity model with possible jumps adopted for the default event. This allows estimating the correlation between counterparty risk and interest rates. In the paper it is found that counterparty risk significantly influences interest-rate payoff prices. Consequently, correlation between interest rates and default (intensity) considerably influences the adjustments due to counterparty risk. The pattern of such impacts as product characteristics and tenor structures change through fundamental numerical examples is analyzed in the paper. It allows finding of stable and reasonable patterns. If default intensities increase, with high positive correlation their correlated interest rates will increase more than with low correlation.
The study of Arunkumar and Kotreshwar (2005) stresses the importance of efficient risk management system in commercial banks and describes the relevant changes in risk management practices in Indian commercial banks after the introduction of the current Bank for International Settlement (BIS) regulatory model – New Basel Capital Accord and Risk Based Supervision. This study gives theoretical background on credit risk management and shows that continuous adjustment and improvement of credit risk management practices is a global trend.
7
It is claimed in the paper by English and Nelson “Bank Risk Rating of Business Loans” (1998) that mainly all large banks attempt to improve the measurement and management of credit risk by assigning risk ratings to business loans. Therefore it remains relevant to understand which factors influence ratings and what the ratings mean. Furthermore, the study finds that riskier loans generally carry higher interest rates, even after taking into account of other loan terms. The regression results from this study prove that banks of all sizes price the risk premiums.
8 2. THEORETICAL FRAMEWORK
2.1 The Markowitz Portfolio Theory
Mean-variance theory is an important model of investment based on decision theory. The theory was developed in the 50’s and 60’s by Markowitz, Tobin and Sharpe. It shows how investors select assets when only the mean and variance of portfolio returns is considered. The theory relies on some assumptions. First, investors consider expected rates of return for alternative assets. Second, investment decisions are based on the levels of expected return and the expected risk. Third, investors prefer assets with higher expected returns for any given risk level, or with lower risk for any given expected return level (Brown & Reilly, 2005).
It is stated in the theorem that risk should be taken in the proportion to the risk premium and in reverse proportion with variance and risk aversion. Investor can reduce portfolio risk by diversifying assets, meaning by holding assets that are not perfectly correlated. Diversification can allow the same portfolio return with reduced risk. Risk-averse investors are predicted to have more diversified portfolios that can minimize the risks associated with variance of returns. Efficient portfolios (or Markowitz portfolios) are defined as the ones providing minimum variance for a given expected return or maximum expected return for a given variance (Markowitz, 1952).
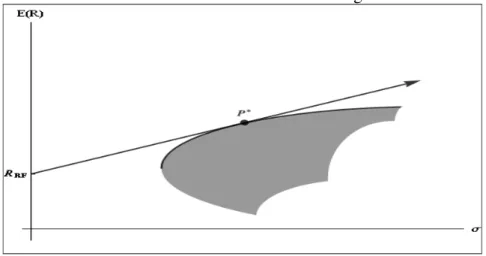
Graphically, efficient portfolios are shown on the expected return/standard deviation (or risk) dimensions because according to the theory those parameters can summarize all the information about a portfolio of assets. In the diagram below the shaded area represents the set of parameter pairs of feasible portfolios. Along the upper edge of the feasible set is the efficient frontier. Each point on this line represents an efficient portfolio, that is, the portfolio that has the highest expected return for a given level of risk. From the point on the vertical axis at the rate of return on the risk-free asset and tangent to the efficient frontier runs the linear asset allocation line. At the point of tangency is located the super-efficient portfolio parameter (Damodaran, 2001).
Figure 1: Markowitz Portfolios
9 Sharpe (1964) stated that the investors’ optimal portfolio can lie on the line tangent to the efficient frontier and intersecting the vertical axis at the risk-free rate of return. Tobin’s (1958) main finding was that the asset allocation line that divides portfolio into the part of investment into risky assets and the part of investment into risk-free assets.
2.2 Credit and Country Risk
Risk is defined as the possible outcomes when their probabilities are known, but the exact future consequences are unknown. Uncertainty is defined as the probability distribution, and thus the consequences for different outcomes are unknown. Credit risk is defined as the default by the borrower to repay lent money. It is the uncertainty associated with borrower’s loan repayment (Arunkumar & Kotreshwar, 2005). This remains the most important risk to manage.
Lending represents the main activity within the commercial banking industry. Asset holdings are dominated by loans and loans generate the largest part of operating income. Pricing a loan requires arrangers to evaluate the risk inherent in a loan. The principal credit risk factors that banks and institutional investors contend with in buying loans are default risk and loss-given-default risk. Among the primary ways that accounts judge these risks are ratings, credit statistics, industry sector trends, management strength, and sponsor. All of these, together, determine loan terms and conditions (Yang & Watters, 2008). In order to define the probability of default, credit analysis that is based on quantitative and qualitative data can be implemented. 70% of credit risk is determined by the default risk, while 30% can be determined by both market risk (market price fluctuations) and operational risk (internal control failure for example) (Arunkumar & Kotreshwar, 2005).
Intrinsic risk, transaction risk and concentration risk constitute credit risk. Transaction risk emphasizes vulnerability in the quality of credit, and changes in earnings that result from the way banks underwrite transactions of individual loans. Intrinsic risk focuses on the risk inherent in certain lines of business and loans to certain industries. It addresses the susceptibility to historic, predictive, and lending risk factors that characterize an industry or line of business. The mixture of intrinsic and transaction risks is called concentration risk of portfolio and may result from absence of diversification by geographic region, loan taker or business area. It determines extend of problems the bank can experience under adverse conditions (Arunkumar & Kotreshwar, 2005).
The global perspective imposes a consistent effect on the cross-border analysis of borrower creditworthiness. It allows weighing the diverse national considerations in order to assess a debt holder in its local context. Analysis of each debt holder should be held in conjunction with relevant financial characteristics of a specific country or region. If the regional environment poses an additional risk to corporations operating there, that should also be incorporated in the general credit risk assessment (Standard & Poor’s, 2008). Country financial ratings are commonly-used in financial markets, primarily to measure the ability of government organizations to pay their debts on time. However, businesses
10 and other participants in international trade lacked a country rating system to accurately assess their global business-to-business trade risks, specifically the risks of corporate payment default in a given country (International Country Risk Guide, 2006).
Business risk analysis entails the assessment of an issuer’s economic, operational, and competitive environment. The analysis of corporations of different nationalities calls for an appreciation of the environment where those corporations function that includes specific geographical and industrial mix (Standard & Poor’s, 2008). However, it is important to state that there are credit-worthy companies in high-risk countries and companies with poor payment records in low-risk countries. Therefore, the overall risk depends on both the company’s and the country’s specific characteristics (International Country Risk Guide, 2006). Some companies have managed to honor their obligations even under severe circumstances, such as inflation, currency devaluation, and fiscal crisis that cause the government to default on its foreign currency debt. It means that such companies have a higher currency rate than sovereign local currency rating. Though it is mainly an exemption to the rule, and all companies are extensively affected by country factors.
In order to evaluate the borrower it is important that the debt issuer can show financial statements prepared in accordance with the prevailing local standards. They should meet international standards and should be audited by a reputable firm. In some emerging market countries it is crucial to resolve in advance what level of disclosure will be available on an ongoing basis (Standard & Poor’s, 2008).
2.3 Business Risk Factors and Components
Country risk is defined as the risk that something may happen in a foreign country that will stop or discourage state-owned and/or privately owned customers in that country from paying their debts on time (Skandinaviska Enskilda Banken, 2007). One of the crucial positions to be highlighted is to define the conditions of determining the country risks by major crediting institutions (including main banks operating in Scandinavia and Western Europe). It is necessary to eliminate the credit-taker company’s reputation, financial position, and to presume a stand-alone project. Therefore, business risk factors are evaluated by considering the possibility of a country’s default on its liabilities, rather than the environment in which business has to operate. The business might face the core problems, such as unexpected fluctuations of inflation and exchange rates, changes in taxation regulations, business cycles, political and social environment, regional bank crisis and the possibility of natural disasters. Those characteristics, combined with the overall current rating of the country made by major rating agencies (e. g. S&P, Fitch and Moody’s), create the business environment, which banks consider during when evaluating the creditworthiness of investment projects.
Many different providers of country risk data evaluate business risk factors that should be considered for the country risk analysis. Those providers include the Bank of America World Information Services, the International Country Risk Guide made by Coface, Control Risks Information Services, Euromoney, Business Environment Risk
11 Intelligence, Institutional Investor, S&P Rating Group, the Economist Intelligence Unit, Moody’s Investor Services, etc. Different techniques are used by financial institutions and rating agencies in order to evaluate country risk. Rating agencies continuously track a series of individually rated indicators for different countries. It is possible to classify those indicators into a number of subsets. For example, Coface country ratings measures the average corporate payment default risk in a given country and indicates to what extent a company’s financial commitments are affected by the local business, financial and political outlook. The subsets include political factors that could interrupt payment or performance of contracts in progress, risk of currency shortage as a consequence of balance of payments crisis that can result in transfer difficulties and/or rescheduling of public or private borrowers’ foreign debt, the State’s ability to meet its commitments abroad, risk of sudden devaluation because of significant capital withdrawals, risk of a systematic crisis in the banking sector that could be caused by financial bubbles, cyclical risk that reflects the likelihood of a slowdown in short-term growth independent of any above-mentioned risk factors, and payment behavior for short term transactions (International Country Risk Guide, 2006).
The International Country Risk Guide (ICRG) made by Coface assesses a country risk by evaluating economic, financial, and political criteria which are determined by different factors. The factors are then scored for each country. Eventually, the country risk score is composed by evaluating simultaneously all the three dimensions for each country. The country risk factors and scoring system used by ICRG are listed further:
Table №1. Country Risk Factors
Country Risk Factor Risks Associated with
Government Stability (GST) government’s ability to carry out its declared programs, and its ability to stay in office
Socioeconomic Conditions (SOE)
general public satisfaction with the government’s economic policies
Investment Profile (IPR) expropriation, taxation, repatriation of capital, and labor costs
Internal Conflict (ICO) political violence and its impact on governance
External Conflict (XCO) both the incumbent government and inward investment Corruption risk (COR) corruption within the political system
Military in Politics (MIL) military involvement in politics
Religion Tensions (RT) the domination of a single religious group or the suppression of religious freedom
Law and Order (LO) the weakness and partiality of a legal system, and the lack of observance of law
Ethnic Tensions (ET) tensions within a country attributable to racial, nationality, or language divisions
Democratic Accountability (DA)
government that is not responsive to its people Foreign Debt as a percentage
of GDP (FD)
12 Foreign Debt Service as a
percentage of Exports of Goods and Services (DS)
foreign debt service per year, in U.S. dollars
Net International Liquidity as Months of Import (LIQ)
total estimated official reserves for a given year, in U.S. dollars
Exchange Rate Stability (XSTB)
risk associated with the appreciation/depreciation of a currency against the U.S. dollar
GDP per Head (POP) low GDP per head for a given year
Real GDP growth (GDPG) percentage increase or decrease in the estimated GDP Annual inflation Rate (INF) annual inflation budget deficit for a given year in the
national currency Current Account as a
percentage of GDP (CAG)
current account balance deficit for a given year
Source: International Country Risk Guide, 2006
2.4 Country Risk in Emerging Markets
In emerging markets country risk takes on added importance. Numerous country-specific factors pertain to corporate analysis, and all companies are extensively affected by country factors. With increasing integration of financial markets in the developing economies as a result of globalization, deregulation and advances in technology, financial institutions pay more attention to expansion to the emerging markets in order to benefit from diversification and higher returns (Girard & Rahman, 2007). Reduction of concentration risk is possible through diversification of credit portfolio.
In general, creditworthiness of emerging market countries have improved, judged by the general rating upgrade from the three officially recognized credit rating agencies, Standard & Poors, Moody’s and Fitch (Skandinaviska Enskilda Banken, 2007). However, those positive changes might be less fundamental than hoped for but rather reflect a confluence of favorable developments. For example, many poorer countries have recently benefited from increased commodity prices, which still constitute the major export products from many emerging markets. Also, interest rates and investors’ risk aversion in crediting countries have fallen to a low level that facilitates the refinance of the external debt of several heavily indebted emerging market countries. EMCs have also benefited from a boom in consumption and investment demand in the US that enables to boost their current account balances (Skandinaviska Enskilda Banken, 2007).
However, the favorable investment climate maintained in developing regions and the CIS is more than offset by the adverse effects of financial market turbulence, especially that arising from the US sub-prime market crisis in the second half of 2007 (Skandinaviska Enskilda Banken, 2007). The global financial crisis 2008 resulted in a severe economic downturn in particular in emerging country economies because of reduced credit and lower export demand. Risk aversion increased among investors that in turn resulted in less foreign-exchange loans. It influences negatively credit systems in emerging countries as “weak” credit institutions are acquired or nationalized.
13
2.5 Risk Assessment Framework
Risk is uncertainty in some form and is a natural ingredient in all types of operations. It denotes a potentially negative impact on a company that can arise due to current internal processes or future internal or external events. The concept of risk comprises both the likelihood that an event will occur and the impact it would have on the company (Swedbank, 2007). Currently banks are shifting towards a new high powered environment of financial operations and trading, that is characterized by unknown nature of risks. It becomes crucial for banks to have an efficient risk management system that allows continuous survival in the market. Thus effective credit risk management is vital for the success of the financial institution, especially in the industry characterized by tough competition and credit risk rating system becomes one of the cornerstones of credit risk management (Arunkumar & Kotreshwar, 2005). Credit institutions should apply a sharply framed system to distinguish risk event, evaluate its probability, calculate possible loss, and evaluate the possibility of its exposure, evaluate the costs of the risk facture and monitor it (see appendix 1). Risk management practitioners have constantly tried to improve current techniques and in recent years, many steps have been made in credit risk management (Mohan, 2001).
In general, most of the banks have developed in-house rating systems for their borrowers. The problem is a correct identification of prevalent risk factors, understand the value of those risks, and create possibility of risk diversification as well as include the costs of associated risks to the credit portfolio. The key problem of credit management model is absence of necessary data to make correct evaluation of parameters that include probability of default, ratings, and value of the loss in case of default, and determine factors that influence those parameters, also the correlation between risks (Arunkumar & Kotreshwar, 2005).
Risk management primary consists of preventive and curative measures. Risk assessment, measurement and pricing, warning system to pick early signals of possible defaults and better credit portfolio diversification constitute preventive measures. The purpose of curative measures, however, is to minimize consecutive losses through risk sharing, securitization, legal enforcement, derivative trading, etc (Arunkumar & Kotreshwar, 2005).
2.6 Credit Risk Management according to the New Basel Capital Accord
The progress in regards to risk management techniques was reached with an introduction of the current Bank for International Settlement (BIS) regulatory model. The New Basel Capital Accord started to function at the end of 2006, and all the banks (including domestic and international) should have joined the Accord (Arunkumar & Kotreshwar, 2005). The rules strengthen the link between risk taking and capital requirements. Also they require more strict requirements on banks concerning risk management. Moreover, they oblige credit institutions to disclose information about its risks, risk management and capital requirements (Swedbank, 2007). According to the Basel Accord banks can choose between two broad methodologies for calculating their capital requirements for
14 credit risk. One option is the Standardized Approach that measures credit risk in a standardized manner, supported by external credit assessments. The other option is the Internal Rating-based (IRB) Approach that allows banks to use their own rating systems for credit risk (e.g. used by Swedbank). Banks need to receive supervisory approval to use the IRB approach. When determining the risk weights in the standardized approach banks may use assessments by external credit assessment institutions recognized as eligible for capital purposes by national supervisors. When using the IRB approach, banks need to evaluate the risk components that determine the capital requirement for a given exposure. The risk components include measures of the probability of default (PD), loss given default (LGD), the exposure at default (EAD), and effective maturity (M) (International Convergence of Capital Measurement and Capital Standards, 2006). The expected loss (EL) is the product of the three risk dimensions:
PD * LGD * EAD = EL (1.1)
EL provides an indication of the mean value of the credit loss that a bank is expected to incur. Also banks must maintain a capital buffer against unexpected losses (UL) to protect themselves against losses exceeding the predicted level. EL and UL both need to be considered in pricing and the monitoring of profitability. Eventually, the capital requirement for the credit risk is calculated on the basis of PD, LGD, EAD and the type and size of the counterparty (Swedbank, 2007). In some cases, banks can be required to use a supervisory value rather than an internal estimate for some risk components. The risk components serve as inputs to the risk-weight functions that have been developed for separate asset classes (International Convergence of Capital Measurement and Capital Standards, 2006). The general aim of the Basel Accord is to boost the safety of the world banking system.
2.7 Credit Risk and Risk Rating Systems
Banks tend to have at least rudimentary risk rating systems, and loan risk is reflected in price and non-price terms. Smaller banks tend to have less sophisticated rating systems, but still loans by such institutions are very likely to be rated, and the terms and conditions of such loans appear to be quite sensitive to risk (English & Nelson, 1998).
Risk rating matters because it helps banks to improve their operations in a number of ways. First, it forces the loan officer to make an explicit assessment of the risk of a loan at the time it is approved. Second, it provides management with a way to assess the risk of the current portfolio, and so decide how much additional risk is desirable. Finally, it provides a quantitative measure of how current lending decisions are affecting the riskiness of the loan portfolio. Taken together, these three benefits suggest that risk ratings should allow banks to price the credit risk of a loan more precisely. Another benefit is that monitoring resources can be allocated more efficiently – lower rated loan can receive more careful scrutiny and the downgrading of a loan may provide a signal to the bank that actions should be taken to avoid a loss. The resulting improvement in the liquidity of business loans would be expected to lower their costs.
15 Thus, external rating systems have large influence on decision of crediting institutions whether to give credit and which interest rate to offer. The widespread application of risk rating by banks should be favorable for the banking industry as well as for the economy as long as ratings are reliable and provide correct information about possible future loan losses (English & Nelson, 1998). Therefore, it becomes important to understand how major rating agencies compose their ratings, what those ratings mean and which factors have a major influence on ratings.
16 3. DATA AND STATISTICAL METHOD
3.1 Data
One of the key questions is remaining the same – What are the elements of uncertainty in the emerging markets? How do we distinguish stable semi-market or market economy from the one, still affected by severe fluctuations in political and economic development, what finally creates the image of uncertain, but still emerging market?
To see the so-called bird’s view picture of macroeconomic indicators characterizing a range of selected economies for research, it was decided to make a composite analysis, based on data, provided by the Coface Database of Country Ratings (apart from sectoral risks). Moreover, it also makes sense to combine it with the bank reports of emerging markets done by SEB International Department. In addition, from the small and medium size enterprises perspective, these country-specific analyses are combined with recent reports represented in co-publication of the World Bank, International Finance Corporation and Palgrave Macmillan, called “Doing Business 2009”.
The later material investigates the regulations that enhance business activity and those that control it. It represents quantitative indicators on business regulations and the protection of property rights that can be compared across 181 economies over time. Regulations, affecting ten stages of business life are measured according to the following processes:
o starting a business;
o dealing with construction permits; o employing workers;
o registering property; o getting credit; o protecting investors; o paying taxes;
o trading across borders; o enforcing contract; o closing a business.
(Doing Business 2009, 2008).
3.1.1 Brazil
Doing Business 2009 Ranking: 125 (126 in 2008) Rating Agency Country Risk History:
2002 2003 2004 2005 2006 2007
Fitch B+ B B B+ B+ B+
17 Brazil has an average possibility of corporate default. The country is characterized by the volatile political and economic situation. In general, there was a positive growth and good macroeconomic balance recently. Demand within the country remains high that influences positively economic growth, which can be predicted within the 5% level. However, internal environment remains not positive enough to improve export performance of Brazil. Thus, current account deficit is predicted for the country in 2008 and 2009 unless there is a sound increase in foreign direct investment to the country. The Central Bank has stopped the reduction of interest rates. Therefore interest rates in Brazil remain relatively high. Moreover, public debt remains high (65% of GDP in gross terms and 45% in net terms in 2007). Due to high debt and lack of political stability, improvements in infrastructure and necessary reforms are postponed (International Country Risk Guide: Brazil, 2006).
Assets:
• Abundant natural resource base;
• Economic diversification with large export-oriented industrial sector;
• Better economic and market stability environment in recent years and planned
reforms for future macroeconomic balance;
• Attractive for foreign investment due to large internal market and competitive
labour costs. Weaknesses:
• Not effective development of private or public transportation infrastructure; • Dependence on fluctuations of raw material prices;
• Necessity of social reforms in all fields;
• Large public debt, affecting domestic interest rates with short maturity.
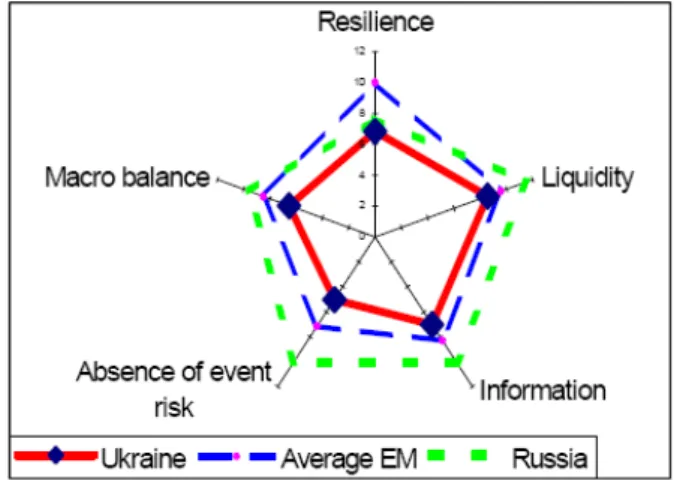
(International Country Risk Guide: Brazil, 2006). Risk assessment:
18 Graph: Brazil’s risk profile is close to the average for all emerging market countries, only somewhat weaker on macro balance. Compared with India, Brazil is weaker on liquidity and information, but stronger on resilience.
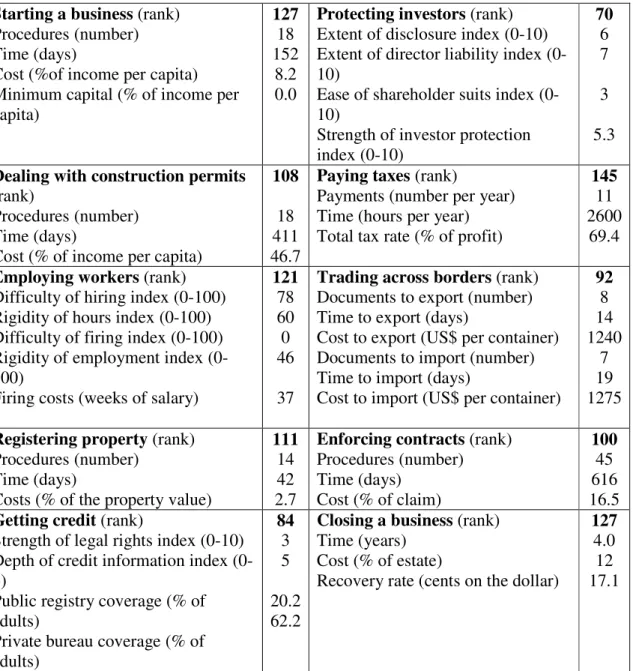
Table №2. Doing Business: Brazil
Starting a business (rank) Procedures (number) Time (days)
Cost (%of income per capita) Minimum capital (% of income per capita) 127 18 152 8.2 0.0
Protecting investors (rank) Extent of disclosure index (0-10) Extent of director liability index (0-10)
Ease of shareholder suits index (0-10)
Strength of investor protection index (0-10) 70 6 7 3 5.3
Dealing with construction permits
(rank)
Procedures (number) Time (days)
Cost (% of income per capita)
108
18 411 46.7
Paying taxes (rank)
Payments (number per year) Time (hours per year) Total tax rate (% of profit)
145
11 2600
69.4
Employing workers (rank)
Difficulty of hiring index (0-100) Rigidity of hours index (0-100) Difficulty of firing index (0-100) Rigidity of employment index (0-100)
Firing costs (weeks of salary)
121 78 60 0 46 37
Trading across borders (rank)
Documents to export (number) Time to export (days)
Cost to export (US$ per container) Documents to import (number) Time to import (days)
Cost to import (US$ per container)
92 8 14 1240 7 19 1275
Registering property (rank)
Procedures (number) Time (days)
Costs (% of the property value)
111
14 42 2.7
Enforcing contracts (rank) Procedures (number) Time (days) Cost (% of claim) 100 45 616 16.5
Getting credit (rank)
Strength of legal rights index (0-10) Depth of credit information index (0-6)
Public registry coverage (% of adults)
Private bureau coverage (% of adults) 84 3 5 20.2 62.2
Closing a business (rank) Time (years)
Cost (% of estate)
Recovery rate (cents on the dollar)
127
4.0 12 17.1
Source: combined data from Doing Business 2009 and 2008
3.1.2 China
Doing Business 2009 Ranking: 61 (58 in 2008) Rating Agency Country Risk History:
19
2002 2003 2004 2005 2006 2007
Fitch A- A- A- A- A A
S&P BBB BBB BBB+ A- A A
Moody’s A3 A3 A2 A2 A2 A1
China can be characterized as having stable political and economic environment though with high possibility of governmental interference in business. Average threat for corporate default exists in the country. Economic growth in China has remained one of the highest in the world during the recent years. This could be explained by high internal and external demand for the goods produced in the country. China is expected to have persistent current account surplus. On the other hand, domestic demand is expected to decrease due to the expected “burst of Stock Exchange bubble, the correction in the real estate market” and an increase in inflation. Chinese society can still be characterized by large inequality in incomes, in particular between urban and rural population, that can cause social and political turbulences (International Country Risk Guide: China, 2006). Assets:
• High external account due to diversified and competitive industrial sector; • Large infrastructural projects for Olympic Games 2008 in Beijing;
• High rate of corporate savings enables to finance most investments with internal
funds;
• Rise-up of China on the international political and economic arena.
Weaknesses:
• Unsolved dispute with status of Taiwan;
• Some industrial and commercial sectors might experience large decline due to
overcapacity in case of recession;
• Underdeveloped banking sector, which is already not enough to provide funds for
potential projects and growth;
• Disregard of environmental problems; • Social misbalance and increasing inequality.
(International Country Risk Guide: China, 2006) Risk Assessment:
20
Source: www.seb.se
Graph: China scores above average on macro balance and liquidity, but is weaker on reliable information and more exposed to event risk than the average EMC. Resilience is about the average for EMCs.
Table №3. Doing Business: China
Starting a business (rank) Procedures (number) Time (days)
Cost (%of income per capita) Minimum capital (% of income per capita) 151 14 40 8.4 158.1
Protecting investors (rank) Extent of disclosure index (0-10) Extent of director liability index (0-10)
Ease of shareholder suits index (0-10)
Strength of investor protection index (0-10) 88 10 1 4 5.0
Dealing with construction permits
(rank)
Procedures (number) Time (days)
Cost (% of income per capita)
176
37 336 698.4
Paying taxes (rank)
Payments (number per year) Time (hours per year) Total tax rate (% of profit)
132
9 504 79.9
Employing workers (rank)
Difficulty of hiring index (0-100) Rigidity of hours index (0-100) Difficulty of firing index (0-100) Rigidity of employment index (0-100)
Firing costs (weeks of salary)
111 11 20 50 27 91
Trading across borders (rank)
Documents to export (number) Time to export (days)
Cost to export (US$ per container) Documents to import (number) Time to import (days)
Cost to import (US$ per container)
48 7 21 460 6 24 545
Registering property (rank)
Procedures (number) Time (days)
Costs (% of the property value)
30
4 29 3.2
Enforcing contracts (rank) Procedures (number) Time (days) Cost (% of claim) 18 34 406 11.1
Getting credit (rank)
Strength of legal rights index (0-10)
59
6
Closing a business (rank) Time (years)
62
21 Depth of credit information index
(0-6)
Public registry coverage (% of adults)
Private bureau coverage (% of adults)
4 58.8
0
Cost (% of estate)
Recovery rate (cents on the dollar) 22 35.3
Source: combined data from Doing Business 2009 and 2008
3.1.3 Kazakhstan
Doing Business 2009 Ranking: 70 (80 in 2008) Rating Agency Country Risk History:
2002 2003 2004 2005 2006 2007
Fitch BB- BB BB+ BB+ BBB- BBB
S&P BB- BB BB+ BB+ BBB- BBB
Average corporate default risk exists in Kazakhstan. The country can be characterized by the volatile political and economic situation. However, stable relatively high rate of GDP growth has been evident in the country for the recent years. The economy has benefited from abundant natural recourses, such as oil, iron, uranium and others, but is expected to suffer heavily from the subprime crisis because the country is dependent on foreign credits. Financial crisis causes decreased consumption, a fall mainly in construction and financial sectors of the economy. However, current stable political power is expected to guarantee necessary measures to minimize the negative effects of financial crisis (International Country Risk Guide: Kazakhstan, 2006).
Assets:
• One of the leading natural resource abundant countries (oil, natural gas, iron ore,
uranium);
• Expected threefold increase of exports of oil due to new fields development and
investments in infrastructure;
• Strong sovereign fund accumulated from oil revenues can support economy in
case of crisis;
• Relatively more stable and open to foreign capital and cooperation compared to
other Central Asian states. Weaknesses:
• Already high level and ongoing growth of reliance on private credit; • Uncertainty about further succession to current president Nazarbaev; • High level of corruption and scarce transparency.
(International Country Risk Guide: Kazakhstan, 2006) Risk Assessment:
22
Source: www.seb.se
Graph: The graph depicts the creditworthiness of Kazakhstan as “flat”, meaning strong on liquidity and macro balance, though weaker on information and event risk, compared with other emerging market countries and one of its peers, Russia. Resilience is close to average.
Table №4. Doing Business: Kazakhstan
Starting a business (rank) Procedures (number) Time (days)
Cost (%of income per capita) Minimum capital (% of income per capita) 78 8 21 5.2 15.9
Protecting investors (rank) Extent of disclosure index (0-10) Extent of director liability index (0-10)
Ease of shareholder suits index (0-10)
Strength of investor protection index (0-10) 53 7 1 9 5.7
Dealing with construction permits (rank)
Procedures (number) Time (days)
Cost (% of income per capita)
175
38 231 1431.8
Paying taxes (rank)
Payments (number per year) Time (hours per year) Total tax rate (% of profit)
49
9 271 36.4
Employing workers (rank)
Difficulty of hiring index (0-100) Rigidity of hours index (0-100) Difficulty of firing index (0-100) Rigidity of employment index (0-100)
Firing costs (weeks of salary)
29 0 40 30 23 9
Trading across borders (rank)
Documents to export (number) Time to export (days)
Cost to export (US$ per container) Documents to import (number) Time to import (days)
Cost to import (US$ per container)
180 11 89 3005 13 76 3055
Registering property (rank)
Procedures (number) Time (days)
Costs (% of the property value)
25
5 40 0.1
Enforcing contracts (rank) Procedures (number) Time (days) Cost (% of claim) 28 38 230 22
23
Getting credit (rank)
Strength of legal rights index (0-10) Depth of credit information index (0-6)
Public registry coverage (% of adults)
Private bureau coverage (% of adults) 43 5 6 0.0 25.6
Closing a business (rank) Time (years)
Cost (% of estate)
Recovery rate (cents on the dollar)
100
3.3 18 25.3
Source: combined data from Doing Business 2009, 2008
3.1.4 India
Doing Business 2009 Ranking: 122 (120 in 2008)
Business environment is relatively secure, though with average probability of corporate default. Since 2003 India has demonstrated high GDP growth (9% in 2007). A slight decline in the economic growth is expected in the coming years, though GDP growth will remain high because of good foreign investment flow to the country, reasonable external debt and high savings. From the negative side, it remains challenging to obtain financial information for companies operating in India due to the lack of transparency. Inflation is still high that can be explained by the growing food and energy prices. Economic growth is slowed down by enormous needs to improve infrastructure and social services (International Country Risk Guide: India, 2006).
Rating Agency Country Risk History:
2002 2003 2004 2005 2006
Fitch BB BB BB+ BB+ BBB-
S&P BB BB BB BB+ BB+/pos
Moody’s Ba2 Ba1 Baa3 Baa3 Baa3
Assets:
• Quite small foreign debt and large enough foreign exchange reserves;
• Steady and “healthy” economic growth, based on exports, investment and growth
of internal consumption;
• High savings rate creates benefit for corporate financing;
• Secure private property rights create advantage in development of progressive
sectors, such as IT, pharmaceuticals, outsourcing, and textiles. Weaknesses:
• Recent rapid increase in private company debt;
• Underdevelopment of transportation infrastructure in some areas; • Rural areas are falling behind today’s economic development;
24
• Public sector financial misbalances create the largest problem, when most of
development projects can not be preceded as funds are spent on debt service. (International Country Risk Guide: India, 2006) Risk Assessment:
Source: www.seb.se
Graph: India’s risk profile is strong on information and liquidity (like Russia), but other parts of the pentagon fall in or within average, meaning worse. Estimates of event risks include instability in neighboring Pakistan.
Table №5. Doing Business: India
Starting a business (rank) Procedures (number) Time (days)
Cost (%of income per capita) Minimum capital (% of income per capita) 121 13 30 70.1 0
Protecting investors (rank) Extent of disclosure index (0-10) Extent of director liability index (0-10)
Ease of shareholder suits index (0-10)
Strength of investor protection index (0-10) 38 7 4 7 6.0
Dealing with construction permits
(rank)
Procedures (number) Time (days)
Cost (% of income per capita)
136
20 224 414.7
Paying taxes (rank)
Payments (number per year) Time (hours per year) Total tax rate (% of profit)
169
60 271 71.5
Employing workers (rank)
Difficulty of hiring index (0-100) Rigidity of hours index (0-100) Difficulty of firing index (0-100) Rigidity of employment index (0-100)
Firing costs (weeks of salary)
89 0 20 70 30 56
Trading across borders (rank)
Documents to export (number) Time to export (days)
Cost to export (US$ per container) Documents to import (number) Time to import (days)
Cost to import (US$ per container)
90 8 17 945 9 20 960
25
Registering property (rank)
Procedures (number) Time (days)
Costs (% of the property value)
105
6 45 7.5
Enforcing contracts (rank) Procedures (number) Time (days) Cost (% of claim) 180 46 1420 39.6
Getting credit (rank)
Strength of legal rights index (0-10) Depth of credit information index (0-6)
Public registry coverage (% of adults)
Private bureau coverage (% of adults) 28 8 4 0 10.5
Closing a business (rank) Time (years)
Cost (% of estate)
Recovery rate (cents on the dollar)
140
10.0 9 10.4
Source: combined data from Doing Business 2009 and 2008
3.1.5 Russia
Doing Business 2009 Ranking: 120 (112 in 2008)
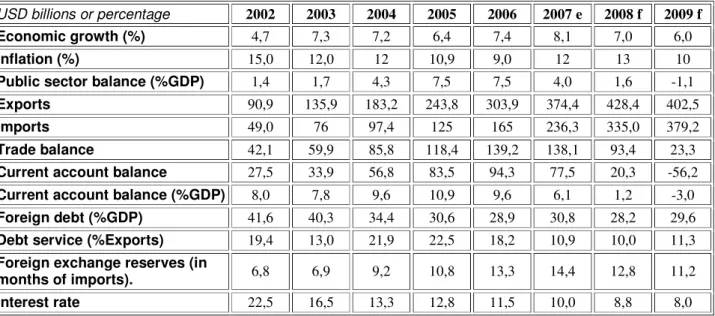
Average corporate default risk is expected in Russian Federation. Political and economic situation can be characterized as being uncertain. Economic growth has been persistently high during the recent years, and is expected to rise even further due to an increase in domestic consumption and investment, both domestic and foreign direct investment. The risk of liquidity crisis is low because of high foreign exchange reserves. On the other hand, inflation has been also high and is expected remain at this level (13% in 2008). Credit risk remains high mainly due to the lack of transparency. Business environment is expected to improve after the election of new president because of an associated more liberal trend, political liberty and campaign against corruption (International Country Risk Guide: Russia, 2006).
Rating Agency Country Risk History:
2002 2003 2004 2005 2006 2007
Fitch B+ BB- BB+ BBB- BBB BBB+
S&P B+ BB BB BB+ BBB BBB+
Moody’s B2 B1 Ba3 Ba1 Baa3 Baa2
Assets:
• Recent political stability enabled to increase Russia’s energy status; • Abundant natural resources and skilled labour;
• Large sovereign fund and relatively small foreign debt gives more political and
economic stability and power to sustain crises;
• Olympic Games in Sotchi in 2014 would imply large infrastructural development
projects and increase tourist attractiveness. Weaknesses:
26
• Governmental intervention and takeovers of private business can damage
country’s reputation for FDI and management incentives;
• Depletion of capital equipment negatively affects competitiveness of industries; • Investment rate remains one of the lowest among the major EMCs;
• Problems with inconsistency and implementations of reforms.
(International Country Risk Guide: Russia, 2006) Risk Assessment:
Source: www.seb.se
Graph: Russia’s risk profile looks strong on liquidity and macro balance – hard economic factors of medium term significance, but weaker on long-term factors, including resilience. Russia is also weaker on event risk, but slightly stronger on information, than average. According to SEB’s perception, the closest country for comparison could be Mexico in this case.
Table №6. Doing Business: Russia
Starting a business (rank) Procedures (number) Time (days)
Cost (%of income per capita) Minimum capital (% of income per capita) 65 8 29 2.6 2.2
Protecting investors (rank) Extent of disclosure index (0-10) Extent of director liability index (0-10)
Ease of shareholder suits index (0-10)
Strength of investor protection index (0-10) 88 6 2 7 5.0
Dealing with construction permits (rank)
Procedures (number) Time (days)
Cost (% of income per capita)
180
54 704 2612.7
Paying taxes (rank)
Payments (number per year) Time (hours per year) Total tax rate (% of profit)
134
22 448 48.7
27 Difficulty of hiring index (0-100)
Rigidity of hours index (0-100) Difficulty of firing index (0-100) Rigidity of employment index (0-100)
Firing costs (weeks of salary)
33 60 40 44 17
Documents to export (number) Time to export (days)
Cost to export (US$ per container) Documents to import (number) Time to import (days)
Cost to import (US$ per container) 8 36 2150 13 36 2150
Registering property (rank)
Procedures (number) Time (days)
Costs (% of the property value)
49
6 52 0.2
Enforcing contracts (rank) Procedures (number) Time (days) Cost (% of claim) 18 37 281 13.4
Getting credit (rank)
Strength of legal rights index (0-10) Depth of credit information index (0-6)
Public registry coverage (% of adults)
Private bureau coverage (% of adults) 109 3 4 0 10.0
Closing a business (rank) Time (years)
Cost (% of estate)
Recovery rate (cents on the dollar)
89
3.8 9 28.2
Source: combined data from Doing Business 2009 and 2008
3.1.6 Ukraine
Doing Business 2009 Ranking: 145 (144 in 2008)
A very uncertain political and economic environment which effects high possibility of corporate default and various problems of making business is typical for Ukraine. Economic growth has been relatively high until 2008. However, economic activity has slowed significantly in 2008 due to the fall in the price for metal, an increase in the imported price for gas, financial crisis and political instability. Inflation remains at a high level. Imports continue to grow that result in an increase in external account deficit (International Country Risk Guide: Ukraine, 2006).
Rating Agency Country Risk History:
2002 2003 2004 2005 2006 2007
Fitch B B+ B+ BB- BB- BB-
S&P B B B+ BB- BB- BB-
Moody’s B2 B1 B1 B1 B1 B1
Assets:
• Low cost skilled labour force;
• Possibility to benefit from gas transits from Russia to EU due to geographical
location in between;
28
• Low level of public debt limits sovereign risk.
Weaknesses:
• Inefficient energy-intensive industrial sector;
• Not diversified exports, concentrated mainly on metallurgical sector; • Economy is highly dependent on steel and gas prices;
• Unclear taxation system, bureaucracy, problems with law enforcement and
general inconsequence of political and economic development undermined business environment.
(International Country Risk Guide: Ukraine, 2006) Risk Assessment:
Source: www.seb.se
Graph: Ukraine shows no particular strength and is generally weaker on all factors, than average among EMCs.
Table №7. Doing Business: Ukraine
Starting a business (rank) Procedures (number) Time (days)
Cost (%of income per capita) Minimum capital (% of income per capita) 128 10 27 5.5 174.2
Protecting investors (rank) Extent of disclosure index (0-10) Extent of director liability index (0-10)
Ease of shareholder suits index (0-10)
Strength of investor protection index (0-10) 142 1 3 7 3.7
Dealing with construction permits (rank)
Procedures (number) Time (days)
Cost (% of income per capita)
179
30 471 1901.7
Paying taxes (rank)
Payments (number per year) Time (hours per year) Total tax rate (% of profit)
180
99 848 58.4
Employing workers (rank)
Difficulty of hiring index (0-100)
100
44
Trading across borders (rank)
Documents to export (number)
131
29 Rigidity of hours index (0-100)
Difficulty of firing index (0-100) Rigidity of employment index (0-100)
Firing costs (weeks of salary)
60 30 45 13
Time to export (days)
Cost to export (US$ per container) Documents to import (number) Time to import (days)
Cost to import (US$ per container) 31 1230
10 36 1250
Registering property (rank)
Procedures (number) Time (days)
Costs (% of the property value)
140
10 93 2.9
Enforcing contracts (rank) Procedures (number) Time (days) Cost (% of claim) 49 30 354 41.5
Getting credit (rank)
Strength of legal rights index (0-10) Depth of credit information index (0-6)
Public registry coverage (% of adults)
Private bureau coverage (% of adults) 28 9 3 0 3.0
Closing a business (rank) Time (years)
Cost (% of estate)
Recovery rate (cents on the dollar)
143
2.9 42 9.1
Source: combined data from Doing Business 2009 and 2008
3.2 Statistical Method and Results
The purpose of this part is to analyze the dependence of the country ratings made by the main rating agencies, such as Fitch, Standards & Poor’s and Moody’s on the main economic indicators. Issue ratings are an assessment of default risk, but may incorporate an assessment of relative seniority or ultimate recovery in the event of default.
Firstly, the Fitch International Long-term Credit Rating is considered. It is used as a benchmark measure of probability of default and is formally described as an Issuer Default Rating (IDR). Secondly, Standards & Poor’s Long-Term Issue Credit Rating is considered. It is based on the following considerations:
• Likelihood of payment—capacity and willingness of the obligor to meet its
financial commitment on an obligation in accordance with the terms of the obligation
• Nature of and provisions of the obligation
• Protection afforded by, and relative position of, the obligation in the event of
bankruptcy, reorganization, or other arrangement under the laws of bankruptcy and other laws affecting creditors' rights.
Source: Understanding Credit Ratings, Standard & Poor’s, 2002
The Fitch International Long-term Credit Rating and Standards & Poor’s Long-Term Issue Credit Rating use the same grading scale (see Appendix 2 and 3). Therefore, it is decided to assign the highest number to the highest possible rating for both those ratings in order to transform nominal data into ordinal data, so that D=0, RD=1, C=2, CC=3,