1 PAPER WITHIN Production Systems
AUTHOR: Ananthan Indukaladharan & Carolina Ames Zegarra JÖNKÖPING June 2021
Simulation of
Assembly cell
Simulation based evaluation of automation solutions in an
assembly cell.
2
agement. The work is a part of the Master of Science program. The authors take full responsibility for opinions, conclusions and findings presented.
Examiner: Gary Linneusson
Supervisor: Sagar Rao
Scope: 30 credits (second cycle)
3
Abstract
Purpose The primary purpose of the current thesis is to develop a virtual model using discrete event simulation (DES), which aims at support-ing the decision-maksupport-ing process regardsupport-ing automation solution pro-posals for SMEs.
Method The research approach is positivism, and it considers quantitative and empirical information. A literature search is conducted to gener-ate a base for obtaining the theory required for the current report to answer the research questions. This search included the trace of rel-evant and reviewed topics regarding automation, discrete event sim-ulation, and production lines. Then, a scenario simulation is designed and studied based on empiric knowledge and how automation would affect it, followed by a collection of information from the simulation iterations.
Findings & Analysis
Two scenarios are presented. One with a fully manually operated as-sembly line consisting of only human operators and a second sce-nario, a semi-automated assembly line that includes some robots in specific areas doing specific operations. The two scenarios are sim-ulated to check to what extend the KPI’s and parameters improved between each scenario. The experiment result concludes that by troducing automation elements in the production line, there is an in-crease in the overall efficiency, throughput rate, and a considerable gap against humans in WIP.
Conclusions and recom-mendations
The results obtained from the experimentation in discrete event sim-ulation software and study from previous research show that discrete event simulation has a significant contribution when considering a decision-making tool's role. Since it allows to understand and study the specific scenario by imitation and try different solutions in the same production system, it also allows studying several indicators from the scenarios to be checked to what extent they could be im-proved.
Delimitations The current thesis includes several delimitations. First, it focuses
only on an operational level. Also, this study consists of a specific type of product with many variants, and finally, there are only two scenarios studied: a fully manual scenario and a semi-automated sce-nario with the presence of robots.
4
Acknowledgment
We would like to appreciate the people who have supported and helped us during this master thesis. First of all, we would like to express our great gratitude to our supervisor Sagar Rao, a Ph.D. student at the School of Engineering in Jönköping. We are grateful for your constant support and attention with us, not only on the academic aspect but, also in the technological by allowing us to use a laptop to perform the simulation ex-periment in a better way.
We also want to thank Kerstin Johansen for letting us be part of this opportunity, and for considering us for presenting this topic for our master thesis. We appreciate your support and your attention when it comes to our inquiries or questions.
Lastly, we would also like to thank Gary Linneusson for being our examiner, especially for your relevant feedback during the presentation of our thesis progress, and your pos-itive perspective to improve our research and academic thoughts, as well.
5
Contents
List of Figure ... 7
List of Table ... 8
1
Introduction ... 9
1.1 BACKGROUND ... 9 1.2 PROBLEM DESCRIPTION ... 101.3 PURPOSE AND RESEARCH QUESTIONS ... 11
1.4 DELIMITATIONS ... 11 1.5 OUTLINE ... 12
2
Theoretical background ... 13
2.1 PRODUCTION SYSTEMS ... 13 2.1.1 System Disturbances ... 13 2.2 ASSEMBLY ... 14 2.3 AUTOMATION ... 14 2.3.1 Flexible automation ... 172.3.2 Material Handling Equipment (MHE) ... 17
2.3.3 Robots ... 18
2.4 SIMULATION ... 19
2.5 DISCRETE EVENT SIMULATION ... 20
2.6 PERFORMANCE INDICATORS ... 21
3
Method and implementation ... 23
3.1 RESEARCH APPROACH ... 23
3.2 RESEARCH DESIGN SCIENCE ... 23
3.3 DATA COLLECTION- SIMULATION AND MODELING ... 26
3.4 LITERATURE REVIEW ... 26
6
4
Findings and Analysis ... 29
4.1 SIMULATION MODEL SETUP ... 29
4.1.1 Scenario 1: Fully-manual operator model (FMOM) ... 31
4.1.2 Scenario 2: Robot and semi-automated model (RSAM) ... 34
4.2 EXPERIMENTS ... 36
4.3 RESULTS ANALYSIS ... 38
5
Discussion ... 43
5.1 DISCUSSION OF FINDINGS ... 43
5.1.1 Automation levels analysis through simulation model (RQ1) ... 43
5.1.2 How can discrete-event simulation be used in the decision-making process of the selection of an automation solution (RQ2) ... 45
5.2 DISCUSSION OF METHOD ... 47
6
Conclusions and Recommendations ... 49
7
References ... 51
8
Appendices ... 57
8.1 APPENDIX 1:INPUT PARAMETERS-MANUAL OPERATION ... 57
8.2 APPENDIX 2:INPUT PARAMETERS-ROBOT OPERATION ... 59
8.3 APPENDIX 3:TIMETABLE FOR THE OPERATORS ... 61
8.4 APPENDIX 4:ASSEMBLY TABLE ... 61
8.5 APPENDIX 5:UTILISATION OF WORK STATIONS FOR MANUAL OPERATION ... 62
8.6 APPENDIX 6:UTILISATION OF WORK STATIONS FOR COLLABORATION MODE OPERATION ... 62
7
List of Figure
Figure 1 . Transformation process. Adapted from Bellgran & Säfsten (2010) ... 13
Figure 2. Production system elements (Bellgran & Säfsten, 2010) ... 13
Figure 3. Three types of manual assembly lines related to product variety. Adapted from Groover (2015) ... 14
Figure 4. Components of an automated system. Adapted from (Groover, 1994) ... 15
Figure 5. Scale of Automation. Adapted from Wickens (1998) ... 15
Figure 6. Levels of automation adapted from Groover (2015) ... 16
Figure 7. Types of automation (Groover, 2008, p.26) ... 17
Figure 8. Design science framework adapted from (Hevner et al., 2004) ... 24
Figure 9. Project framework ... 25
Figure 10. Graphical representation of Simulation model (Dima, 2013) ... 26
Figure 11. Assembly operation schematic ... 30
Figure 12 Centrifugal pump assembly flow schematic ... 31
Figure 13. The fully-manual operator model (FMOM) ... 33
Figure 14 The robot and semi-automated model (RSAM) ... 35
Figure 15. Results of FMOM obtained from simulation iterations ... 37
Figure 16. Results of RSAM obtained from simulation iterations ... 37
Figure 17. Comparison Manual - Semi automated (Throughput) ... 38
Figure 19. Comparison Manual - Semi automated (Parts produced) ... 38
Figure 20. Comparison Manual – Semi automated (WIP) ... 39
Figure 21. Results of the FMOM scenario ... 40
8
List of Table
Table 1 Assembly operation parameters ... 29 Table 2 Impeller and casing variants considered for the simulation experiment ... 30 Table 3 Comparison between Human and Human-Robot scenarios – operational perspective ... 41 Table 4 Comparison between Human and Human-Robot scenarios – material
9
1
Introduction
This chapter provides a background for the study and the problem area of the study. Further, it presents the purpose and the research questions. Lastly, it describes the scope and delimitations of the study.
1.1 Background
Rapid adaptiveness and responsiveness to changes are key factors that companies, es-pecially small and medium-sized enterprises (SME) are currently taking into consider-ation to stay in markets (Onori & Barata Oliveira, 2010). There is currently a growing need for companies to implement modern technologies at a lower cost to improve dif-ferent aspects when it comes to manufacturing. For instance, mass production at low cost, flexibility to provide customized products, and, sustainability regarding perfor-mance, as well (Reichenbach & Kromoser, 2021). So, to pursue, and fulfil those pa-rameters, processes automation is an alternative that is more within reach of organiza-tions to become more modern, and improve their indicators through a large variety of tools, perspectives and state-of-the-art methods related to automation (O’Riordan et al., 2019). This also presents its requirements such as the improved process of the workers' skills, further development of better human skills, and progress related to the workplace layout (Krzywdzinski, 2017).
Industrial automation proposal enables companies to reach and change in a beneficial perspective their flexibility, functionality, productivity, and quality degree (Greasley, 2008). Also, recent developments in robotics have been highly considered into auto-mation to facilitate better production performance, efficiency improvement for pro-cesses, and easiness for employees when it comes to task execution (Hedelind & Jackson, 2011). Therefore, different European enterprises within the production indus-try are currently considering turning gradually into automated ones, for instance, the pharmaceutical industry (Coito et al., 2020), precast concrete production (Reichenbach & Kromoser, 2021) or, even the Swedish agriculture sector (Lunner-Kolstrup et al., 2018). This last type of manufacturing company is renovating its technologies to have enhancement concerned to productivity and employee performance (Lunner-Kolstrup et al., 2018).
Nevertheless, to implement an automated system within the company, it is necessary to know which kind of automation solution is required based on some different and rele-vant aspects to consider, such as the company's current conditions, which performance indicator to be considered, and economic factors. This is because, within each company, the manufacturing system is considered unique because of the difference in character-istics such as - specific situations, information systems, bottlenecks, and problems within the system. It is a topic that strongly relates to the system and its components (Aytug & Dogan, 1998). Also, each evaluation is data-driven in a particular system and it requires a tool that allows studying different complex scenarios and situations without compromising the actual system such as interrupting its regular and daily operations or avoiding any relevant failure or damage to the real system (Greasley, 2008).
10
Thanks to the breakthrough of technology, simulation is perceived as one of the main tools to study and analyze different scenarios and complex systems. Relevant decisions can be taken with the aid of simulation when it comes to performing modernizing, au-tomating, or updating changes in the system as it involves substantial economic deci-sions (Greasley, 2008).
By using simulation, it enables the companies to examine different cases and difficult scenarios, so that when it comes to modernizing the facilities, it makes the process eas-ier (Adams et al., 1999; Zhang et al., 2019). On the other hand, it is unknown to what extent simulation can be a support in a case of a mid-size production cell or for an SME when it comes to automation solutions. Likewise, while a simulation is carried out, it is strongly relevant to consider which key performance indicators (KPI) need to be taken into consideration for the decision-making process since it is a data-based decision and further, which can be the causes or effects that those KPI´s and other factors can pro-duce on the system itself (Lavy et al., 2014).
This thesis is a part of the Sustainable Automated Assembly for Customized Products (SABACE) project currently running at Jönköping University with industrial partners focus on addressing challenges related to sustainability and automation within assembly systems. This thesis aims to contribute a feasibility study in understanding simulation usage and how simulation can bring about a positive groupwork between operators and robots in a safe and ergonomic environment considering the productivity aspects. So, the project purpose fits with this current research project which is expected to bring relevant knowledge and proposals to solve the project and industry sector requirements.
1.2 Problem description
Manufacturing companies have always attempted to optimize and improve their opera-tions in their production systems. Also, to use modern and cutting edge technologies so that the transformation of the raw material performs successfully and optimally to have high quality and better final products (Bellgran & Säfsten, 2010). Furthermore, produc-tion systems do not work alone, they require assembly operaproduc-tions to put every compo-nents together, and get a finished item (Groover, 2015). So, a focus area to carry out improvements is the assembly area too where relevant indicators are studied.
Assembly operations represent a significant field of study for researchers and academia since it presents several types depending on the various level of the final product as Groover (2015) stated. Also, it involves considerable operations related to the material handling to perform an appropriate specific task such as loading, moving material, or equipment (Ray, 2008). Previously, assembly operations had been mainly performed by humans and, theories and frameworks have been formulated to generate positive data for the decision-making process concerning human aspects. Nevertheless, thanks to the breakthrough of technology and research, nowadays assembly can be also per-formed by robots. The introduction of robotics elements leads to the automation field to transform the assembly line, and other areas of the production system mechanized (Groover, 1994) and achieve better time measurements and quality standards, as well. According to Dorf & Kusiak (2007), automation technology supports operations by
11
providing a set of instructions and feedback so that operations can be done as similarly as humans. Also, automation is often implemented on tasks where there is no require-ment of a high skill level nor decision-making process to be performed (Kamali et al., 1982). However, the fact of knowing which operations or areas need to be automated is a current challenge that manufacturing companies deal with every day. One tool that can contribute to this type of decision in terms of automation is simulation.
Thus, simulation allows experimenting with different aspects, technologies in an imi-tation of the real world to obtain data that can be used to analyze and make the decision about the real scenario. This research will focus on discrete-event simulation since the occurrence of the event is on discrete timeslots and shows a high number of advantages in considering as a support tool for the decision-making process. For instance, it does not interrupt the real production system, economically accessible and it enables the con-trol of parameters and conditions (Banks, 1999; Robinson, 2014).
On the other hand, discrete-event simulation can be highly helpful in terms of condi-tions analysis, it should be also considered that every scenario and how automation would impact. Then, evaluation in terms of automation with the discrete-event simula-tion is data-driven and related to how a specific manufacturing system works together with its components (Aytug & Dogan, 1998). Hence, it is necessary to propose partic-ular models for different manufacturing systems according to their requirements and conditions. It is also required to provide adequate virtual models to assist the decision-making process regarding automation solution selection in the SME case.
1.3 Purpose and research questions
The ultimate purpose of the report is to see a virtual model by using discrete event simulation (DES) gives support to the decision-making process regarding automation solution proposals for SMEs. To reach the purpose of the current report, the following research questions were made to provide guidance and order towards the main target.
1. How can a simulation-based virtual model be used to analyze different automa-tion levels in a producautoma-tion cell?
a. What are the KPI’s and parameters provided by simulation?
b. What are the causes and effects of different automation solutions on the KPI’s?
2. How can discrete-event simulation be used in the decision-making process of the selection of an automation solution?
1.4 Delimitations
The analysis of the model was limited to the process level. Since the aspiration was to aid mid-size manufacturing segments, the study was carried out in a virtual production cell with size and volume limitations. The information regarding how the actual pro-duction cell would be working was provided by the interested parties of the SABACE project. The focus was also on cell-specific workstations to have a deeper understanding of experimentation, comparison, and analysis. Whereas a higher-level system perspec-tive, such as an entire production line or factory level, would make the project broad
12
and complex hence discarded from the scope. The study was limited to different sce-nario analyses as the primary focus was on simulation.
1.5 Outline
This current thesis report is divided into the following six chapters: Introduction, The-oretical Background, Methods and implementation, Findings and Analysis, Discussion and Conclusions and recommendations.
Chapter 1: Introduction. This chapter explains the background related to the topic of research. Then, it describes the problem to be solved. Also, the purpose and the research questions are presented. Finally, the limitations of this thesis report are stated.
Chapter 2: Theoretical background. Within the chapter, theory related to production systems, assembly lines, the automation topic, simulation and one of its types, discrete event simulation, and performance indicators. This current theoretical background pro-vides a generic and basic knowledge of the variety of topics that will be taken in the research project.
Chapter 3: Method and implementation. This chapter outlines the research approach and methodological tools used to collect data to answer the research questions, and define the topics to look for in the literature database for the report. Finally, the report is also evaluated in terms of reliability and validity.
Chapter 4: Findings and Analysis. This chapter includes the information collected through the tool selected on the scenario proposed. There is an explanation of the two scenarios provided, how the experiments were performed. Lastly, it contains the anal-ysis of these results considering the theoretical background checked.
Chapter 5: Discussion. This chapter presents, in the first place, a discussion of the method used for experimenting explained. This chapter also presents a discussion based on each research question independently.
Chapter 6: Conclusions and recommendations. Within this chapter, the conclusions made from the findings and the discussions are explained and depicted. Finally, general recommendations related to this current report are also given.
13
2
Theoretical background
This chapter gives the reader the required concepts, theory related to the different top-ics which will be referenced and to explain the development of the theory in this re-search project.
2.1 Production systems
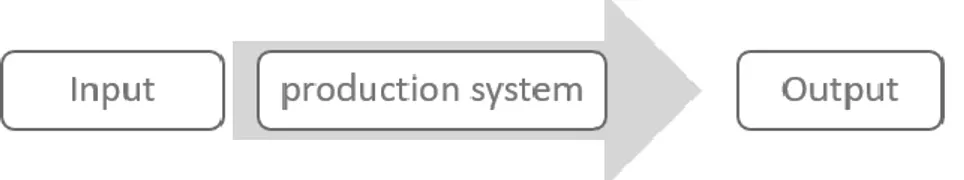
Production can be defined as a process that creates goods and services through a com-bination of material, work, and capital which can be anything from consumer goods to service goods. Figure 1 shows the function of the production system, which can be described as a transformation of input raw materials to the desired output product (Bellgran & Säfsten, 2010).
Figure 1 . Transformation process. Adapted from Bellgran & Säfsten (2010)
A structural perspective of the production system is provided by Löfgren (1983, as cited in Bellgran & Säfsten (2010)) which comprises of a number of elements between which there are repeating connections. These elements include man, machine, and equipment, see Figure 2.
Figure 2. Production system elements (Bellgran & Säfsten, 2010)
2.1.1 System Disturbances
Production systems are controlled by humans so, there are disturbances to take into consideration for the simulation model construction. Out of the numerous disturbance present, few topics which are relevant to this study are described below (Ignizio, 2009).
a) Fatigue: According to Thomas (1896) fatigue refers to “extreme tiredness
re-sulting from mental or physical exertion or illness”. Another definition that
Thomas (1896) state about fatigue is “weakness in mental or others materials
14
during the production system, there will also be fatigue involved. And, it also presents several different implications such as a capability reduced related to the individual strength, body control. These can affect the individual perfor-mance at work, productivity, final product quality, and a higher human error rate (Yung et al., 2014).
b) Breaks: periods used for operators to have rest, having food, or relax.
c) Corrective maintenance: reparation actions are performed when failures appear (Stenström et al., 2016).
d) Preventive maintenance: reparation actions are planned based on a schedule which can be provided by suppliers or guide instructions or previous knowledge to reduce the failure moments or to prolong the stability of the component (Stenström et al., 2016).
2.2 Assembly
According to Thomopoulos (2014), an assembly activity consists of different operations performed by a group of people to put several parts together into a bigger and complete product, and when this activity follows an order with a sequential parameter to have a finished good at the end, it is known as an assembly line.
Also, there are three types of assembly lines which will be named and briefly explained, as follows as Groover (2015) stated (See Figure 3).
• Single-model line: this presents only one product variant which shows high de-mand and quantities. The tasks required are the same during the entire produc-tion process.
• Batch-model line: This feature is used for more than one variant. The layout of this type is based on batches which consist of a specific setup of the workstations for each product.
• Mixed-model line: as the previous model, this is also used for more than one variant; however, the operations are performed on the same assembly line. This requires that all the workstations have the proper equipment to perform all the tasks required for the different product variants.
Figure 3. Three types of manual assembly lines related to product variety. Adapted from Groover (2015)
2.3 Automation
The origination of the word “automation” is accredited to Del Harder of Ford Motor company who suggested the use of automatic devices to control the mechanized pro-duction line (Groover, 1994). Britannica encyclopedia defines automation as the
“ap-plication of machines to tasks once performed by human beings or, increasingly, to tasks that would otherwise be impossible. Although the term mechanization is often used to refer to the simple replacement of human labour by machines, automation
15
generally implies the integration of machines into a self-governing system”(Groover,
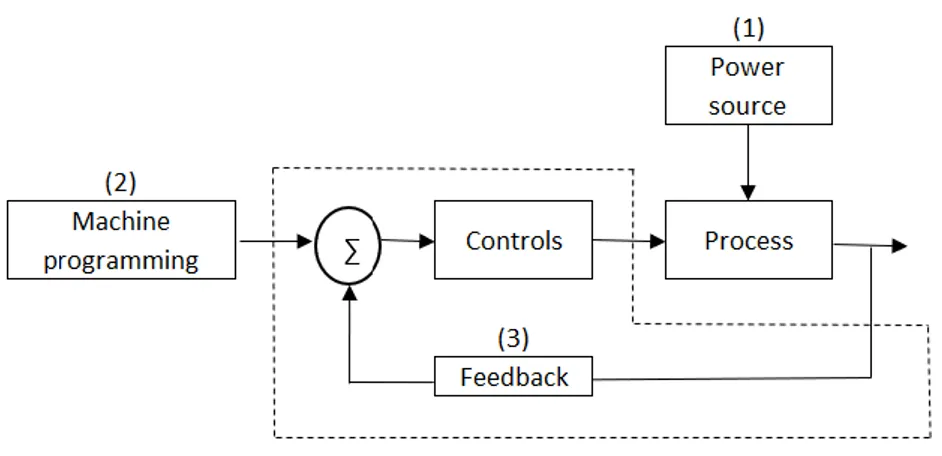
1999). In simple terms, it is a technology in which a process or a procedure is accom-plished with the aid of a set of instructions and a feedback loop control (Dorf & Kusiak, 2007). An automated system has three basic components namely, a power source to run the system, a program that operates the system without human intervention, and feed-back control to ensure the proper execution of the instructions. The arrangement of the system according to Groover is depicted in Figure 4.
Figure 4. Components of an automated system. Adapted from (Groover, 1994)
Another concise definition about automation by Kamali et al.,(1982) is “machine
per-forms tasks that do not require decision making” (p. 432). Figure 5 shows a general
level of automation scale. It varies from simple assistance by a computer to an artificial intelligence-based decision-making system with zero human intervention (Parasuraman et al., 2000).
Figure 5. Scale of Automation. Adapted from Wickens (1998)
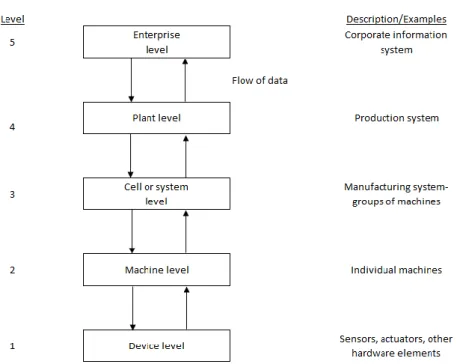
When looking at shop floor level and operations, one normally associates automation with individual machines on the shop floor. Even then the machines themselves are automated into subsystems (Groover, 2015). Groover depicts a hierarchy of five levels of automation (See Figure 6) namely device level, machine level, cell or system level, plant level, and enterprise level. This project focuses on the cell or system level of au-tomation since the project aims to access different solutions within a manufacturing cell.
16
Figure 6. Levels of automation adapted from Groover (2015)
When speaking of industrial production systems, in particular, cell-level automation refers to the operation of machines and workstations connected by material handling systems, computers, and other equipment required for the manufacturing process to happen and is controlled and operated by the instructions and requirements from the plant level (Groover, 2008).
Previously, automation is described within the context of operation and component level. Another way of classifying automation within the manufacturing industry is based on product quantity and variety as shown in Figure 7. The three main classifica-tions are fixed automation, programmable automation, and flexible automation (Groover, 2008). Since the study is more related to product mix within the mid-sized manufacturing segment the focus is on the flexible automation system in this project because flexible automation supports product mix with medium production rate and have higher flexibility in dealing with product design along with support for mass cus-tomization and sustainable production (Groover, 2015; Jovane et al., 2003).
17
Figure 7. Types of automation. Adapted from (Groover, 2008, p.26)
2.3.1 Flexible automation
Groover (2008) defines flexible automation as an evolution of programmable automa-tion capable to produce a product mix of a large variety with minimum losses. These days, the focus of manufacturing industries is on customized products and low-volume high variety variants. Also, product complexity and shorter product lifecycle posed a requirement to have a flexible arrangement in the manufacturing systems. Moreover, it is more intermeshed with domains of a cyber-physical production system and e-manu-facturing which aims to provide real-time data for decision-making (Wu et al., 2020). 2.3.2 Material Handling Equipment (MHE)
Material handling merely is loading, moving, and unloading and equipment. Based on the need, design, and requirement of various industries related to material handling equipment are as diversified as the manufacturing industry itself (Ray, 2008). In this study, we will be focusing on the following five types of material handling equipment (MHE), which are commonly used in the manufacturing industry in the present day.
• Industrial Trucks/Vehicles: These are the most common types of MHE used in industry when a load must be moved physically from one point to another, and the primary function is manoeuvring. It can be classified as powered and non-powered depending on the type of driving force used (Groover, 2008).
• Conveyers: Conveyors are mechanical apparatus used to move items within the facility. They are deployed when there is a requirement of moving bulk materi-als and large quantities between points and have a fixed path between these points. They can be powered and non-powered systems. There are different types of conveyors as follows: roller conveyors, skate wheel conveyors, belt conveyors, chain conveyors, overhead trolley conveyors, in-floor towline con-veyors, and cart-on track-type conveyors (Groover, 2008).
18
• Automated guided vehicles (AGV): AGV’s are material handling systems that are independently operated and self-propelled along a guided pathway. These are unobtrusive and move from various load points to various load points and are programmable according to the requirements. These are well suited for batch production and mixed model production (Groover, 2008).
• Hoist equipment: Hoist equipment is an apparatus used for raising and lowering loads. They are mainly used for the horizontal movement of materials with ver-tical lifting. Three different types of cranes are primarily deployed inside a fac-tory, a bridge crane, gantry crane, and jib crane (Groover, 2008).
• Robotic handling systems (RHS): A robotic material handling system is similar to other material handling systems, but the control and operation are carried out by a programmable and multifunctional device called a manipulator. A manip-ulator is a collection of mechanical linkages connected at joints to form a kine-matic chain of open loops. The main advantage of RHS is that it has increased uptime, consistent, productive, and work-round the clock when compared to manual material handling systems operated by humans (Ray, 2008).
2.3.3 Robots
The focus shift from mass production to mass customization has urged manufacturers to look out for have design and operational excellence to meet the increasing product variety (Hu et al., 2011). The introduction and application of robots is a relevant ad-vantage that companies want to achieve and sustain to become more competitive within each industry (Kinkel et al., 2015). Robots are now self-sustained with dedicated pro-cessing power, memory, sensors, and motors so that they are capable of handling com-plex and complicated tasks. Robots are now self-sustained with dedicated processing power, memory, sensors, and motors so that they are capable of handling complex and complicated tasks. Also, thanks to the breakthrough of robotics, speed has become eas-ier to be controlled and modified according to the requirements of the end user or to the task to perform in an environment not studied yet (Miura et al., 2006). Their high pay-load capacity, copious fixtures, and custom attachments, accuracy, and motion flexibil-ity allow them to carry out virtually any kind of operation or assembly process (Makino & Arai, 1994).
2.3.3.1 Human-Robot Collaboration (HRC)
Human-robot collaboration (hereafter HRC) is one of the key influencing factors of smart manufacturing strategy (Ghobakhloo, 2018). Goodrich & Schultz (2007) explain HRC as the field which studies the understanding, designing, and evaluation of robotic systems for use by or along with humans with communication and interaction between the two entities either remotely or at proximity. The researches and advancements are still rudimentary which is evident from the statistics released by the international fed-eration of robotics, which accounts for a marginal increase of around 12.5% in 2019 from the previous year regarding industrial deployment (Müller, 2020). HRI is consid-ered a solution to the challenges at the workstation level when considering factors such
19
as cognition, safety, ergonomics, productivity, and consistency (Ajoudani et al., 2018; Mateus et al., 2019).
2.4 Simulation
Simulation can be defined as an approach to study models which are defined to repre-sent an entity with a defined purpose. It is fundamentally experiential or experimental (White & Ingalls, 2016). Banks (1999) outlines simulation as an imitation of a real-world process or system over time and it involves the generation of an artificial history of the system and uses the generated data to infer the character of the real system that is represented. There are several simulation methods currently used in the industry, and they vary in their purpose and implementation strategy. Continuous system simulation, Monte Carlo simulation, discrete-event simulation (DES), hybrid simulation, and agent-based simulation all have their particular implementation strategies(Banks, 1999; Robinson, 2014; Shannon, 1992; White & Ingalls, 2016).
There are several advantages and disadvantages to using simulation in a study. Some of these advantages and disadvantages are described by Banks(1999) and Robinson( 2014). The advantages being:
• Cost: saving since experimenting with a real system is expensive. It is not a viable recommendation to interrupt a system on day to day basis to experiment with different scenarios.
• Time: saving since setting up a real system for experimenting takes time and experimenting with the same takes even more time. Depending on the size and number of processes involved it is more time-consuming for data collection and interpreting the data for generating the result.
• Control of condition: in a simulation model it is easy to control the variables that drive the simulation and an infinite number of experiments can be gener-ated in a shorter period. It helps in setting up the right variables in the right proportion to get the maximum output from the simulated model which is dif-ficult in a real system.
• Identify constraints: In a simulation model, it is practically easy to understand the constraints in the system such as the bottle neck operation or delay in the work in progress. The results from the simulation model can be used to diag-nose problems and understand the cause and effect of variable changes. Some of the disadvantages of using simulation model are:
• Simulation modelling can be time-consuming and expensive based on the fact that there should be dedicated resource allocation and the software does not come at a cheap price. In some cases, it even required external consultants pro-ficient in the software deployed to build the model.
• Most of the simulation models are data-hungry and it requires a significant amount of data which is sometimes not always available and requires extensive analysis to get the right amount of data.
• At times the simulation results are not easy to interpret since in most cases they are random variables it is difficult to determine whether the observation is a result of system interrelationships or due to randomness.
Researchers have used simulation as a key tool in their studies since the early 2000s. These previous studies varied on different key areas of the manufacturing system from
20
production planning to life cycle analysis like Košturiak & Gregor(1999); Mackulak et al. (1998), and Taj et al. (1998), for instance. Taj et al.,(1998) emphasize using simula-tion for producsimula-tion planning and control in producsimula-tion cells while Košturiak & Gregor (1999) studied the production life cycle using simulation and Mackulak et al. (1998) studied the effect of automated material handling models. Latest studies by Wickens et al. (2015) use simulation for studying imperfections in automation. Oppelt & Urbas (2014) use simulation for simulating virtual commissioning of plant activities and broadens simulation-based automation engineering. Steed (2019) studied the perfor-mance of alternative cell configurations using simulation. Likewise, in this project, we emphasize using discrete event simulation.
2.5 Discrete event simulation
Discrete event simulation (hereafter DES) in simple terms is a collection of techniques that, when applied to a discrete event-driven dynamic system, generates sequences that characterize its behaviour, which includes the mathematical relationships between var-ious elements, modelling the concepts highlighting the system features (Chong, 1994; Fishman, 2001). This may also include computer software that converts these relations to computer-executable codes and have procedures to convert these system data into estimates of system performance along with methods to assess how well these estimates are true (Fishman, 2001). The fundamental building blocks of DES are described by Dangerfield et al. (2014) are as follows:
Entities: individual items that flow through the system. In a manufacturing system, it is
the product that flows from one workstation to another.
Queues: areas where the entities wait to be worked upon. It can be a buffer location, a
store, or an inventory area.
Activities: the work or task is done on the entities.
Resources: those features required to operate the activities.
DES enables the user to explore the progression of operation through a system at an operational level where the individual interactions and, the variations experienced by the system over time are visible (Morgan et al., 2017).
DES has several applications which vary across different industries from manufactur-ing, healthcare, logistics, military application, business and finance, academia human resources, and energy segments service (Negahban & Smith, 2014; Skoogh et al., 2012; Turner et al., 2016). The applicability of discrete‐event simulation has been extensively growing in the analysis of production systems, due to the flexibility, realism, and pre-dictive accuracy offered by the simulation technique which no other quantitative meth-ods can provide (Chaharbaghi, 1990). Also, DES as a support tool has been discussed by several authors through different case studies (Dangerfield et al., 2014; Villagomez et al., 2019). Since the 1990’s several researchers had used simulation to study the op-erational performance of different industries and services. Advancement in the domain has reached a higher level of using virtual reality combined with DES to simulate real-time activities (Turner et al., 2016). Together with the advancement in technology, there
21
rises the complexity in handling a larger amount of data and requires automation for data handling (Skoogh et al., 2012).
2.6 Performance indicators
Performance measurement (PM) is a fundamental requirement for any industry to strive in the competitive world and Key performance indicators (KPI) are parameters that permit the evaluation (Ramis Ferrer et al., 2018). It is the fundamental principle of management because it presents the gap between the past and present and directs the management in decision making to achieve the desired performance (Weber & Thomas, 2005). It is a phenomenon that is not restricted to the shop floor level but extended to a multitude of the organizational level and their needs. With small and medium enter-prises (SME), PM´s focus is of much greater importance and sometimes precise due to its high level of competitiveness. The main reason for this specificity is the unavaila-bility of knowledge and resources that support them (Ramis Ferrer et al., 2018). The enterprise defines the sets of KPI’s that are required for organizational growth and performance improvement. There are different methods for selection that can be used to implement KPIs in an industry. These KPIs vary longitudinally within the organiza-tion from process level to organizaorganiza-tion level. Moreover, it is multiple-criteria regarding the decision-making problem since evaluation is based on multiple variables (Hwang et al., 2020). Several process level KPI’s such as setup time, takt time, availability, utilization efficiency, work in progress, production volume, inventory levels, time to failure, is used by several companies depending upon their manufacturing setup and organizational goals. Along with the above-mentioned performance indicators time-re-lated (delivery time/ total lead time) indices, quality-retime-re-lated indicators (rework and scrap) s are considered these days (Gelders et al., 1994; Kang et al., 2016).
Throughput: the account of work that is done, or the number of people that are dealt
with, in a particular time (Thomas, 1896).
Cycle time: the time required for assembling or processing one unit. It is established
using a stopwatch time study.
Takt time: it is the reciprocal of demand rate for a given product or part adjusted with
the time available for production in the factory.
𝑇𝑡 =𝑇𝑎
𝐷
Note- Tt = takt time, Ta = available production time without deducting any allowances, breakdowns, or other lost time, and D-Demand per day.
Mean Time Between Failure (MTBF)- It is the average length of time the equipment
runs between breakdowns.
Mean Time To Repair (MTTR)- It is the average time required to service the
22
Availability (A)- is defined as the proportion of time that the equipment is capable of
operating relative to the scheduled hours of production. A = MTBF-MTTR
𝑀𝑇𝐵𝐹
Utilization: It is the proportion of time that a productive resource is used relative to
the time available under the plant capacity (Groover, 2015). 𝑈𝑖 = ∑ 𝑓𝑖𝑗
𝑗
Note: Ui is the utilization of the machine, fij is the fraction of time during the available time, machine i process the part style j.
Overall Equipment Effectiveness (OEE): It is the time spent on producing goods of
approved quality for the scheduled time for production. It can be expressed by the equa-tion as below (Almström & Kinnander, 2011):
𝑂𝐸𝐸 = 𝑎𝑣𝑎𝑖𝑙𝑎𝑏𝑖𝑙𝑖𝑡𝑦 × 𝑝𝑒𝑟𝑓𝑜𝑟𝑚𝑎𝑛𝑐𝑒 𝑒𝑓𝑓𝑖𝑐𝑖𝑒𝑛𝑐𝑦 × 𝑞𝑢𝑎𝑙𝑖𝑡𝑦 𝑟𝑎𝑡𝑒
Performance efficiency is the product of cycle time and the number of products pro-duced over actual run time and quality rate being the ratio of accepted products over the products produced (Almström & Kinnander, 2011; Iannone & Elena, 2013; Nakajima, 1988).
23
3
Method and implementation
This chapter acquaints the reader with the methodology used for the current research work. In the first place, an explanation of the research approach is provided. Afterward, a description related to research design science is explained. Followed by, how the data was collected and the development of the simulation and modelling process is ex-plained. Furthermore, a literature review is featured to show how the theoretical liter-ature was obtained. Finally, the reliability and validity of this research are also stated.
3.1 Research approach
The philosophy selected for the current investigation was positivism thus, quantitative data and empiric knowledge would be used to obtain information about the research scenario (Williamson & Bow, 2002). Because this study would include a model con-struction and simulation, according to Williamson& Bow the quantitative information, researchers' experience, and objective perspectives would be in consideration to meas-ure the results to solve the hypothesis.
Then, when it came to the research approach, the study contemplated an abduction ap-proach which is a combination of deduction and induction apap-proaches according to Saunders (2016). An inductive approach was carried out in the model construction and findings section, since the information was collected after some iterations and, a theory review was done to analyze the results obtained. Also, the deductive approach was con-sidered in the analysis and conclusion sections thus, it enabled a deeper understanding of the results and, allowed in making conclusions from a general perspective to a par-ticular one which was the scenario studied.
The current investigation would give a general perspective regarding a single assembly operation so, the model construction and the simulation both was based on this general manufacturing context. The basic activities were considered in the model construction and, the simulation iterations provided results and data regarding them.
After running the simulation process, an analysis process of the data obtained was per-formed and, it led to a literature review. This review enabled to get a further and deeper understanding of the results and data from simulation and allowed to make better con-clusions from iteration results findings and the situation scenario regarding the model.
3.2 Research Design Science
Design science as defined by Hubka & Ernst Eder (1987, p. 124) “comprises a
collec-tion (a system) of logically connected knowledge in the area of design, and contains concepts of technical information and design methodology”.
It is fundamentally a problem-solving phenomenon, concerned with deriving infor-mation from the designer’s perspective from applied knowledge of natural sciences so that it addresses the problem of determining and classifying all circumstances of the system that is to be designed along with the design process (Hubka & Ernst Eder, 1987).
24
The main purpose of this kind of research method is utility since artifacts are designed, built, and evaluated to easily understand the current problem and to meet an actual re-quirement (Hevner et al., 2004).
There are three types of Design Science, that can be used for multiple purposes varying from designing a new system, producing a new system that never existed, or modifying an existing system for achieving a better result. The research goal sometimes is to pre-scribe a solution to an existing problem or get a direction to minimize the gap between theory and practicality (Dresch et al., 2015).
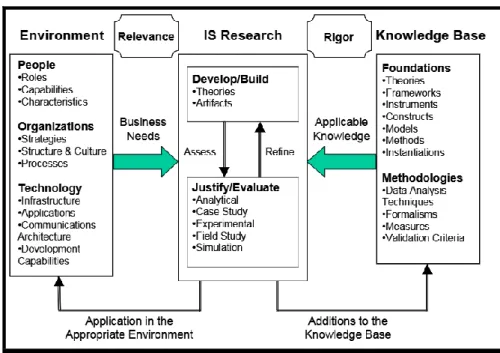
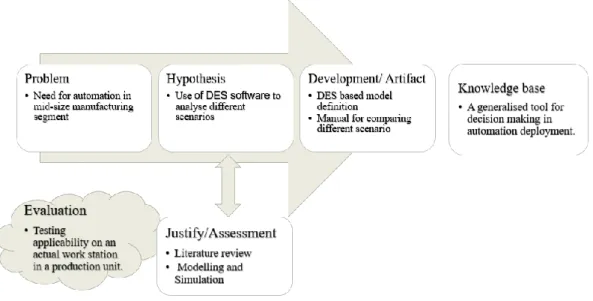
Also, Van Aken (2005) mentioned that the objective is more pragmatic in design sci-ence research thus, it is solution-oriented by using the results of descriptive research and supporting explanatory theories. Finally, it produces knowledge that can be used to find the solution to field problems. It helps in creating elements to serve human pur-poses by developing artifacts that aid in solving the problem and fulfil the needs along with opening new opportunities (Johannesson & Perjons, 2014; March & Smith, 1995). A conceptual framework for the design science research is in Figure 8, as it was pro-posed by Hevner et al.( 2004).
Figure 8. Design science framework adapted from (Hevner et al., 2004)
The environment is the problem space where the problem or the subject of interest re-sides which can vary from people within the organization to technology that is in use. The needs arise based on the organizational structure, the strategies, and the technology deployed. The requirements result in the problem. The design science approach results in the building of artifacts or theories that address the problem which is assessed, re-fined, and evaluated. Finally, they are deployed in the appropriate environment and added to the knowledge base (Hevner et al., 2004; Rossi et al., 2013).
25
The design science research process comprises several steps from problem identifica-tion to demonstraidentifica-tion (vom Brocke et al., 2020). Motivated from the framework of Hevner et al.(2004), this project followed a framework as depicted in Figure 9.
Figure 9. Project framework
The process began with the motivation which in this case was the requirement of auto-mation solution for mid-sized product segment in the manufacturing industry and the problem discovered was the lack of an evaluation tool that enables the SMEs to evaluate different possibilities between manual operations and automated solution.
The second step was defining the objectives for the solution. This was inferred from the problem statement and knowledge basis, in this case, the literature review to understand what was possible and feasible to address the problem (vom Brocke et al., 2020). In this project, the objective was to assess the different production scenarios within an assem-bly cell between manual assemassem-bly and automation. To perform this there was a need to development of a virtual assembly cell to analyze the production from a different per-spective.
The next step was the development of an artifact followed by a demonstration, in this case, it was intended to develop a simulation model of an assembly cell with the aid of simulation software to mimic the different scenarios and analyze them.
The final step was the evaluation and communication in which the evaluation phase measured to what extent the artifact supported the solution to the problem. This in-volved comparing the objectives of a solution to actual observations deduced from the use of the artifacts. The evaluation could be in any form depending on the circum-stances. The result was the decision to iterate the process to improve the effectiveness of the developed artifact or to stop and leave for further research (vom Brocke et al., 2020). In this project, the evaluation was carried out by running different case scenarios of the developed simulation model and generating empirical results to compare differ-ent performance factors. Moreover, it was intended to compare and justify the results from the findings with a literature review to validate the deductions and proposals.
26
Since the evaluation of the developed artifacts was important as it provided the feed-back for further development and forms the foundation for further research (Venable et al., 2016).
3.3 Data collection- simulation and modelling
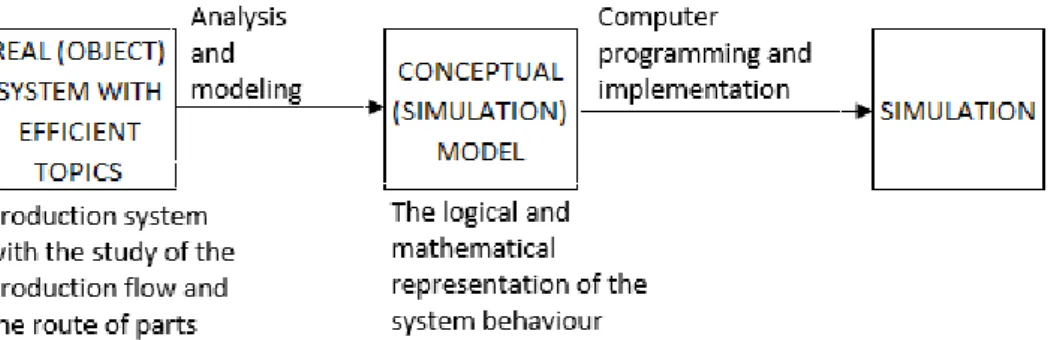
The simulation of an industrial production system has two components: modelling and simulation. The model of the production system is made up of objects and entities, and relations between these objects and entities. An object has fixed attributes that define the nature of objects and their nature such as dimensions, tools, costs, and performance parameters of the equipment, and variable attributes which involve time (Dima, 2013). A graphical representation of the simulation of the production system is described in Figure 10.
Figure 10. Graphical representation of Simulation model. Adapted from (Dima, 2013)
In this project, there is a simulation of an assembly operation of a typical centrifugal pump by using the Software called FACTS Analyzer. A detailed overview of the simu-lation setup is described in the following sections, and it allowed to analyze different scenarios with human and robotic perspectives. Since the aim is to have a deeper un-derstanding and analysis of the different perspectives of production at the cell level with different production scenarios, it was intended to have a simple assembly operation rather than a complex production system. It was understood that a complex production system introduces multiple variables which could perplex the analysis of the study. The model was then simulated with different scenarios and then analyzed to answer the re-search questions.
3.4 Literature review
In this project, it was intended to perform the literature review twice. There was a gen-eral literature review before the model construction and, the second one, after running the simulation iterations that indicated which areas the researchers should go through in a deeper way to understand better the data obtained. Both literature reviews were done through search tools as Primo Search which was provided by Jönköping Univer-sity, and databases as Emerald, Science Direct were taken into consideration because of a large variety of articles and manageable access from Jönköping University. The first literature search was based upon three main topics, automation, discrete-event simulation, and production. These were used to answer research question 1 and, to
27
provide a wider and more general perspective based on the first assumptions of the researchers and, they were also considered as the first stage of this current investigation. When it comes to the databases used, there was not a preferred one thus, the search was done through different databases to gather more information. However, regarding the type of sources, the most common were journal articles in scientific and technical fields and, books. When it comes to the source’s selection process, first the most relevant and
interesting titles were selected. Then, a smaller group of sources was obtained, a review of the abstracts was relevant to make narrower the group. Finally, an entire reading activity from the final group was performed to get a more detailed and complete view of the topic.
On the other hand, logic operators were used to carrying out the literature search process and, they were used as filters to make the search narrower and, to reduce the number of articles to review. These logic operators are based on the three first main topics and, synonyms are considered as well. The logic operators used in this current research are as follows:
• (Production process OR Manufacturing process) AND (Automation OR Auto-mation options OR AutoAuto-mation process)
• (Discrete-event simulation OR simulation)
• (Key performance indicators AND decision-making process) • (Simulation and production planning for manufacturing cells) • (Making decisions production investments)
• (Robot introduction production)
When it comes to the logic operators of production and automation, the selection of these operators was made based on the research question 1 since, it mainly focused on how automation collaborated in production areas and, how this existing relationship between them was handled since nowadays automation is a beneficial option for com-panies to improve their performance and productivity of production processes.
Then, the logic operator related to discrete-event simulation was chosen to cover more theory fields since it is involved in research question 1 to provide a tool to test the different scenarios of the assembly line selected and, to obtain results that were used to provide general ideas, analyze and conclude statements regarding a specific situation. Also, as it was said, this tool enabled to test many different scenarios without interrupt-ing real activities, how it could be implemented to the decision-makinterrupt-ing process and, it allowed to set different conditions and configurations to experiment and see how the system reacted.
To sum, regarding key performance indicators (KPI), these were mainly considered in research question 1, in a more technical aspect related to simulation experiment thus, the outcomes point towards which quantitative data must be highlighted. The infor-mation about this topic enabled us to understand which aspects should be focused on to solve the other research questions afterward.
28
3.5 Reliability and Validity
In their publication, Mackey and Gass (2016) state that it is relevant to consider validity and reliability when a quantitative study design is being performed. Since the current research will take into consideration simulation as an experimental tool, validity and reliability must be ensured. The conditions and the information provided for this inves-tigation give relevant background for a higher internal validity and, delimitations, as well. Then, DES will be used in this experiment stage since, based on the publication of Tako & Robinson (2010), this approach presents a linear progression when it comes to modelling topics. It also focuses highly on the model coding, verification, and vali-dation of its activities (Tako & Robinson, 2010). The results from the simulation itera-tions should also present a higher external validity to be considered as an overall view of an assembly area which can be applied as basics statements for companies.
Furthermore, after having run the simulation iterations, a theoretical review process will be done to check previous results and, to search for relevant and beneficial theory to be used to understand the outcomes from simulation. The theory will strengthen and sup-port reliability and external validity since, in this kind of situation, a laboratory experi-ment tends to depict a lower degree of external validity (Williamson & Bow, 2002).
29
4
Findings and Analysis
In this chapter, the experimental findings are presented and explained. First off, an explanation of how the two different simulation models were built and their character-istics. Then, the experiments carried out through the simulation software. Finally, an analysis of the experimental results to compare the models provided.
4.1 Simulation Model setup
In this section, a simulation model is described in which the current research project is carried out. The model comprised of a hypothetical assembly line that assembles a cen-trifugal pump. The manufacturing system selected was a mixed model line as it has soft varieties of products (Groover, 2015) (see figure 3). A centrifugal pump production scheme was selected since it included multiple variants and different variety aspects such as shape, dimension, and mass related to its variants and the requirement of flexi-bility in handling the different models in the same assembly line. The detailed specifics of the operation parameters are in Appendix 1 and 2.
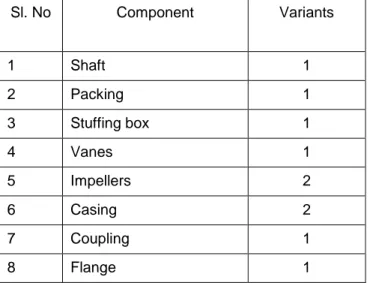
Table 1 shows the different ingoing components in the assembly process and a sche-matic representation of the categorization of the components are depicted in figure 11.
Table 1 Assembly operation parameters
Sl. No Component Variants 1 Shaft 1 2 Packing 1 3 Stuffing box 1 4 Vanes 1 5 Impellers 2 6 Casing 2 7 Coupling 1 8 Flange 1
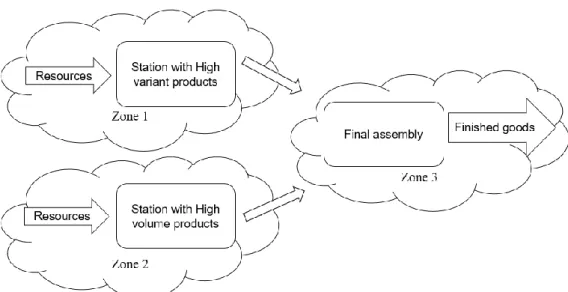
There are three zones in the assembly line since in this study, authors insist on incorpo-rating the effect of high product mix production and high-volume production. Zone 1 presents a production with product variance and low volume productions, zone 2 has high volume-low variant products and zone 3 combines the output of the previous sta-tions to the final product and transfers it to the finished goods area.
30
Figure 11. Assembly operation schematic
Coming to the specifics of the pump assembly, the assembly line presents four varieties of the pump (related to casings and impellers) which are mentioned in Table 2.
Table 2 Impeller and casing variants considered for the simulation experiment Variant
Single stage casing pump with open impeller Single stage casing pump with closed impeller Multistage casing pump with open impeller Multi stage casing pump with closed impeller
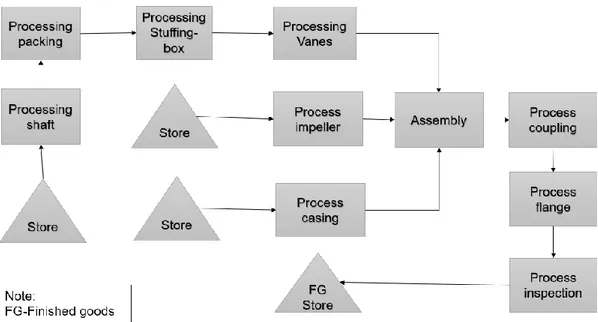
The schematic flow of the assembly process of the centrifugal is shown in Figure 12. The shaft flow constitutes the high-volume zone, impeller and casing constitute the product mix zone and the rest of the flow from the assembly are in zone 3.
31
Figure 12 Centrifugal pump assembly flow schematic
In this study, the quality indicator is assumed to have a fixed value that is 99% since the simulation software used for the current research does not provide support to con-sider rejects and reworks while simulating. For calculating the quality rate, one requires the defect rate, since these details are not available it is assumed that the production line follows a six-sigma quality program and has less than 3.4 defects per million parts pro-duced and focuses on a zero-defect goal.
As mentioned in the theory, a production system consists of different types of manu-facturing elements and machines in which the operations are carried out by either hu-man operators or robots (figure 2). Within which these operations can vary from simple material handling to assembly operations. In this project, two such cases are considered to address the research questions and the semi-automated case covers most aspects of the automation scale (figure 5) as discussed by Wickens (1998).
4.1.1 Scenario 1: Fully-manual operator model (FMOM)
Scenario 1 constructs a fully manual operator model (FMOM) using simulation soft-ware FACTS Analyzer (Figure 13). In this setup, humans perform the operations by eight operators and three material handlers. Material movement in this case is carried out using industrial trucks and conveyors.
The operations start from the material store for shafts (SRM_shaft). Then, an operator loads the components to the cart and delivers them to the work table. Parallelly, the raw materials for the impellers and casings (lower part of the middle section of Figure 13) are delivered to the respective stations manually from their respective stores.
The material moves through different operations in the shaft flow, which involve pack-ing, stuffing box, and vane addition. A buffer area (Buffer5) adjusts the movement to the assembly area. Similarly, the impellers and casings for all the variants are processed and stored in temporary stores for further assembly. A nameplate cart tracks the variants
32
in the assembly model, and this cart goes along with the three elements (shaft, impeller, and casing) through the remaining process.
The next step is the transfer of this cart to the assembly area (Assembler_1), where the three elements (shaft, impellers, and casing) are checked according to the assembly ta-ble (see Appendix 4). Then, the assemta-bled components move to a buffer (Buffer6), waiting to get palletized for further operations. In the next operation (pallet _assembly), the components get arranged to a pallet, then transferred to the following stations where the remaining elements get added. Finally, the product is inspected and transferred to the next operation.
An operator unloads the pallet to a disassembly station, where the pallets return to the pallet store. The product then moves to another buffer where an operator loads the prod-uct for finished goods storage (FG_STORE) at the rate of four pieces at a time. Finally, according to the demand, the products are delivered to the market.
33
34
4.1.2 Scenario 2: Robot and semi-automated model (RSAM)
In the second scenario, robot and semi-automated model (RSAM), specific tasks are automated or replaced with the automatic operation with robot assistance. There are five human operators and five robots working in the line. In the shaft line, a pick and place robot replace the manual material handler. It picks the part from the store and place it on a conveyor for further assembly and place the semi-finished goods at the end of the line to the buffer. The robot is a shared resource and moves between the opera-tions. In the casing and impeller line, which is entirely automatic in this scenario, robots carry out the operations. They perform a combined operation of picking and placing along with the processing of the variants. Finally, the two operations of fixing coupling and flanges in the post-assembly line are replaced by a robot in a combined workstation. (See Figure 14). The replacements are done for simpler operations that do not require a high degree of processing skills (Makino & Arai, 1994). When it comes to the attributes used for these robots, these are mainly processing skills since they are only performing activities in the production line without any repairing or setup functions. Skill level is maintained at level 1, which means they take the same process time as denoted in op-eration. The material movement in this scenario use conveyors and robotic handling systems and the remaining operations are the same as described in the previous sce-nario.
35
36
4.2 Experiments
For the experimentation section, the two scenarios FMOM and RSAM, will be analyzed and compared. The timetable for the assembly line setup is six working days per week. There are three shifts and consist of eight hours per day in each shift. The disturbances or system failure scenarios in the processes are mainly confined to human resources. Considerations are three rest pauses known as breaks (See Appendix 3 for detailed input parameters for the simulation model) along with other disturbances such as fatigue, idle time, absence, biological breaks as mentioned in the theory chapter.
When considering maintenance, corrective maintenance, also known as firefighting, is considered in the simulation model as shortstops since these do not take a long rectifi-cation time, and when they occur, they are addressed immediately to continue with the production process. When it comes to the second type of maintenance- preventive maintenance, it is not considered as a part of the simulation setup as it requires a pla-nification and a longer time for the implementation. This is compensated with an as-sumption that preventive maintenance is performed during weekend sessions without affecting the production processes. The assumption is that this regular preventive maintenance schedule addresses both major and minor failures with the equipment in the assembly line and robots in the second scenario.
The simulation horizon is set for a time frame of 365 days. However, the steady-state analysis (See Appendix 7) gives a warmup time of 52 days for getting a steady state. So, the practical result is considered for 313 days which excludes the warmup time. The results for the first scenario, FMOM, are shown in Figure 15.
37
Figure 15. Results of FMOM obtained from simulation iterations
The results for the second scenario, RSAM, are shown in Figure 16
38
Figure 18. Comparison Manual - Semi automated (Throughput) 4.3 Results analysis
In this section, the results obtained from the simulation experiment are analyzed, and the main factors, the most relevant findings, will be studied and will be used in the other section for the researchers' conclusions. This simulation study indicates the usage of two parameters-Overall Equipment Effectiveness and Utilisation when comparing the two assembly scenarios.
• Overall Equipment Effectiveness perspective
From the result, it is evident that there is a clear improvement in throughput using robot applications in the production process. Furthermore, the OEE of the system with robots works 8 percent better than the manually operated system. In addition, there is a rise in throughput, decrease in WIP and increase in the number of parts produced (See Figure 17, 18, and 19) when comparing the simulated data.
Figure 17. Comparison Manual - Semi-automated (Parts produced)
39
A detailed analysis of the results obtained in the utilization perspective with the two cases is explained in the subsequent sections.
• Utilisation perspective
Figure 20 represents the distribution of different time classification in a fully human scenario in FMOM, and the operation period for the simulation is 365 days, excluding the ramp-up phase of 52 days. The data represents a cumulative human resources per-formance working in the production cell as both operator and material handler. The overall working time is 28 percent of the total planned production time, while waiting time is the major shareholder by accounting for 29 percent. Comparing to the resource, waiting time includes setup time, machine holding time for delay in the arrival of job, idle time due to block in the successor operation, waiting for parts and resources, and disturbances defined in the process (See Appendix 1 and 2). The unplanned time of about 14 percent, in this case, denotes the plant shutdown during the weekends (the simulation is carried out for 24 hrs a day and for 365 days which includes weekends, and it is denoted as unplanned since there is no operation scheduled for the days). The considerations for disturbances are in Appendix 1 and 2. Other subdivisions include break time according to the timetable (Appendix 3) and the traveling time of the oper-ator between the stations.
40
Figure 20. Results of the FMOM scenario
The below figure shows the distribution on time specifics of the system in semi-auto-mated mode- RSAM case. In this scenario, working time is 26 percent, and waiting time is 44 percent with the respective scenario aspects mentioned in the previous case. In case of robotic operation, the programmed robots work in precise timing without any variation, including repetitive motion, transporting, and handling tasks, thus resulting in lesser variability, unlike humans. Whereas, in case of human operator the process time varies time to time due to several reasons and a triangular distribution is considered to account the variation. This has resulted in higher waiting time for the semiautomated scenario. There is zero failure from the robot side due to preventive maintenance sched-ules resulting in nil failure.