https://doi.org/10.47260/jesge/1118 Scientific Press International Limited
Geophysical Methods and their Applications in
Dam Safety Monitoring
Nasrat Adamo1, Nadhir Al-Ansari2, Varoujan Sissakian3, Jan Laue4 and Sven Knutsson5
Abstract
The use of geophysical methods in dam sites investigations and safety monitory has proved their good value and versatility in many earthfill dam sites as early as the 1920s. In the following years great development has occurred in the methods, application procedures and tools used. They may be considered today as good ways for carrying out observation tasks on existing dams in non-intrusive and much faster and cheaper ways than the traditional geotechnical methods. It is possible using them to discover anomalies in the dam body or its foundation at an early stage and allowing quick intervention repair works. These methods seek to register and present variations in the basic geotechnical material properties in dams such as; bulk density, moisture content, elasticity, mechanical properties of rocks, electrical resistivity and mineralogy and magnetic properties and so forth. Such variations can indicate increasing seepage flow, progression in cracks’ sizes, formation of voids, caverns and other instability manifestations. Depending on how any investigation is carried out and the targeted anomaly, there is now selection of these methods such as: Electromagnetic Profiling (EM), Electrical Resistivity Tomography (ERT), Self- Potential (SP), Ground Penetration Radar (GPR), variety of Seismic Methods (SM) which can be applied using such equipment as in Seismic refraction, Seismic Reflection, Multi Analysis of Rayleigh surface waves (MASW) instruments, or using Refraction Micrometer (ReMi), macro-gravity method, and Cross-Hole Seismic Tomography. In addition, Temperature Measurements and other less used methods can be used like Microgravity measurement, Magnetic Profiling and Radio
1 Consultant Dam Engineer, Sweden.
2 Lulea University of Technology, Lulea 971 87, Sweden.
3 Lecturer, University of Kurdistan Hewler and Private Consultant Geologist, Erbil. 4 Lulea University of Technology, Lulea 971 87, Sweden.
5 Lulea University of Technology, Lulea 971 87, Sweden.
Article Info: Received: September 7, 2020. Revised: September 17, 2020.
Magnetotelluric methods. An attempt is made here to cover the details of these methods, their advantages and limitations and to prove their usefulness in many dam sites all over the world. One observed issue is their adaptability to embankment dams more than to concrete dams and their popularity for checking seepage related problems and material changes within dam bodies and their foundations such as formation of voids and sinkholes.
Keywords: Geophysical methods, Geotechnique, Electromagnetic Profiling,
Electrical Resistivity Tomography (ERT), Self-Potential, Ground Penetration Radar, Seismic Refraction, Seismic Reflection, Rayleigh Multi Analysis of Surface Waves, Refraction Micrometer, Cross-Hole Seismic Tomography, Refraction Micrometer.
1. Introduction
Geophysical methods have the potential to offer a comprehensive and cost-effective way of assessing the performance of dams and dikes non-intrusively that is complementary to other surveying techniques and can be applied across large areas of sub-surface. There is a clear need for detailed assessment of embankment dams and dikes in terms of their internal structuring and integrity. While the vast majority of dam inspections, whether visual or instrumental, consists of checking for external indicators that an issue exists within the dam or dike such as cracking, movements or increased seepage flow, these geotechnical forms of assessments may not identify an issue that is driven by internal processes until they are in progression. More detailed studies are sometimes carried out in the form of geotechnical investigation, but geotechnical methods are intrusive and costly when used over an entire site. It is interesting to see nowadays that geophysical methods play an increasing and important role in many dams and dikes’ projects in the world in the same ways as other geotechnical investigation methods. In both geotechnical and geophysical methods, the objectives under consideration are the same, as both aim towards characterizing the soil, rock and groundwater at dam potential sites and examination of anomalies in existing dams. The targeted mechanical properties of soil and rock in both types of investigation are; shear modulus, bulk density, porosity, as well as the lithology and patterns of fracturing and weathering, in addition to fracture orientation, depth to bedrock, and fault location. Some geophysical methods, however, are superior to other geotechnical methods in that they can still be used to observe water seepage flow and formation of voids or sinkholes and can offer this at a much cheaper cost. These methods range between techniques such as Electromagnetic Profiling, Electrical Resistivity Tomography, Ground Penetrating Radar, Seismic Methods Profiling, Seismic Methods, Temperature Measurements and others. The selection of any one or combination of number of them to be used in one site depends on many factors which will be discussed later, but it may be said that all these methods are well established now for these applications and there are many other techniques gaining in popularity.
including water supply, irrigation and flood control. In embankment dams, the embankment is usually constructed with different materials including earth materials (soils), rock boulders and concrete. The embankment resists the hydrostatic forces of water in the reservoir and in the majority of cases must contain a section or zone impervious enough to prevent excessive seepage. Thousands of such dams have been built all over the world with various shapes and materials configurations and on different foundations. Geophysical methods have found their applications in different situations in these dams and they have been used to evaluate post-construction changes within and beneath dam embankments.
2. Historical Development of Geophysical Methods and their
Application to Dams
Electrical geophysical methods were the first of such methods in the field of dams. Electrical prospecting has grown from Fox's investigations of natural earth currents in 1830, through Schlumberger's successful use of applied direct currents, to a diversified art employing both alternating currents and electromagnetic fields, as well as direct currents. Early resistivity data were interpreted by empirical methods, which are still used widely. Other interpretative methods include direct interpretation by transforming the resistivity data into geologic information using mathematical transformation formulas [1].
Logical and mathematical interpretation of resistivity data application of engineering geophysics for investigations was recognized as early as 1928, when Crosby and Leonardon (1928) applied electrical methods successfully to map bedrock topography at a proposed dam site on the upper Connecticut River in what was apparently the first engineering application of these methods in the United States. The bedrock consisted of a high-resistivity Precambrian schist overlain by about 150 feet of glacial drift; the resistivity contrast was about 10:1. The Schlumberger method of taking a vertical profile about a single electrode was used. Of the results of the measurements at eight holes where tests were made prior to the full-scale survey, five gave accurate depths within 5 percent and the others were within 20 percent [2].
Electrical resistivity profiling method defines the distance between the voltages probes as (a), and the distances from voltage probes and currents probes as (c), while the depth of penetration of the probe is (b) (refer Figure 1). Then using the Schlumberger method, if (b) is small compared to a and c, and c>2a, then the apparent soil resistivity value can be calculated. Equation and method of calculation are given in reference [3], and this is further discussed in the following paragraph 4.
Figure 1: Diagram showing Schlumberger set up for electric resistivity measurement [3].
Following 1928, geophysical methods became part of the investigation programs for potential dam sites, but further growing of geophysical applications on existing dams mainly focuses on the operation phase after the dam is complete.
Dams are massive structures and their internal hydraulic conditions may require attention before problems are detected by simple reconnaissance methods, visual inspections and instrumental monitoring. These methods do not provide information on the dynamics of what is happening inside the dam, and the discrete monitoring instruments provide engineering parameters with limited spatial coverage of the dam. There is now, therefore, a growing demand for the non-destructive geophysical techniques to internally image the dam for early detection of anomalous phenomena and facilitating early remedial actions.
Geophysical techniques, such as time domain reflectometry, travel time velocity tomography, electrical resistivity tomography, and multi-station analysis of surface wave, have advanced significantly in the last few decades and application of these methods on dams have become of great interests to engineers. A better understanding of the connections between geophysical results and engineering significance related to dam safety and sustainability can help engineers gain more useful information when employing these technologies.
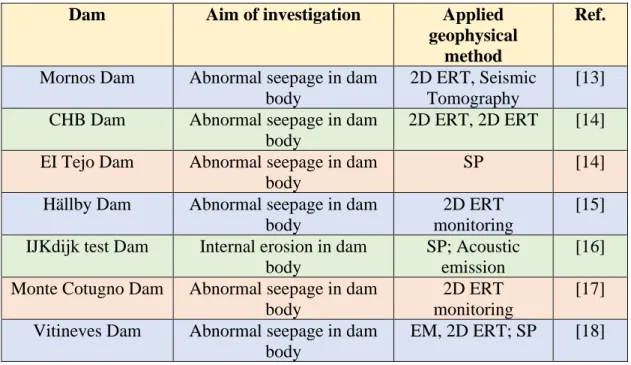
In a recent article (2018) limited number of cases from Asia, America, and Europe were gathered and listed in Tables 1, 2 and 3 respectively [2]. The details of each case may be obtained from the reference given in the last column of the tables. These tables are not comprehensive as many other case studies do exist and more of them can be found all over the world which are either not discussed in the relevant conferences and workshops or their reports are not published. These tables, however, are intended to show the application trend nowadays, and major problems to which
geophysical methods can be applied. Among these cases, it can be seen that abnormal seepages in earth dams draw most of the attention of geophysical groups. Internal erosion is the top safety concern in earth dams, and abnormal seepage is the observable symptom of it. However, depending on the source and seepage path, not all the abnormal seepages result in internal erosion.
Electrical methods such as electrical profiling, electrical resistivity tomography (ERT), and self-potential (SP) method have been recognized as water-sensitive technologies and used to investigate the spatial distribution of wetted area and possible flowing paths.
Self-potential or spontaneous potential (SP) is a naturally occurring electric potential difference in the Earth which can be one of different electrical potentials: i) Electro-kinetic, or streaming, potential, due to the flow of a fluid with certain electrical properties passing through a pipe or porous medium with different electrical properties.
ii) Liquid-junction, or diffusion, potential caused by the displacement of ionic solutions of dissimilar concentrations.
iii) Mineralization, or electrolytic contact potential produced at the surface of a conductor in contact with another medium, and,
iv) Nernst potential which occurs when similar conductors have a solution of differing concentrations about them.
The other major application of the geophysical methods other than seepage is the investigation of cracks or voids in dams’ foundations or bodies. Cracks and/or voids in dams create preferential flowing paths susceptible to further erosion evolution. Other developed methods such as Ground Penetrating Radar (GPR) and seismic tomography (ST) have gradually become are popular technologies for such purpose. If the voids or cracks are close to the surface, GPR may be an effective tool to quickly map their locations and depths. On the other hand, if the voids or cracks are too deep then Self-Potential (SP) is a good alternative since it is difficult to detect small voids or cracks by seismic methods. The concept of applying ST here is not to directly locate them, but to search for low velocity anomalies caused by the diffraction around the voids or cracks. The diffraction would increase the ray path and hence reduce the estimated velocity.
It may be said that current geophysical techniques used in embankment dams and levees are generally sensitive to the distribution of the bulk “geophysical” properties (elasticity, electrical resistivity, dielectric constant, density, etc.) in the subsurface that are in turn related to more “basic” properties (bulk density, water content, porosity, mineralogy, etc.). All these methods are used by engineers, including the USACE and other dams’ owners for various geophysical assessment of dams and levees [19].
In summary, it may be said that available literature on the geophysical applications indicates an increasing trend during the past few decades in using geophysical techniques and especially for dams’ safety investigations.
Table 1: Case studies of applying geophysical methods for safety assessments of dams in Asia.
Dam Aim of investigation Applied geophysical
method
Country
Shuishe Dam Abnormal seepage in downstream shell
2D & 3D ERT Taiwan Taiwan Power
Co. Files Hsinshan Dam Abnormal seepage in
downstream shell
Time-lapse 2D ERT Lin
Taiwan Wushantou Dam Slips of slope in downstream
shell
MASW Taiwan
Shigang Dam Strength of concretes after chichi earthquake
Seismic tomography Taiwan
Xishi Dam Aging concrete Seismic tomography Taiwan
Sandong Dam Abnormal seepage in dam abutment
2D ERT; SP China
Unknown Dam in Korea Abnormal seepage in downstream shell
2D ERT Cho and Yeom (2007)
Ref. [4] Afamia B Dam Abnormal seepage in dam
foundation
EM; Electrical profiling; 2D ERT
Syria [5] Som-Kamla-Amba Dam Abnormal seepage in
downstream shell
SP; Electrical profiling
India
Nanshui Dam Voids inside dam body GPR China
Sanqingting Dam Cracks in dam body GPR China
Ribeiradio dam, Characterization and treatment evaluation of dam
rock mass foundation
Time-lapse crosshole seismic tomography
Portugal Ref.[6] Akdeğirmen Dam Abnormal seepage in
downstream shell
2D ERT Turkey
Table 2: Case studies of applying geophysical methods for safety assessments in American dams.
Dam Aim of investigation Applied
geophysical method
Ref.
Dana Lake Dam Abnormal seepage in dam body SP; electrical profiling
[8] Amistad Dam Abnormal seepage in dam
foundation
2D ERT [9]
Barker Dam Voids in dam body and seepage SP GP [10] Avon Dam Abnormal seepage in downstream
toe
SP; 2D ERT GP [11] Cordeirópolis
Dam
Abnormal seepage in dam body 2D ERT [12]
Table 3: Case studies of applying geophysical methods for safety assessments in European dams.
Dam Aim of investigation Applied
geophysical method
Ref.
Mornos Dam Abnormal seepage in dam body
2D ERT, Seismic Tomography
[13] CHB Dam Abnormal seepage in dam
body
2D ERT, 2D ERT [14] EI Tejo Dam Abnormal seepage in dam
body
SP [14]
Hällby Dam Abnormal seepage in dam body
2D ERT monitoring
[15] IJKdijk test Dam Internal erosion in dam
body
SP; Acoustic emission
[16] Monte Cotugno Dam Abnormal seepage in dam
body
2D ERT monitoring
[17] Vitineves Dam Abnormal seepage in dam
body
3. Monitoring Seepage in Earthfill Dams
Dam failures world record shows that many major earth dam failures are due to seepages. Seepage quantity if within the design limits, and if its quality does not indicate internal erosion progression, then the stability of an embankment dam is not threatened, but continuous excessive seepage of turbid water will eventually lead to dam failure. The combined Electrical Resistivity Tomography (ERT) results and geotechnical monitoring data can give good indicators of likely mechanism for abnormal seepages. Most of the available seepage geotechnical monitoring instrument systems are insensitive to small changes in the seepage flow, however, the non-intrusive geophysical techniques have been on high demand to facilitate early detection or diagnosis of anomalous seepage occurrences. The ERT results may be combined with geotechnical data to clearly indicate the seemly mechanism of abnormal seepage.
Seepage anomalies observation can be enhanced in its progression by time-lapse measurement. In many cases the (2D) electrical resistivity tomography was used to image suspected seepage channels in an earth dam. This method was used to diagnose variations in the water content amount in dams, whether it was result of an anomalous seepage at the subsurface or, mere seasonal effect. Various zones of relatively uniform resistivity values were mapped and identified from the interpreted acquired data. The results revealed that the rather low resistivity zones within the bedrock represent probable pathways for seepages. Hence, geophysical methods have been successfully used to detect and map the seepage pathways within the bedrock of earth dam foundations.
Al-Fares (2011) carried out surveys involving various geophysical methods such as the superficial electromagnetic (EM) method, electrical sounding and ERT to identify and discern the cause of the water losses problem in the Afamia B dam located at Al-Ghab basin in Syria. He noted that the ERT technique was more effective and convenient to detect water infiltration problems and leakages through the bedrocks. The integrated results of the methods revealed some geological structures that have adverse effect which may eventually lead to leakages in the dam foundation. The vertical infiltration in the dam was later detected as the principal cause for the seepage problem. His final conclusions from the revealed results were: i) The presence of some geological structures which have negative role and led to essential leakage in the dam,
ii) The ERT was an efficient technique in outlining detailed subsurface geological features such as fractures or faults; this technique has succeeded in detecting some underlying anomalies which has been confirmed by excavating a trench and that, and
iii) The vertical infiltration constitutes the principle cause for the seepage problem in the dam itself [20].
Monitoring of seepages around embankment dams is very important in civil engineering hydraulic structures. Generally, the effects of seepage on dams are functions of soil water retention capability which is a vital factor in engineering geology. Geological mapping and field investigations for dam projects should delineate soil properties and rock formations that could cause seepage failures, and an in-depth study of the geological and geotechnical properties of these materials should be carried out. A combination of EM, ERT and other tools such as SP, have proven to give quantitative and qualitative interpretation of seepage flow. Performing resistivity and self-potential profiles along several lines across the dam permits obtaining a quasi-three dimensional view of the seepage pattern [21]. It has been concluded from many study cases that different geophysical methods can supplement each other in characterizing and identifying subsurface seepage areas as they relate to the bedrock fracturing, culturally emplaced drainages, and variations in soil type.
Geophysical methods have been proven to detect, map, and monitor seepage areas within earthen embankments. Ideally, investigations should include more than one method and then the results should be tied into existing borehole data to provide the best seepage characterization results. Geological data from the boreholes give a context to data interpretation by defining what geologic features are possible or likely [22].
Lastly, it may be said that geophysicists and civil engineers should work hand in hand in order to build and maintain dam structures to avoid the damage and waste of resources that may eventually result in the project if done otherwise.
4. Principles of Electric Resistivity Method
Electrical resistivity imaging is a widely used tool in near surface geophysical surveys for investigation of various geological, environmental and engineering problems including landslide and earthfill dams and levees.
The relevance of electrical surveys is to identify the subsurface resistivity distribution by making measurements on the ground surface. The true resistivity of the subsurface can be quantified from these measurements. The electrical resistivity is related to various geological parameters such as the mineral and fluid content, porosity and degree of water saturation in the rock or within a fill dam. Electrical resistivity surveys have been used for many decades in hydrogeological, mining and geotechnical investigations of engineering structures. More recently, it has been used for environmental surveys and for dam safety monitoring.
As already explained in the previous Paragraph (2), resistivity measurements are normally made by injecting an electric current into the ground through two electrodes (C1 and C2), and measuring the resulting voltage difference at two potential electrodes (P1 and P2). From the current (I) and voltage (V) values, the resistivity (pa) value is calculated as given below,
where (k) is the geometric factor which depends on the arrangement of the four electrodes.
Resistivity is defined as R = V/I, so in practice the apparent resistivity value is calculated by
ρα= k R
The calculated resistivity value is not the true resistivity of the subsurface, but an “apparent” value which is the resistivity of a homogeneous ground which will give the same resistance value for the same electrode arrangement. The relationship between the “apparent” resistivity and the “true” resistivity is a complex relationship and inversion of the measured apparent resistivity values can be made by mathematical equations which has been facilitated lately by using computer programs.
The resistivity method has its origin in the 1920’s due to the work of the Schlumberger brothers and Wenner, and for approximately the next 60 years it was used for quantitative interpretation, with conventional sounding surveys.
In this method, the center point of the electrode array remains fixed, but the spacing between the electrodes is increased to obtain more information about the deeper sections of the subsurface. The resistivity method measures the apparent resistivity of the subsurface, including effects of any or all of the following: soil type, bedrock fractures, contaminants, and ground water. A change in electrical resistivity may suggest changes in composition, layer thickness, presence of voids, presence of seepage or pollution levels, and such measurements are also useful for detecting lateral and vertical changes in subsurface electrical properties at the same time. Electrical resistivity imaging is therefore, a geophysical prospecting technique designed for the investigation of areas of complex composition or geology; this involves measuring a series of resistivity profiles by changing the spacing’s between the electrodes. Since increasing separation between electrodes provides information from increasingly greater depths, the measured apparent resistivity can be processed to provide an image of true resistivity against depth.
The principal applications of this technique are; definition of aquifer boundaries, mapping bedrock configurations, identifying faults and fractures, locating karstic voids in the ground, and in embankment dams, the identification of seepage paths and other material change anomalies.
Majority of rock and soil minerals are not good electrical conductors although some native metals and graphite conduct electricity well. The measured resistivities in earth materials are mainly controlled by the movement of charged ions in pore fluids. Even though water itself is not a good conductor of electricity, ground or seepage water in most cases contains dissolved compounds that greatly improve its ability to conduct electricity. Hence, porosity and fluid saturation tend to dominate electrical resistivity measurements. Cracking and voids within crystalline rock or earthfill dam body can lead to low resistivities if they are filled with fluids. Resistivity values of the various earth materials are shown in Table 4 [23]. A more representative form of these values is given in the diagram in Figure 2 available
from references [24, 25]. In this diagram the resistivity of soils and rock are shown to vary over a very wide range of differences, where these differences form the basis of resistivity surveying. Moreover, it is essential to be aware of the large overlaps in the resistivity values of different types of earth materials. As a result, measured resistivity should never be interpreted directly as a certain material category without additional knowledge of the specific situation.
Table 4: Electrical Resistivity values for different types of soils [23].
Type of Soil Mean value of Resistivity in Ωm
Swampy soil, bogs 1- 10
Silt alluvium 20 100
Humus, Leaf mould 10- 50
Peat, turf 5- 100
Soft clay 50
Marl and compacted clay 100- 200
Jurassic marl 30- 40
Clayey sand 50- 500
Siliceous sand 200- 300
Stoney ground 1,500- 3,000
Grass-covered – stony -sub-soil 300- 500
Chalky soil 100- 300
Limestone 1000- 5000
Fissured limestone 500- 1000
Schist, shale 50- 300
Mica, schist 800
Granite and sandstone 1,500- 10,000
Modified granite and sandstones 100- 600
Fertile soil, compacted damp fill 50
Arid soil. Gravel, uncompacted non- uniform fill
500 Stoney soil. Bare, dry sand , fissured rocks 3,000
The conduction process of electrical current in geological materials is mainly electrolytic, and most of the common soil and rock forming minerals are insulators in the dry state. It is therefore logical to say that the amount, the distribution and properties of water present largely determine the resistivity of any soil or rock mass. For rock mass this means that fractures, faults and shear zones constitute the dominating pathways for electrical current, whereas the solid rock normally is considered as an electric insulator. An exception is rock with metallic cement that may allow significant conduction through crystalline structure.
Soils on the other hand, are porous media consisting of solid skeleton of particles, or grains, with pores in between. The grains are considered electrical insulators and
the conduction is concentrated in the pore spaces that are typically filled or partly filled with water. Therefore, the resistivity of soils is strongly influenced by the amount of the present water, which in its turn is determined by the porosity and the degree of saturation; a property utilized in visualizing seepage flow in earthen dams and their foundations, in addition to recognizing signs of internal erosion.
Figure 2: Resistivity (and its inversion, conductivity) of the main earth materials (Palacky, 1991) [25].
In embankment dams and dikes the main aim of resistivity measurement is to verify their safety and integrity. This is done by detecting potential weaknesses, such as defective zones, anomalous seepages or internal erosion process. In such investigations, resistivity profiling and/or resistivity soundings have been commonly performed but in recent years 2D and 3D approaches have been applied. In most dam investigations the resistivity method has been used together with various other geophysical methods, which emphasize the importance of integrated multiple- method programs and also suggest the possible use of a monitoring strategy, where geophysical anomalies detected as a function of time can be correlated with reservoir water level.
Repeated and regular measurements on embankments over time have been performed in some cases as a way of continuous safety surveillance. One example
for such case can be cited from the Swedish research program that was carried out for resistivity monitoring of Hälsby embankment dam by daily measurements in which daily measurements commenced in 1996 and five years later, in 2011, measurements were started on a second dam; the Sädva Dam [26].
Dam geometry considerations and reservoir water level variations can bring certain complications in dams’ resistivity values interpretation when such measurements are made for checking the integrity of such dams, or for detecting anomalous seepage in the dam body or its foundations. Considerable research over the use of (2D) or (3D) resistivity surveying and sources of errors in these procedures has been conducted to solve such complications.
5. Suitability and Limitations of Geophysical Techniques
Commonly used geophysical methods in dam safety surveillance studies can be one or combination of many of the techniques already mentioned in the previous paragraph, i.e. Electromagnetic Profiling, Electrical Resistivity Tomography, Ground Penetrating Radar Profiling, Seismic Methods, Self-Potential Methods, Temperature Measurements and others. Selection of any one of these techniques depends on;
i. The orientation and objectives of the required study and the anomaly under consideration, whether seepage flow intensity, seepage path location, occurrence of internal erosion, formation of cavities and sinkholes, variation in material strength and so on.
ii. The environment surrounding study site and possibility of interference or attenuation by various external sources. Rural and coastal areas typically have much fewer sources of noise than urban environments. The majority of reservoir impounding dams are found in rural areas, and coastal areas are mainly characterized by the presence of salt water, so the types of structures found there are sea walls, piers and the other sub-types defined as beach structures and aids to navigation. Urban environments could also refer to urban/coastal environments as densely populated areas located by the sea. Table 5 delineates each environment type by the likelihood of the presence of factors that would impede certain geophysical techniques [27].
Table 5: Environmental Sources of Interference.
Limiting Factor Environment
Rural Coastal Urban Metallic disturbances Possible Possible Likely Potential Electromagnetic
source
Possible Possible Likely Vibrations from traffic etc Unlikely Unlikely Likely
iii. Available time and budget allocations as these two factors can heavily influence decision making in selecting the most suitable technique. Each geophysical technique, therefore, must be analyzed in terms of its time efficiency and cost effectiveness.
Various aspects related to geophysical methods applications are summarized in the following tables; Table 6 shows the applicability of the various geophysical methods to earthen structures and their limitations with possible sources of errors; Table 7 illustrate suitability of these methods to various detection requirement, while Table 8 indicates the adaptation of these methods to type of detection required, ease of application, required depth of investigation and resolution and details, ease of processing and limitations with respect to available time and budget constraints. Each of the geophysical methods has some aspects which make them more suitable to follow a particular issue or presents some limitations as can be seen from these tables. It is well understood that geophysical methods generally are useful as non- destructive remote sensing tools that can provide information over large volumes as compared to point measurements. However, the anomalies that are associated with internal erosion in embankment dams often are very small, and the effectiveness of geophysical techniques to detect changes in seepage conditions is improved through repeating surveys or adopting a long-term monitoring approach. In addition, application of more than one geophysical technique will provide added confidence in the interpretation and detection of anomalous features.
Complex inter-relationships exist between various parameters, such as water content, porosity, total dissolved solids, mineralogy, temperature, electrical resistivity, coupling coefficient, and self- potential (SP). Not recognizing some of the fundamental relationships and carrying out a one-time survey without supporting information could lead to misleading and often disappointing results.
Table 6: Geotechnical methods: Types, their suitability and their limitations [27].
Geophysical Method
Structure Limitations due to
Location Dikes, Levees (Transient Seepage) Impounding Dams(Steady State Seepage)
Rural, Costal, Urban
Electromagnetic Profiling
EM- 31, handled by 1 person, very fast
data collection
EM- 34, 2 persons operated, compact fast
data collection
Suitable for rural and coastal sites. Not suitable in urban
sites where too many metallic disturbances. Electrical Resistivity Tomography Not time effective to be done across km
Suitable Suitable for rural and coastal sites. Great care must be taken to account for metallic
objects in urban sites. Ground Penetrating Radar Profiling Soil dependent. Ground must be reasonably free of vegetation etc. Depth of investigation too low for monitoring down to foundation soil. Soil dependent.
Suitable for rural and urban sites. In costal sites it may
be suitable but method is soil dependent and salt
water. Seismic Methods Not time effective to be done across km
Suitable Suitable for rural and coastal areas. In urban areas sources of traffic and other vibration
must be removed Self- Potential
Methods
Only during flood conditions
Suitable Suitable for rural sites. Soil water can disrupt data in coastal sites. In urban sites
device is very sensitive to electrical perturbations. Temperature
Measurements
Only during flood conditions
Table 7: Geophysical methods and their suitability for targeted objective [27].
Geophysical Method
Detection Requirement objectives
Internal Composition/ zoning Identifying seepage paths Seepage flow intensity Large voids due to animal borrowing, erosion cavities Damage from environmental desiccation, root growth etc Electromagnetic Profiling Suitable only as 1 D mapping
Suitable Not suitable Suitable Could be detected but not identified solely from EM Electrical Resistivity Tomography
Suitable Suitable Not suitable Suitable Suitable
Ground Penetrating Radar Profiling
Suitable Not suitable
Not suitable May not resolve smaller animal borrowing Suitable Seismic Methods Suitable Not Suitable
Not Suitable Suitable Not suitable Self- Potential
Methods
Not suitable Suitable Suitable Not suitable
Not suitable
Temperature Measurements
Not suitable Suitable Only suitable with repeated measurement Not suitable Not suitable
Table 8: Summary of analysis of geophysical techniques [27]. Geophysical Method Type of Detection Field Implementation Depth of investigation (DOI) Data processing resolution Limiting Factors Acquisition speed Cost Electromagnetic Profiling Overall dam assessment, soil properties through soil electrical conductivity. Easiest data gathering method. Variable, smaller equipment around 3m, larger down to 40-50m Low resolution but straightforward to process. Not detailed enough for use as the sole monitoring technique. Fast Low Electrical Resistivity Tomography Detailed assessment, soil properties and geological structure, seepage and void detection. Can be problematic. Applicable in the largest variety of circumstances. Site and configuration dependent but quite large. High resolution, needs corroboration for other data
Must account for metallic objects and other artifacts in data. Slow High Self-Potential Methods Detects soil conditions and seepage paths as well as seepage intensity. Land or Waterborne. Simple implementation. Waterborne. DOI large enough for most reservoirs Medium resolution. Interpretation must account for any other
sources Very susceptible to interference. Not applicable for salt water/ “dry” sites. Slow Medium Ground Penetrating Radar Profiling Fairly detailed soil properties, material changes, internal structures and voids. Straightforward can be towed manual or vehicle. Small, generally no more than few
meters. Good resolution but very complex interpretation Not applicable for low resistivity materials- clayey for example. Fast Low Seismic Methods Detailed. Mechanical properties of soil/material, structures/voids. Reasonably easy to implement. Large enough to reach foundations. Requires high level of expertise in processing/ analysis. Low- Medium resolution Time consuming. Soil characteristi cs may inhibit DOI. Slow Very high Temperature Measurements Anomalies in the seasonal temperature gradient can indicate seepage. Straightforward installation but can be expensive. Intrusive- any depth to which sensors can be positioned. Interpolation of discrete values. Resolution dependent on prob. Sounding method is intrusive. Needs distinct temp-gradient contrast between water and medium. Medium High
Geophysical techniques applied to the detection of seepage and internal erosion in embankment dams are at various stages of development even now. Of such late developments are the Thermal or Temperature Geophysical Measurements Method. Temperature measurements appears to be now as one of the most-developed and best-understood techniques. With the recent advances in improved accuracy and resolution in measuring temperatures along fiber optic cables, there are exciting future possibilities.
For dam safety applications, the self- potential and resistivity methods generally appear to hold more promise than seismic methods as non-intrusive techniques applied at the surface of a dam. However, in specific settings, cross-hole seismic techniques could prove indispensable.
It is imperative that dam owner and practicing engineer should recognize the limitations and care required in planning, executing, and interpreting the results of all geophysical surveys. Geophysical data interpretation is non-unique and should be constrained by incorporating all available site information and integrating the interpretation of complementary data sets. Thus, strong cooperation between the geophysicist and engineer is essential to improve the interpretation and usefulness of the results [28].
6. Technical details of the geophysical methods
From the wide range of geophysical methods discussed already, it is clear that these methods are non-intrusive and fairly cheaper than the other conventional geotechnical methods involving visual observations and instrumental monitoring. These techniques, however, need in the majority of cases supporting data from the other conventional methods and from other geotechnical investigation results for the proper interpretation of the obtained data to remove doubts or confusions. Moreover, geophysical techniques can be used for ascertaining the safety of embankment dams and dikes when additional quick data are needed.
In most cases, experience up to now shows that these methods have been used to varying degrees of success to check the integrity of embankment dams that might have been affected by development of new seepage paths in the dam itself and/or its foundation and development of excessive seepage, or to observe changes in the material properties and development of dangerous cavities or sinkholes. Repeated application of such methods on the same structure at uniform time intervals can give a true picture of the progress of such anomalies with time and allows decision taking for necessary repair works when needed. More technical details on the application and methodologies are given hereafter for better explanation of these techniques.
6.1 Electromagnetic (EM) Profiling
Electromagnetic profiling (EM) method is used to measure conductivity differences of geologic material. It provides data on soil properties through soil electrical conductivity. In the case of seepage studies, possible seepage paths can be located through the identification of high or low conductivity anomalies, where water-filled or clay-filled features can produce high-conductivity anomalies and air-filled features can produce low-conductivity anomalies. Subsurface soil types can also be inferred from electromagnetic measurements in addition to changes in structural damage, and the presence of buried metallic objects. However, other factors such as porosity, degree of saturation, and temperature can also affect conductivity measurements.
In electromagnetic (EM) surveying, the electrical conductivity of the ground is measured as a function of depth and/or horizontal distance. Different rocks, buried structures and objects exhibit different values of electrical conductivity. Mapping variations in electrical conductivity can identify anomalous areas worthy of further geophysical or intrusive investigation.
For shallower depths, data is gathered using a handheld boom-shaped device holding an electromagnetic field transmitter on one end and a receiver on the other. This can be operated by one person traversing along the surface of the embankment as shown in Figures 3 and 4. For greater depths, two person systems exist which are still very straightforward to implement.
Figure 4: Acquisition of EM data with instrument [30].
The EM instrument system consists of an electromagnetic loop transmitter and a loop receiver where the transmitter generates a primary electromagnetic field that propagates above and below ground. When the primary (EM) field encounters a conductive material within the subsurface, alternating currents occur which, in turn, generate their own secondary (EM) field. The receiver detects the secondary EM field along with the primary field that travels through the air as shown in Figure 5. The ratio between the secondary and primary EM fields provides a comparative reading of the apparent ground conductivity. The electromagnetic profiling is based on the measurement of induction of the primary electromagnetic field of the transmitting coil in the surrounding investigated medium.
The primary field induces a secondary field in the ground whose intensity depends on the conductivity (resistivity) of the medium surrounding the transmitting coil. Therefore, water ingress can be detected [32].
Figure 5: EM surveying Method [31].
EM profiling’s fast and simple field implementation leads to a high acquisition speed, which combined with the simplicity of the data processing results in a very low cost, thus lending itself as an ideal method for initial, overall and complementary tool. For extremely rapid data acquisition over very large areas, airborne devices are also available.
Advantages of the (EM) method include the following:
(i) Ability to collect data without ground contact. (ii) Rapid data collection over large areas, and;
(iii)High horizontal resolution, which enables easier anomaly identification through simpler signatures.
Disadvantages include the following:
(i) Limited depth of investigation, typically no greater than 15 ft (4.6 m), for most systems.
(ii) Sensitivity to aboveground and buried metallic objects, and;
(iii) Instruments are subjective to interference from nearby alternating current electrical sources.
6.2 Electrical Resistivity Tomography (ERT)
(ERT) is one of the most well-established, and widely applicable geophysical techniques for detailed investigation for measuring material electrical resistivity (inverse of electrical conductivity). ERT studies have similar detection capabilities to EM i.e., soil properties, geological structures, seepage detection, cracking, presence of metallic objects; though in much greater detail.
Field implementation is straightforward, but fairly time consuming and can be problematic. It involves installing large array of electrodes at a depth of up to 15cm as in Figure 6. These electrodes are connected in sequence to map a site in terms of apparent ground resistance. A pair of electrodes apply an electric current into the ground and a second pair measures the resulting electrical potential distributions as seen in Figures 7a and 7b. This potential, together with the current value and a constant based on the array geometry yields an apparent resistivity reading of the underlying geological layering. Measurements are taken for different 4-electrode combinations; increasing the spacing between them increases the depth of measurement but decreases resolution. Various spacing configurations are used in practice and have different advantages, so it is often useful to implement more than one such configuration.
The acquisition time is longer for this process in comparison to EM method, largely due to time setting up and calibrating electrode arrays. An ERT array can be configured to map the entirety of almost any site/ dam size, and advanced equipment is available that allow for analysis across full frequency spectrums or incorporates complimentary geophysical surveying methods such as self-potential and induced polarization.
Figure 6: Typical array of electrodes for ERT RSK electrical resistivity imaging [33].
Figure 7b: Principles of ERT [33].
The raw ERT data is processed using a method known as inverse processing to produce 2D models that can be transformed as pseudo 3D maps. Figure 8 presents an example of a survey over waste site. A number of resistivity lines were collected in two orientations. During processing they have been corrected to allow for the topography of the surface and have been combined in 3D fence diagram to aid interpolation.
ERT is the most well-tested, widely applicable method of detailed investigations, and the procedures are clearly defined. Field work and analysis/processing should be carried out by the same team to allow accurate interpretation of the data. Much work has been carried out using EM and ERT as complementary methods. Similarly, ERT needs corroboration with other data to help rectify the ambiguities in inversion processing. Comparison of ERT method with other geophysical techniques has already been given in Table 8.
Figure 8: 3D representation of ERT [33]. 6.3 Self-Potential Method
The self-potential, or spontaneous potential (SP) method is a passive technique that measures the naturally occurring potentials in the ground and it is suitable for sites under hydraulic load such as impounding dams, and dikes/levees during flood conditions i.e., transient seepage. It is the only geophysical technique that responds directly to fluid flow. Water flowing through the pore space of soil, not fully developed sinkholes and foundation cavities generate electrical current flow. This electro-kinetic phenomenon is called streaming potential and gives rise to (SP) signals that are of primary interest in dam seepage studies. Past seepage investigations have indicated a relationship between SP anomalies and seepage flow, with negative anomalies recorded above areas of downward or horizontal flow and positive anomalies recorded above areas with upward seepage flow [34].
Anomalous recordings could also result from numerous sources other than seepage flow, such as electrochemical activity created through oxidation reactions, groundwater recharge, and telluric currents to name few. However, surveys can be conducted with proper consideration for other sources, leading to appropriate interpretation of seepage anomalies from (SP) data [35].
The main advantages of self- potential are:
(i) Self-potential survey is conducted mainly for detecting the seepage or leakage from or through engineering structures like dams, dikes, landslide zones, canals weirs etc. (SP) Surveys have also been effectively used for mineral exploration and faults mapping [36].
(ii) It provides an estimation of the seepage intensity and not just the preferential path of flow.
(iii) It is extensively used in groundwater mapping, especially for instances where a seepage related issue has been identified but needs further analysis or
conformation.
(iv) SP is straightforward but reasonably slow to implement; requiring only two nonpolarizing electrodes. Usually one is stationary electrode located at a base station and another moving electrode such that potentials being measured between the two.
(v) Data can be processed qualitatively very easily to produce contour maps of electric potential distributions such as that in Figure 9 [37], or quantitatively via 2D inversion processing to furnish information about the origin of the source of potential.
Figure 9: Color contour plot produced by SP method for a reservoir [36].
However, this method is very susceptible to noise from interfering sources of potential such as telluric currents, industrial currents, stray currents, currents associated with buried metal, and electric railway systems which can limit the scope of (SP’s) use. It can also be less effective in salt water applications, restricting its applicability for coastal defense monitoring.
Normally, streaming potential surveys are generally supplemented with complementary resistivity imaging surveying for confirmation of results and obtain detailed and desired information about the seepage/leakage paths.
The basic concept of SP utilizes the fact that various potentials are produced in natural ground or within the subsurface altered by human actions. Natural potentials occur about dissimilar materials, near varying concentrations of electrolytic solutions, and due to the flow of fluids. Electro-kinetic, or streaming, potential is due to the flow of a fluid with certain electrical properties passing through a pipe or
porous medium or cavity with different electrical properties as shown in Figure 10, which explains the basic principle of SP measuring technique.
Figure 10: Schematic of flow-induced negative streaming potentials [37, 38].
Self-Potential is measured by determining the voltage across a pair of non- polarizing electrodes using a high impedance voltmeter. This inexpensive and deceptively simple data acquisition procedure requires special care and attention to reliably interpret and correct for sources of electrical noise that can mask the signal of interest. Typically, SP anomalies on the order of tenths of millivolts are associated with seepage anomalies of interest. Distance between electrodes usually ranges between several meters to tens of meters, depending on the resolution required. Guidance on site deployment, data acquisition and interpretation is given in manufacturers literature and manuals [39].
For dam safety applications, SP and resistivity methods generally appear to hold more promise than seismic methods as nonintrusive techniques applied at the surface of a dam. However, in specific settings, cross-holes seismic techniques could prove indispensable. Although the understanding of SP as applied to embankment dams has come a long way in recent years, more research is required before this technique can enter into standard practice and be applied with confidence on a routine basis. It is imperative that dam owners and practitioners need a good interpretation of the results. Geophysical data interpretation is not unique and should be constrained by incorporating various data sets. Thus, strong cooperation between the geophysicists and engineers recognize the limitations and the care
required in planning and engineers is essential to improve the interpretation and usefulness of the results [34, 40].
6.4 Ground Penetrating Radar (GPR)
Ground penetrating radar (GPR) profiling is a technique that has come into regular use for various geophysical studies in recent years due to its simple and fast data acquisition coupled with a good level of detail/resolution [41].
The GPR method is based on the study of the propagation of high frequency electromagnetic waves in the ground; from a few tens of MHz to several GHz. These waves are generated in the form of temporal pulses at one point on the surface by an emitting antenna. The waves propagate within the soil at a speed typical for the terrain. When the waves meet different materials, they partially reflect back to the surface in accordance with the Snell-Descartes law, which is used to describe the relationship between the angles of incidence and refraction when referring to light or other waves passing through a boundary between two different isotropic media, such as water, glass, or air [42].
Wave’s characteristics are measured by another antenna and are subsequently analyzed to deduce the properties of the soil. GPR helps to detect dielectric contrasts existing in the material through which the electromagnetic waves propagate. The waves are reflected in the medium, because of the dielectric contrast between materials, associated with variations in lithology, texture, porosity, material density, and particularly water content. The greater the dielectric permittivity contrast, the higher the reflection coefficient [43].
In GPR profiling, electromagnetic waves are transmitted into soil as seen in Figure 11. When these waves reach a boundary between two materials of different dielectric permittivity, they are partially reflected and refracted. The amplitude and travel time of the reflected wave is related to the dielectric permittivity ε0 of the new
material the wave interacted with [44]. This method has been successfully used to detect anomalies very close to the surface both on dike slopes and on crests of embankment dams [45, 46].
GPR was used as a monitoring tool in Sweden for the embankment dams at Suorva, Akkats, Grundsjön, Stenkullafors, and Näs dams by using both crosshole electromagnetic wave tomography and GPR reflection measurements from the ground surface. In these dams, incidents of internal erosion, increased leakage were an evident problem. Differential settlement of the soil subsequently caused sink holes to develop on the dam crest. Because of the self-healing effects of the granular sand filter zones inside the dam body these dams did not fail [47].
Ground-penetrating radar is analogous to the seismic reflection technique, except that radar (microwaves) are utilized rather than acoustic waves. Radar waves generated at the surface are reflected from subsurface boundaries separating materials of contrasting conductivity and dielectric properties and are returned to the surface. Like seismic reflection, the greater the contrast, the greater the amplitude of the reflection. Data are displayed in time in a manner similar to seismic reflection data. The velocity at which the radar waves travel through a medium is
related to the dielectric constant and knowledge of this parameter can allow conversion of a time section to a depth section. Radar waves are transmitted and received by a control unit operating a transducer/antenna that is pulled along the ground. A time section is simultaneously displayed on a chart recorder, allowing the images to be examined during data acquisition. Adjustments in recording parameters can be made, as necessary. Effective depth of penetration ranges from about one foot in moist clay to 50 feet or more in dry granular sediments and rocks, and is governed by ground electrical properties. Also, higher frequency signals are attenuated faster than lower frequencies. Several antennas are available so that wave lengths can be matched to target dimensions for optimum imaging [48].
Figure 11: Flow diagram of GPR operation principle (after Royet, 2013) [44].
A representation of field implementation of the (GDR) method is illustrated as in Figure 12 [49].
Figure 12: Field Implementation of GPR [49].
Previous seepage investigations have demonstrated the ability of (GPR) to provide useful information. Advantages include good spatial resolution and high acquisition speed. However, GPR’s primary disadvantage is its extreme sensitivity to site conditions. Areas with high clay or water content within the shallow subsurface can attenuate the GPR signal, making it virtually useless.
Studies can be straightforward to carry out with a variety of devices operated by one surveyor, some handheld some towed along the ground. Although resolution can be quite high, processing/interpretation is very difficult, partially due to the sheer volume of data produced.
The depth of investigation is not very deep, restricting (GPR’s) value for use on higher assets such as reservoir impounding dam, but, among the versatile uses of GPR are, bedrock profiling, ground water exploration, bathymetry, stratigraphy mapping and sedimentation in addition to sinkholes, and tunnel detection [50].
6.5 Seismic Methods
Although there are various types of seismic geophysical surveys that can be carried out separately or together, the basic principle of all seismic methods is the controlled generation of elastic waves by a seismic source in order to obtain an image of the subsurface. Detection here is focused on the mechanical properties of material, such as shear strength and internal structures and voids.
Seismic reflection and seismic refraction methods are reasonably easy to implement in the field, often using a transmission device as simple as a hammer, and an array of geophone receivers.
This is a very slow process which is one of the main limitations. Multi-channel analysis of surface waves (MASW) however, has a higher output rate than the two previous seismic methods but its data interpretation requires high level of expertise,
so this trade-off must be considered. Seismic techniques are regularly used for deeper subsurface investigations, meaning measurements can easily be taken down to the foundations of any asset here if no other limiting factor is present. An added benefit of MASW is its ability to utilize vibrations caused by external noise such as traffic in an urban environment as the source of seismic waves.
These methods can be used effectively used in investigation of dams issues and discovering anomalies at an early time.
The full range of available seismic techniques include the following;
(i) Seismic Refraction:
Typically, acoustic pulses are generated at predetermined source locations (S) along the length of the refraction seismic profile. The travel times of acoustic energy that has been critically refracted at horizons of interest (L1) is recorded at predetermined receiver locations (R1, R2, etc.). The recorded travel time information is used to generate a velocity – structure profile of the shallow subsurface along the length of the refraction profile. If external constraints are available, the velocity–structure profile can be transformed into a geologic model, Figure 13.
(ii) Seismic Reflection:
This method is similar to the seismic refraction method except that the travel times and amplitudes of reflected acoustic energy are recorded at the receiver locations (R1, R2, etc.). The recorded travel time-amplitude information is used to generate a reflection seismic profile. These data can be transformed in similar way as the seismic refraction method into a velocity – structure profile, and if external constraints are available, the velocity – structure profile can be transformed into a geologic model, Figure 14.
(iii) Multichannel analyses of surface waves (MASW)
Surface (Rayleigh) wave energy, generated using a nearby acoustic source, is recorded at predetermined receiver locations (R1, R2, etc.). A dispersion curve (phase velocity versus frequency), generated from the acquired field data, is inverted and used to generate a 1-D shear wave velocity profile which is generally tied to the physical center of the receiver array. If additional MASW data sets are acquired at adjacent locations, 2-D or 3-D shear-wave velocity models can be created. If external constraints are available, the shear wave velocity models can be transformed into geologic models, Figure 15.
(iv) Refraction Microtremor (ReMi)
Surface (Rayleigh) wave energy, generated using a passive (background) acoustic source, is recorded at predetermined receiver locations (R1, R2, etc.). A dispersion curve (phase velocity vs. frequency), generated from the acquired field data, is inverted and used to generate a 1-D shear wave velocity profile which is generally “tied” to the physical center of the receiver array. If additional ReMi data sets are acquired at adjacent locations, 2-D or 3-D shear-wave velocity models can be created. If external constraints are available, these shear wave velocity models can be transformed into geologic models, Figure 16. This method is capable to generate a detailed vertical shear-wave velocity profile to depths of up to 100 meters. Prior to 1999, seismic shear wave profiles were obtained using shear wave refraction,
seismic cone penetrometer, or downhole/crosshole techniques. The ReMi technique provides a non-invasive way of obtaining a vertical profile of the shear wave and, unlike borehole methods, this technique provides a shear wave and, unlike borehole methods, this technique provides a shear wave sample of a greater volume of material, thereby allowing a more representative shear wave velocity column that is averaged over the length of the seismic array.
(https://www.spectrum-geophysics.com/refraction-microtremor/)
(v) Cross-Hole Seismic Tomography:
Typically, high-frequency acoustic pulses are generated at predetermined source locations (S) in the source borehole (SB). The amplitude and arrival time of direct arrivals is recorded at predetermined receiver locations in the receiver borehole (RB). The recorded travel time–amplitude data are statistically analyzed and used to generate a velocity-attenuation cross-sectional model of the area between the source and receiver boreholes. If external constraints are available, the velocity- attenuation profile can be transformed into a geologic model, Figure 17.
Figure 13: Seismic Refraction [51]. Figure 14: Seismic Reflection [51].
Figure 15: Multi Channel Analysis of Surface Waves ( MASW) [51].
Figure 16: Refraction Microtremor (ReMi) [51].
Figure 17: Cross-Hole Seismic Tomography [51].
In the seismic refraction method, the disturbance is created by shot, hammer, weight drop, or some other comparable method for putting impulsive energy into the ground. Detectors laid out at regular intervals, measure the first arrival of the energy and its time. The data are plotted in time - distance graphs from which the velocities of the different layers, and their depths can be calculated [52]. In the seismic reflection shots are fired, in turn, at each of the geophone positions and active geophones are progressively added ahead of the shots, and taken up from behind the shots, in a roll-along fashion. At each subsurface boundary, across which the elastic and density parameters differ, a percentage of the energy in the wave is reflected back to the surface where it is recorded. If a particular boundary is horizontal, the reflection point will be half way between the shot and any given geophone. Reflecting boundaries are mapped out as the system rolls along. Placing each reflection point in its proper place in the subsurface requires intense and complicated processing of the collected information [53].
Summary of commonly used geophysical seismic methods for geotechnical investigations is given in Table 9 (After Anderson) [51].
Table 9: Summary of commonly used geophysical seismic methods for geotechnical investigations [51] (After Anderson 2006). Geophysical Method Measured Parameter(s) Physical Property or Properties Physical Property Mode (Geotechnical Application) Typical Site Model (Geotechnical Applications) Shallow Seismic refraction Travel time of refracted seismic energy (p- or s wave) Acoustic velocity (function of elastic moduli and density)
Acoustic velocity – depth model often with interpreted layer
boundaries
Geologic profile
Shallow Seismic reflection
Travel time and amplitudes of reflected seismic energy (p- or s- wave) Density and acoustic velocity (acoustic velocity is a function of elastic moduli and density)
Acoustic velocity- depth model often with interpreted layer
boundaries Geologic profile Multi-Channel Analysis of Surface Waves ( MASW) Travel time of surface waves energy generated using an active source (e.g., sledge hammer Acoustic velocity (function of elastic moduli and density)
Acoustic (shear- wave) velocity-depth
model often with interpreted layer boundaries Geologic profile Refraction Micrometer (ReMi) Travel times of passive surface wave energy Acoustic velocity (function of elastic moduli and density)
Acoustic (shear- wave) velocity-depth
model often with interpreted layer boundaries Geologic profile Cross- hole seismic tomography Travel times and amplitudes of seismic energy (p- or s wave) Density and acoustic velocity (acoustic velocity is a function of elastic moduli and density)
Model depicting spatial variations in
acoustic velocity
Geologic Profile
Potential geotechnical applications of these seismic methods as related to dams’ issues are summarized in Table 10, which is based on Table 2 (after Anderson, 2006) [54].
Table 10: Seismic methods as related to dams and related issues; after Anderson 2006 [54].
6.6 Temperature Methods
Temperature measurements are a well-established form of monitoring that make use of the seasonal variations that act on a waterbody. These measurements make use of natural seasonal temperature variations to locate areas of preferential seepage. Temperature in the saturated part of an embankment dam primarily is governed by the temperature of the water seeping from the reservoir. However, the air temperature from above and geothermal heat flow from below also influence temperature distribution in the dam. Geothermal heat flow is relatively constant, but air and reservoir temperatures vary seasonally and create temperature “waves” that penetrate the dam. Conductive air temperature variations typically penetrate about 10 meters below the dam surface along the crest and downstream slopes. Upstream, reservoir water exhibits seasonal fluctuations that are influenced by stream inflows and mixing. Stratification often exists in large reservoirs, and variations up to about 20 degrees Celsius (C) can occur in the upper tens of meters of the reservoir, with little seasonal fluctuation at depth. Figure 18 shows the effect of seasonal fluctuations on a vertical temperature profile measured in a deep reservoir in northern British Columbia.
Application Refr. Refl. ReMi MASW Seis Tomo.
Dam sites integrity studies M M M M M
Foundations integrity studies M - M M X
Landslide site evaluation M - X X M
Mapping bedrock topography
(< 30ft depth ) M - M M -
Mapping bedrock topography
(> 30ft depth ) X M M M M
Identifying near surface karstic sinkholes,
brecciated, and otherwise disrupted ground M M - - -
Figure 18: Vertical temperature profiles measured in the reservoir impounded by a dam inBritish Colombia [55].
The two major techniques of data gathering for water impounding projects involve either attaching discrete thermistors to the face of the dam, or inserting rows of temperature sensors into the body of the dam via small boreholes as shown in Figure 19 [56].
![Figure 1: Diagram showing Schlumberger set up for electric resistivity measurement [3]](https://thumb-eu.123doks.com/thumbv2/5dokorg/4427124.106513/4.813.123.662.106.425/figure-diagram-showing-schlumberger-set-electric-resistivity-measurement.webp)

![Table 4: Electrical Resistivity values for different types of soils [23].](https://thumb-eu.123doks.com/thumbv2/5dokorg/4427124.106513/11.813.98.717.279.777/table-electrical-resistivity-values-different-types-soils.webp)
![Figure 2: Resistivity (and its inversion, conductivity) of the main earth materials (Palacky, 1991) [25]](https://thumb-eu.123doks.com/thumbv2/5dokorg/4427124.106513/12.813.154.682.254.692/figure-resistivity-inversion-conductivity-main-earth-materials-palacky.webp)

![Table 6: Geotechnical methods: Types, their suitability and their limitations [27].](https://thumb-eu.123doks.com/thumbv2/5dokorg/4427124.106513/15.813.70.748.152.761/table-geotechnical-methods-types-suitability-limitations.webp)
![Table 8: Summary of analysis of geophysical techniques [27]. Geophysical Method Type of Detection Field Implementation Depth of investigation (DOI) Data processing resolution Limiting Factors Acquisition speed Cost Electromagnetic Profili](https://thumb-eu.123doks.com/thumbv2/5dokorg/4427124.106513/17.813.28.785.135.914/geophysical-techniques-geophysical-implementation-investigation-processing-acquisition-electromagnetic.webp)
![Figure 3: Acquisition with EM31 data instrument [29].](https://thumb-eu.123doks.com/thumbv2/5dokorg/4427124.106513/19.813.188.624.567.954/figure-acquisition-em-data-instrument.webp)
![Figure 4: Acquisition of EM data with instrument [30].](https://thumb-eu.123doks.com/thumbv2/5dokorg/4427124.106513/20.813.188.627.106.494/figure-acquisition-em-data-instrument.webp)
