Do political institutions
affect the impact of
Official Development
Assistance success on
poverty reduction?
BACHELOR THESIS WITHIN: Economics NUMBER OF CREDITS: 15 ECTS
PROGRAMME OF STUDY: International Economics AUTHOR: Tian YUAN, Ugo COUTON
Bachelor Thesis in Economics
Title: Do political institutions affect the impact of ODA success on poverty reduction? Authors: Ugo Couton and Tian Yuan
Tutor: Andrea Schneider Date: 2020-12-07
Key terms: Official Development Aid (ODA), Poverty, Democracy, Regime Stability, Economic growth.
Abstract
The United Nations, in their 2030 Agenda for sustainable development, states that “eradicating poverty in all its forms and dimensions, including extreme poverty, is the greatest global challenge and an indispensable requirement for sustainable development”. Hence, as it is a global challenge, we have decided to investigate how can the efforts to address this issue with official development assistance could be facilitated or mitigated by democracy and strong institutions. Hopefully will our observations provide a clearer idea of how the political background can be arranged to facilitate the efforts of poverty alleviation. The study that we have conducted relies on various theories and models. Among them are the papers from Burnside & Dollar who have extensively studied the relationships that exists between foreign aid, economic policies, and GDP per capita growth which are defining concepts for our paper. This paper then regresses poverty on six variables: democracy and institutional stability, official development aid, gross capital formation, school enrolment, and unemployment rate. This panel series analysis covering the period 2008-2018 aims to show if ODA effectively affect poverty, and how the level of democracy and institution stability plays a role in that relationship. The regressions conducted advocated that institutional stability plays an important role in reducing absolute poverty. In the meantime, relative poverty was very slightly increased by both democracy and stability, but both indicators seem to have a positive impact on ODA’s capacity to reduce relative poverty.
Table of Contents
... 1
1.
Introduction ... 1
2.
Theory ... 3
Official Development Aid impact on capital formation. ... 3
The role of institutions on economic development. ... 5
3.
Literature Review ... 7
Strong correlation between aid and poverty... 7
No correlation between aid and poverty ... 8
Conditional correlation between aid and poverty ... 8
The importance of policies ... 8
4.
Data and Descriptive. ... 10
Sample specifications ... 10
Dependent variable... 12
Independent variables... 13
5.
Empirical Model and Results ... 17
Absolute poverty measurement ... 17
5.1.1 Democracy as Policy index ... 17
5.1.2 Stability as policy index ... 21
Relative poverty measurement ... 24
5.2.1 Democracy as Policy index ... 24
5.2.2 Stability as Policy index ... 25
Discussion ... 27
1. Introduction
“An optimal allocation of aid is to countries where good policies are in place.” - Christian Schabbel. (2007, pg. 11)
For more than 50 years, the World Bank Group has claimed its ultimate objective of development efforts as “to end extreme poverty and promote shared prosperity” (World Bank Overview, 2020, pg.1), which requires a transfer of resources from industrialised countries, channelled through international organisations or nongovernmental organisations, for the purpose of alleviating extreme poverty in underdeveloped countries. This type of recorded official governmental aid is also known as Official Development Assistance (ODA). The volume of total annual ODA of 24 DAC countries (Development Assistant Committee) has reached 152.8 billion US dollars in 2019. (OECD, 2020) Ironically, despite this large inflow of foreign aid, it was not the first time over the past 50 years that we observed “an already slowing-down poverty reduction progress.” (World Bank Overview, 2020, pg. 1) The situation is even worse in most sub-Saharan African countries which have been receiving large amounts of foreign aid for longer than two decades, but still failed to break the poverty trap and showed little improvement in economic growth (Mallik, 2008). Among most of the ODA receipt countries, there were remarkable improvements in key poverty indicators with a proportionally significant drop of the percentage of population living below the extreme poverty line falling from 40% to 18% between 1981 and 2004, however sub-Saharan Africa is an exception - the percentage living below extreme poverty line staying constant between 42% and 41% (Kates & Dasgupta, 2007). There are several underlying reasons why ODA has lost its efficiency in most of African countries. Some argued that African countries are geographically disadvantaged, others might say civil wars in Africa have lessened the ODA’s economic impacts, but most often have scholars and politicians dressed the quality of political institutions as one determinant of ODA’s success. This thesis, therefore, examines the role of political institutions of 52 African countries plays in affecting the efficiency of ODA in terms of poverty reduction.
aid-(Glennie & Sumner, 2014) debates over the well-known “micro-macro paradox”. Yet only a few of them assessed the relevance of political institutions in receipt countries and aid effectiveness, and the number of studies that depicted the picture of African country’s policies and their impacts on aid effectiveness is even fewer. For the very first time, Collier and Dollar (2002) buried the old affairs with their optimal “aid selectivity” which states that the optimal aid allocation favours countries with “high levels of poverty, low per capita incomes and sound policy regimes.” Such allocations are considered optimal poverty efficient in terms of maximising the effort in reducing the proportion of population living under the poverty line. Countries with unsound policy regimes, on the other hand, lessen the impact of aid on poverty and in turn, receive less aid. There is a clear reason why this paper has chosen African countries as the sample - they show similar state in terms of poverty and per capita incomes, yet at the core of their political and institutional structures, they show variations in fiscal discipline, trade liberalisation, political stability, and the degree of democracy due to their colonial past. (Austin, 2010) In this paper we revisit the old question of foreign aid efficiency – “Do political institutions affect the impact of ODA success on poverty reduction?” Based on the empirical work of Burnside and Dollar (1997a, 1997b, 2000), which used panel growth regressions for 56 developing countries over six four-year periods, we would like to examine if their old conclusion about the linkage between aid effectiveness and “good fiscal, monetary and trade policies” still holds true for 52 African countries during the period 2008-2018.
This paper will begin with an extensive review of the theoretical and literature reviews in section 2 and 3 including background of the aspects, models, concepts, and historical context which will be of importance to understand the various facets of the notions that we will use all throughout this article. It will also provide a preliminary idea of the proven, unsure, or rejected causes effects that we will be able to discuss and then comfort or reject. In section 4, we will develop on the methodology that this paper will follow in term of testing the empirical data that this paper is based on. In this part, the variables will be defined, along with expected results and their motivation. Thereafter in section 5, we will undergo an actual data analysis through regression models which we expect to provide more precise indications on how each variable affect poverty, and on how these effects can be conditioned in some cases. The regression results are expected to provide us with
a clearer perspective on the relationships which stands based on real world data. Based on such perspective, we will be able to make formal observations which will allow us to state what we have been able to prove, which of our expectations has been rejected, and what could be further explored by future research to clarify unclear or changing trends in a region which is expected to be confronted to structural changes in the coming decades. The final section concludes our regression results – we found that impact of ODA on absolute poverty is only significant when democracy/stability is in place, and the impact of political institutions on ODA’s effectiveness in reducing relative poverty is not clear. 2.
Theory
Official Development Aid impact on capital formation.
As this paper aims to assess the effect of official development aid on poverty, we need to acknowledge that poverty depends on the level of wealth that a country has in order to find a theoretical background which provides a framework for our paper. A main theory on this aspect is the poverty traps, which occurs when a country’s GDP per capita increases when the country receives an inflow of capital, but that, when that capital inflow stops, the GDP level decreases (Schabbel, 2007). Such observation would suggest that countries facing such situation are trapped in poverty, where the level of per-capita output and capital stock are in a steady state at a low level. According to this theory, as long as population grows at a rate which equals the growth of the capital stock, the amount of capital per worker is not increasing which keeps the economy away from formal growth. A graphic illustration of a poverty trap can be depicted as on the figure below:
Figure 2-1:Poverty trap. (Barro and Sala-i-Martin (1995), p.50)
at klow, the stable steady state level where it is said to be trapped in. The objective here, is to achieve a higher level of growth, in such situation, it would be to arrive in another stable situation at a higher level of k, here, khigh. If the amount of ODA invested does not promote the recipient country to overshoot kmiddle, the country will fall back to klow, in the “trap” where it is said to be. This is because, only over kmiddle the saving curve is over the population growth, so if the economy goes beyond kmiddle, it will have enough saving rate to be self-sustainable (Schabbel, 2007). Otherwise, if kmiddle is not attained, the saving rate is not sufficient to provide investment capacity and the economy will slowly regress back to klow. In the end, poverty trap advocates for larger amounts of ODA donated, in such way that the country reach a capital-labour ratio sufficient to ensure future investments and be self-sustaining.
Following the same intuition is the Big Push Theory, initially theorised by Rosenstein-Rodan (1943). It advocates for simultaneous investments in infrastructure, across different production sectors in order to achieve multiplier effects and reach a higher level of output, arguing that “complementarity of different industries provides the most important set of arguments in favour of a large-scale planned industrialisation” (Rosenstein-Rodan, 1943, pg. 205) This strongly relies on the poverty trap theory that we have just introduced, with a difference here on the fact that the big push theory lies mostly on cointegration of firms and sectors within an economy. This would imply that firms, along with a large amount of government spending in infrastructures, take a simultaneous decision to industrialise and that such decision is expected to provide a subsequent leap to the equilibrium of the economy because of the coordination of the investment. It is also notable that a plan of the sort would require an open trade economy as well as an extensive and thorough planning. However, this last aspect can be subject to the political regime in place in the developing economy as corrupted institutions would potentially divert the benefits of economic planning toward their own interests more than to the population general interest. Nonetheless, it can be relevant to address some criticising arguments to this theory, as every country has been underdeveloped at some point of history, so if this theory really applied in strict terms as stated, there would be no developed countries today. It is also important to note that, exception made of some east-Asian countries, growth is a gradual process which does not come all of a sudden and that these theories do not provide a background for a typical growth scheme.
The role of institutions on economic development.
Legacies of the European colonisation are still well implemented in the former African colonies’ current institutions, Acemoglu (2002). As a consequence, this colonial past would also alter the way that developing economies are inclined to ulteriorly develop economically. This theory starts with acknowledging that European colonialists had the objective to maximise the rents they perceived from the colony’s economic activity instead of trying to favour a long-term growth. As a consequence, the European colonisation flipped the prior economic environment. This led to two major scheme in term of the type of institution which was instituted:
In prosperous and densely populated areas, they implemented extractive institutions which aimed to collect the benefits of the existing economic activity by limiting the property rights for the population. Meanwhile, in scarcely populated areas, institutions of private property, which encourages commerce and industry, were preferred, such institutions later favoured these areas throughout the industrialisation process (Acemoglu, 2002).
This theory could explain why some countries benefited from a different background of well-established property rights protection, whilst other countries, which were former colonies with extractive institutions were put at disadvantage, which might still hold if the level of democracy has not been sufficient enough to replace this institutional system. From these observations, Acemoglu argued that “a good organization of society to correspond to a cluster of (political, economic, and social) institutions ensuring that a broad cross section of society has effective property rights.” (Acemoglu, 2002, pg. 1262). This advocates for two main principles to hold for an economy to achieve a long-term growth which benefits the entire population. First, are solid and enforced property rights which secures the returns for investment for those with productive opportunities which will generate wealth. Second, a democratic regime, following the assumption that only a broad-based power is able to ensure that property rights hold for the majority. If these two conditions do not hold (e.g., if the regime is highly corrupted), then the rights of the elite are prominent over the general interest, thus deterring incentives to invest, to the detriment of economic development.
This theory highlights that, a perfect situation to promote economic development would be for a country to have a democratic regime with strong institutions. To test if this affirmation holds in terms of poverty alleviation, the empirical study that this paper will follow will include these two indicators as variables (Democracy and Stability). Therefore, we will be able to study if the institutional background of a country is indeed a main determinant of further development perspectives (i.e. if ODA, when attributed to democratic countries with strong institutions, is very likely to reduce poverty), or if this theory should be mitigated by taking into consideration other factors.
Beyond the nature of democracy and stability is the role of political institutions in shaping the patterns of government corruption (Ledmerman, Loayza & Soares, 2005), and it thus affect how the government channel and distribute received ODA in order to reach its efficiency. Our theoretical benchmark assumes that good political institutions prevent potential corruption via increasing political accountability, which makes the allocation of ODA more visible to prevent less money from disappearing. In theory, the allocation and distribution of ODA is most likely to be a source of corruption because allocation of ODA in its essence, is a form of government interventions which involves monetary transactions containing “asymmetry of information between citizens and politicians” (Ledmerman, Loayza & Soares, 2005, pg.3). Good institutional designs refer to transparency of government activities, freedom of press, political stability, and democracies. These factors together improve the governmental accountability and encourage politician to align their own political interests with those of their citizens. Those who failed in doing so will face a punishment – the loss of elections. As accountability forces politicians to stick to good governance practices, it is strongly correlated with a lower level of corruption (Bardhan, 1997). Therefore, ODA received by good political institutions disappear less, and are more efficiently used for provision of public services/goods.
There are previous literatures describing an essential trade-off between wealth inequality and poverty named Kuznets Hypothesis which assumed an economy would comprise low inequality in order to reach low level of poverty, as in its essence, poverty reduction comes hand in hand with higher inequality. However, due to data limitation on Gini
indexes of African countries as they do not survey their population on yearly basis, the linkage between inequality and poverty will not be empirically tested in this paper.
3. Literature Review
Rarely do previous literatures reveal the direct impact of aid has on poverty reduction. Most of previous studies have faced similar problems with data availability as most African countries do not survey their population on a yearly basis. However, previous literatures have provided key viewpoints of which aid may affect the level of poverty through economic growth - foreign aid flows into the economy and gives the economy a big push, contributing to a virtuous circle of economic growth, thus eventually reduces poverty (Mahembe et a., 2019). To maintain our research focus, this subsection only reviews literatures revealing the direct linkage between aid and poverty, and those debating poverty reduction on a growth theory context.
Strong correlation between aid and poverty
Existing studies of the aid-poverty relationship have failed to produce a conclusive result. The first stream of literatures, leaded by Easterly & Pfutze (2008), has stood for one of the strongest advocators for aid and argued that the issue of aid effectiveness is “ubiquitous” – foreign aid can effectively reduce the proportion of population living under extreme poverty line by providing essentials such as nutrition, hygiene, and medical attentions. He further stated that only aid given in “best practices”, being measured in five dimensions of transparency, specialisation, selectivity, ineffective aid channels and overhead costs, achieved its optimal effectiveness. Yiew and Lau (2018) in their recently published paper, advocated aid contributed to either social or economic infrastructure reforms that will evenly benefit poverty strike regions. The assumption of existence of an “Aid Laffer Curve” was reviewed and empirically tested by Lensink & White (2000). They draw a conclusion that aid reduces poverty, but follow the rule of diminishing returns, so that there exist a Laffer Curve (an inverted U shape relationship) between aid and its effectiveness where the peak of this inverted U is a threshold value of aid, when the receipt country reaching beyond the maximum economic output, aid is no longer positively correlated to economic growth and starts to show no impact on growth.
No correlation between aid and poverty
The second stream of scholars argued there is no linkage between ODA and poverty. Dhakal et al. (1996) conducted a causality test involving four Asian countries (India, Nepal, Pakistan, and Thailand) and four African countries (Botswana, Kenya, Malawi and Tanzania) and found the relationship between foreign aid and economic growth in any of these countries to be very fuzzy. Those who stand for no linkage between aid and poverty concerned neither does aid significantly attract investment (Dollar & Easterly 1999, Boone, 1996), nor does it benefit the poor (Rajan & Subramanian, 2005), but it only increases the size of government (Boone, 1996). This is further convinced by (Deaton 2013) who argued that aiding an economy which had already met development prerequisites is unnecessary, while aiding an economy that is “not ready” is ineffective.
Conditional correlation between aid and poverty
A third stream of literatures states the importance of receipt country’s good policies when determining the aid efficiency. Those papers have revealed the relationships among ODA, economic policies, and growth of per capita GDP. Scholars have found that ODA will have a positive impact on growth only if the receipt countries are with good fiscal and monetary policies, trade openness, political and price stability, a certain degree of democracy (Burnside & Dollar, 2000, Easterly & Pfutze, 2008). While in the presence of poor policies, past studies have found that aid fails to have significant positive impact on growth. (Burnside & Dollar, 2000) This section will review the theories and literatures regarding the importance of policy.
The importance of policies
The paper by Burnside & Dollar (1997) has, for the first time, introduced economic policies into the equation and built a standard model to assess aid effectiveness on growth and poverty reduction at the macro level. At the heart of their investigation of 56 low-income countries during 1970-1993, they have shown that fiscal discipline, trade liberalisation, and other market friendly policies are consistent with aid efficiency. Compared to those countries with poor policies, the average growth of per capita GDP is 0.18% higher in countries with good policies, and the correlation between aid and policy indexes in these countries turned out to be significantly positive. They also brought up the concept of “institutional and policy distortions” and they have developed a model with
a range of institutional and policy distortions to test aid effectiveness. They found the impact of aid will be greater in a low distortion environment. This means they have revealed the fact that the growth rates will determined by “institutional and political distortions, aid, and how aid interacted with distortions” (Burnside & Dollar, 2000, pg.4) Their empirical findings suggest that foreign aid does not have an impact on economic policies but does have a strong impact on growth where good policies are in place. They further remarked a “reverse impact” of polices on the efficiency of aid, not only do-good policies contribute to the aid efficiency, but aid also “favours” good policies – the donors tend to reward good policies by allocating more aid, but “this tendency has been overwhelmed by the donor’s other strategic interests.” (Burnside & Dollar, 2000 pg.2)
Easterly et al (2004) proposed an opposition to Burnside & Dollar’s findings. They tested for the same linkage between aid effectiveness and policy institutions, using a wider country sample and covering a period, and found that although the correlation between aid efficiency and policy institution is not statistically significant, the coefficient of aid efficiency on economic growth is positive. Burnside & Dollar (2004) responded to this finding and argued that insignificant corelation was resulted by outliers and a positive coefficient reflected the complexity between aid and policies.
Collier & Dollar (1999, 2002) presented a so-called poverty-efficient aid allocation model based on the theoretical ground developed by Burnside & Dollar. Their study tested the differences in percentage of economic growth rates with a fixed percentage point’s worth of aid. They found that in countries with good policies, the overall impact of aid is more profound and its sensitive to policy “more muted”. Every 1% increase in aid will result in an 0.9% increase in economic growth rate in countries with good polices, and the percentages of growth descend in countries with poor policies. They concluded with the idea that “The diversion of aid from poverty reduction to policy improvement would be justifiable were there evidence that the offer of finance is effective in inducing policy improvement” (Collier & Dollar, 2002, pg.1497). The relation between political instability and aid effectiveness was analysed by Chauvet & Guillaumont (2002) by introducing a political instability index into their model. They have found that this index influenced growth directly, with a significant negative coefficient, via its interaction with
the level of aid. This result indicated that aid was more effective in a stable political environment.
The effect of democracy on the aid-growth relationship was examined by Svensson (2000). He has found that the long-run effectiveness of aid is conditional on the degree of political democracy and liberties. It is believed by him that governments which use aid productively and efficiently are under regular institutionalised check by democratic institutions. In their aid-growth model, the coefficient attached to the interaction between aid and democracy was significant and positive. Such observations predetermined the world bank to state that there is “No value in providing large amount of money to a country with poor policies” (World Bank Group, 2016).
With all being said, it becomes clearer that democratic regimes and independent institutions favours a better utilisation of ODA. Yet, one could wonder if countries with such characteristic receives more foreign aid. Alesina (2002) brought light on the fact that, in terms of foreign aid allocation, strategic diplomatic considerations matter more than the actual supposed efficiency of the distributed aid, with many countries favouring their former colonies, regardless of their corruption level, over other countries. Withal, Scandinavian countries, Australia, and the United States, which do not have former colonies have proven to be able to discriminate more, and then have a better selection process of the countries to which they provide foreign aid. Thus, they tend to allocate more to countries with democratic institutions, and, exception made of the US, which disregard that factor, to countries with institutions presenting a low level of corruption Alesina (2002). Although, on a general perspective, there is no significant indication that corrupted and autocratic countries are discriminated in the process of foreign aid allocation.
4. Data and Descriptive.
Sample specifications
This study brings its main focus on Africa as it is the world region which provides the largest number of developing economies according to the United Nations world economic situation and prospects 2020. The table containing the 52 countries selected for this study can be found in appendix and is based on the United Nations classification for developing
economies. One adjustment is therefore worth noticing, Sao Tome and Principe, initially present on the list provided by the United nations has been removed in our sample. This is due to data availability. As it was impossible for us to appreciate the impact of democracy and stability on this country’s recourse to ODA, we had to supress it from our sample.
In terms of time frame, this study will cover the years 2008 to 2018 included. This choice has two main motivations. The first one, to start our selection before 2008 would have been an issue in terms of data availability, as we are focusing on developing economies, many indicators or variables are not calculated on a yearly basis, and this problem, which stands on a current basis, has been even more marked for previous years. The second motivation for the chosen time limitation is in line with the Polity V index, from which are obtained the level of democracy and stability which are key variables of our model. As the latest values available were issued in 2018, it was not possible for us to cover more recent years. Finally, the 2008-2018 frame provides us a 11-year range, which is appears to be a large enough time range to see how aid has inflowed into the economy and capture some trends on a short-term basis while keeping a reasonable amount of data for our model to embed.
This implies that our paper will rely on panel data. That is, a time series for each cross-sectional unit in the sample, as we will use data for several variables, which apply for a set of 52 countries, and this, with yearly data for a 11-year time frame. However, because of the scarcity of data for some variables, which will be further discussed afterwards, we will have an unbalanced panel dataset, since we have fewer actual observations than if all data for all countries would have been available, in which case, we would have had 52 countries * 11 years, thus 572 observations for each variable. As this is not the case, the panel is unbalanced, which suggests beginning our econometric analysis with pooled OLS, while keeping in mind that, because of the small number of observations for poverty, the estimates might be unstable.
The empirical data has been retrieved from two main sources:
Data for Democracy and Stability variables has been gathered from the Integrated Network for Societal Conflict Research which provides a database, named Polity V, for
various indexes to assess the state and quality of societal and governmental institutions for the quasi-entirety of countries recognised by the United Nations.
Data for ODA, gross capital formation, school enrolment and unemployment rate have been retrieved from the World Bank official database. The world bank is an international organisation directed toward development of low- and middle-income countries, thus providing reliable yearly data which has been used by several previous studies in the field, some of which have been introduced in the literature review of this paper. Using the same databases can allows us to expect more relevant comparisons between our findings and the theories which motivated this study because the risk of different observations for a same indicator at the same point in time is almost non-existent.
Withal, it is relevant to notice that the data we have retrieved is subject to some constraints. Indeed, the poverty variables both present an important lack of availability for all countries, all of them have available poverty data, meanwhile, some of them only have one single observation for assessing poverty on the entire 2008-2018 range. Although these are the most complete databases publicly accessible, African countries do not screen for poverty indexes on a yearly basis, and this, for financial and logistical reasons. This is expected to affect our regression models in the way that some bias might occurs because of model underfitting. For more precisions, a data descriptive table can be found in appendix of this paper.
As a consequence, significance levels will likely be altered as it will become more complicated for our model to draw links between the variables. This issue also applies to school enrolment variable which do not exist for some countries in our sample. However, this should not alter the model to a large extent as the majority of the data is still available in that case.
Dependent variable.
Poverty is a generic term to refer to various situations. Poverty can be absolute, relative, structural, transitional and can have economic impacts beyond the simple approach of the income. In this paper, two different measures of poverty will be regarded:
The World bank defines poverty through the concept of absolute poverty. It comprises all individuals, regardless of age whose relies on less than 1.90$ per day to live. The variable we will use in this paper is the poverty gap at 1.90$/day expressed as a
percentage of the population. It has been retrieved from the world bank and expresses, for every country, the share of the population which lives with 1.90$ or less per day calculated at the household’s level (using a sample of representative households).
Secondly, the regression model will also test for relative poverty with the income share held by the lowest 20% of the population. It shows the share of the national income that goes to the poorest 20%, the greater this percentage, the lesser the relative poverty since it implies a more equal wealth repartition.
These two variables will therefore test for absolute and relative poverty. On an economic perspective, these aspects are distinguished by the perspective they offer, especially given that various economies have various scales. There can be a case where, within a country, no, or very few individuals live in absolute poverty. In this case, the poverty gap variable alone would show no poverty at all. However, taking relative poverty into account allows for further interpretation. If, in the same country, the poorest 20% only receive a small share of the national income, this would imply that, although there is no extreme poverty, there is still a situation of poverty with respect to the scale of the actual economy.
Independent variables.
Democracy and institutional stability
These two variables are derived from the Polity V index which provides extensive dataset for variables which allows for an extensive appreciation of authority among democratic and autocratic regimes. From this dataset, we will bring a close attention to two variables in particular.
The democracy index (named POLITY in the initial database) works on a [-10;10] interval where -10 is a fully autocratic regime, as, for example, Eswatini (indicator of -9) and 10 represent a “perfect” democracy, as in the case of Cabo Verde or Mauritius. The score that a country can obtain on this scale varies according to the presence of institution through which citizens can expressed their political preferences, the presence of institutionalised constraints on the executive power, and finally, the guarantee of civil liberties to all, including in their political participation. All of this, along with the rule of law, systems of checks and balances, freedom of the press and so on.
The stability index is a very straightforward indicator in such way that it indicates the number of years since the latest regime change. A regime change is considered as so
years or less. If such change has occurred, then the stability index is set to 0 and is expected to gradually increase as the new regime settles in. It seems relevant to precise that progression to a higher or lower level of democracy in such rapid extents do not necessarily mean that there is a regime change, but the lack of stability resulting from this variation of the democracy level is considered important enough by the database’s authors to qualify it as a change of regime.
We expect both of these variables to have a negative correlation on poverty gap and a positive correlation with the income share. Previous studies, such as (Collier & Dollar, 1999), have argued that overall, a higher level of democracy and strong institutions should provide a solid background in favour of a reduction in poverty.
Official Development Aid
The data regarding Official Development aid has been obtained from the World bank. It is the net amount of ODA received as a percentage of gross capital formation. Practically speaking, it corresponds to the net amount of ODA received by a country, represented as a percentage of the gross capital formation that will be defined below. Such indicator allows us to compare the ODA received related to the economic dynamism rather than a net amount which could differ largely across countries because of third factors which we would not be able to capture or explain. These factors could be the former colonial links between a developed and a developing economy as previously evoked in literature review, but it could also be that a certain sector of the economy encourages foreign aid because of future strategic purposes. ODA should hold a negative correlation on poverty gap, and we suppose a positive correlation with the income share. This expectation is based upon the fact that ODA’s main purpose is economic development. The wealth generated by the aid inflows in economy should therefore increase the income per capita and reduce poverty in absolute terms. In relative terms, we expect a more mitigated result which should depend on the quality of the recipient country’s governance.
Gross capital Formation
The gross capital formation, that is expressed in the model as a percentage of the Gross Domestic Product, refers, according to the World Bank, to the additions to the fixed assets of the economy plus net changes in the level of inventories. This variable will allow us to have an appreciation of changes of the capital stock which has been praised in the
economic theories previously developed in this paper. Thus, we will be able to see if the capital stock has an effect on a country’s capacity to lower its level of poverty. Capital formation should have a negative correlation on poverty gap and a positive correlation with the income share. As theories previously introduced in this paper such as the Big Push model advocates that ODA first implication is capital stock growth in view of attaining a higher output equilibrium allowing a self-sustaining economy, the new higher output should generate wealth that would then reduce the poverty level.
School enrolment
School enrolment is a variable that the world bank defines as the percentage of children of official school age who are enrolled in school. This paper focusses on primary school enrolment, as, for the time length of this paper, the share of the population which receives an education, whatever the level, is of a greater interest than the level of education itself. School enrolment is a key variable in the way that it is affected by poverty since poorer children will likely be kept at home in poorer regions by various reasons such as the lack of school, the difficulty to go to school and/or to follow the education provided, or because their parents need them to work as they need help to guarantee their survival. But school enrolment also affects poverty in the way that a better education for children of poor families is a way to offer them chances to later obtain a better paying job than what they could have hoped for without going to school. The UNESCO advocates in favour of such logic, stating that “Abject poverty can be eradicated, if an enabling environment for learning is put in place. The poverty cycle can be broken, and the way is through education.” (Ugandan National Commission for UNESCO, 2003). We expect school enrolment to have a negative correlation on poverty gap and a positive correlation with the income share. This is because, as priorly explained in this section, a higher school enrolment is expected to reduce both absolute poverty by providing poor children chances for a better economic situation in their adult life, and relative poverty because a uniformed level of education across all children within a country reduces the likeliness of important wages gap in the future.
Unemployment rate
Unemployment depicts a state where people are jobless and are actively seeking for work. It is explicitly defined as “the number of unemployed persons as a percentage of the total
Previous literature shed light on understanding the microeconomic foundations of how unemployment contributes to income poverty, with the assumption of majority families rely on labour market earnings, so that unemployment results in a households’ income declining to a degree that they fall below the national poverty line (Powers, 1995) Blank and Blinder (1993, 1986) empirically proved that unemployment rate was positively related to the proportion population living in poverty. Saunders (2002) further argued from a macroeconomic perspective, claiming that high unemployment not only increases the risk of poverty, but contributes to high inequality as well. Goulden (2010) claimed in his study that income decline due to unemployment only caused “recurrent” poverty and the poverty rate’s sensitivity was conditioned on the government’s policies regarding unemployment compensation (Powers, 1995). This recurrent poverty, however, can turn into “persistent” poverty when families enter poverty cycle (Goulden, 2010) where the unemployment rate of adults starts to negatively correlate with the school’s enrolment rate of their children. Those forced to enter work force early in their ages eventually end up with incomplete education, lowering the human capital in future generation and thus generates future poverty. The unformal labour market, in place to various extents across developing economies makes that relationship a bit more complex as a person can be labelled as unemployed while having a job unruled by the legislation. However, if this job can provide some kind of income to cover just the basic living needs of the individual, it does not provide the security nets and aid which usually comes with a formal legal job. Therefore, the unformal labour market does not allow one to exit poverty as it usually just provides a mean of subsistence. To a large extent, policy responses can lessen the consequences that unemployment might have on poverty when the welfare system responses to this labour demand fluctuations effectively (Goulden, 2010). Unemployment rate supposedly should have a positive correlation on poverty gap and a negative correlation with the income share. As a reason, a higher unemployment rate should increase the poverty gap, as jobless individuals are deprived of income, which, in countries without social security net, could mean living below 1.9$ a day. More unemployment should also decrease the income share of the poorest 20% as it should reduce the average income of the more precarious (and unemployed) share of the population, reducing the share of national income that they receive.
5. Empirical Model and Results
To test empirically whether there exists a relationship between political institutions and the impact of ODA’s succuss in poverty reduction, we use an unbalanced panel dataset on 52 African countries over a 11-year period from 2008 to 2018. We share similar objective as previous studies – that is to test explicitly the simultaneous interactions among aid, policy and poverty reduction using regression analysis, yet our approach differs in that we decide to first run a reduced model without political controls, and then to explicitly model political controls and the simultaneous interaction term in our complete model for comparing the results. We expect the results from reduced model differ from the complete model. We will then run the Hausman Test to decide whether FE or RE is preferred. As our dataset is an unbalanced panel data, we will further run a pooled OLS model and possibly to make comparisons between pooled OLS and the panel model. We expect the results to change across different models as well.
As this paper assesses poverty in both absolute and relative term, we will divide our empirical part into two major subsections according to the dependent variable. We will make comparisons between regression results first within each subsection, and eventually make cross-section comparisons between two different poverty measures.
Absolute poverty measurement 5.1.1 Democracy as Policy index
Our reduced empirical model is represented as follows:
𝑃 = 𝛽0+ 𝛽1𝐺 + 𝛽2𝐴 + 𝛽3𝐸 + 𝛽4𝑈 + 𝜀 (1)
Where P stands for the poverty measure (absolute poverty throughout section 5.1), G stands for the Gross Capital Formation, A stands for the level of net aid received relative to GDP, E stands for school enrolment rate, U stands for the unemployment rate, and 𝜀 is an error term. Since we expect implications of a linier correlation between variables, our first step is run both RE and FE panel models, and then at our selected significance level 0.1, we further conduct the Hausman Test for deciding RE or FE preference. Below table
Periods included: 10
Cross-sections included: 37
Within which unbalanced observations: 49
Table 5.1.2 Hausman Test
Correlated Random Effects - Hausman Test summary Chi-Sq. d.f. Prob.
Cross-section random 6 0.0836
Table 5.1 2 shows the results from Hausman Test for our complete model. It suggested that we should reject the null hypothesis, thus the fixed effect model was preferred. For the favour of making comparisons between reduced and complete model, the model selection of the reduced model is aligned with the complete model (as this is our main model). If the Hausman Test suggests us to use FE for our complete model, then our reduced model will also use FE.
The regression results from the reduced model have revealed that impact of ODA on poverty is insignificant without policy variables, but with an expected negative sign of its coefficient. The only variable being statistically significant in determining absolute poverty level is school enrolment rate. The absolute poverty is correlated with school
Dependent variable: POV_GAP
Interaction=
ODA*DEMOCRACY FIXED RANDOM
Without POLITY V With POLITY V Without POLITY V With POLITY V ODA -0.020750 (0.022493) -0.074055* (0.037665) -0.015510 (0.017129) -0.023484 (0.018773)
Gross Gap Form
0.062511 (0.066308) 0.066940 (0.064419) 0.002691 (0.057004) -0.002571 (0.054649) SCHOOL ENR -0.540237* (0.248465) -0.586050** (0.241112) -0.170915 * (0.100793) -0.172547 * (0.098278) Unemployment rate 0.189509 (0.566128) -1.464473 (1.102818) -0.308878 (0.226055) -0.340307 (0.230701) DEMOCRACY -1.918036* (1.172257) -0.023829 (0.332348) Interaction ODA*DEMOCRACY 0.006936* (0.004299) 0.001790 (0.002323) NB: *significant variable at 10% **significant variable at 5% *** significant variable at 1%
enrolment rate with a coefficient of -0.54, which means 1 percentage increase in school enrolment rate will result in a 0.54 percentage decrease in absolute poverty level.
Now we introduce policy variables into our regression model. Our empirical model is based on a previous interactive study of aid, politics, and growth initially introduced by Burnside and Dollar (2000) and developed by Collier and Dollar (2002). This basic model is as follows:
𝑃 = 𝛽0+ 𝛽1𝐺 + 𝛽2𝐴 + 𝛽3𝐸 + 𝛽4𝑈 + 𝛽5𝑃𝑂𝐿 + 𝜀 (2)
Compared to the reduced regression, now we have the variable POL being introduced to the regression, which stands for the policy index. In this paper our policy index is refer to a single political measure, either as governance stability or the degree of democracy. This is because if both measures are included in the same regression, this might cause potential problems as stability and democracy are expected to be highly correlated. Therefore, two separate regressions are run for us to compare different policy measures. First, we will discuss the regression results regarding democracy as the policy index. Hereby we have the variable POL = Democracy.
From Table 5.1 1, the introduction of democracy changes the result from reduced model remarkably. First and most interestingly, we have noticed the impact of ODA on poverty turned significant with the introduction of policy index, from the probability 0.38 to 0.09, with the coefficient of -0.074. This means with democracy in place, every 1 percent increase in ODA will result in a 7.4 percent decrease in absolute poverty level. This observation goes in line with previous literatures concluding that ODA is only efficient when good policies are in place. Besides, we have noticed the policy index itself has a close-significance-level probability of 0.1529. If this probability was due to data outliers, then we are most likely to conclude that democracy itself leads to less poverty. With a negative coefficient of -1.91, its impacts seem to be noticeable, with 1 unit increase in democracy leading to 1.918 unit decrease in poverty. In both regressions, one variable being constantly significant to determine poverty is school enrolment.
The result from previous regression brought us interest in finding out the interaction term Democracy/Stability * ODA. This variable in its essence, revealed a significant
reduction while the effect of institutional stability had to be mitigated. While Polity index only tells that better institutions lead to less poverty, the interaction term tells whether better institutions change how ODA affects poverty.
The model can be written as:
𝑃 = 𝛽0+ 𝛽1𝐺 + 𝛽2𝐴 + 𝛽3𝐸 + 𝛽4𝑈 + 𝛽5𝑃𝑂𝐿 + 𝛽6𝑃𝑂𝐿 ∗ 𝐴 + 𝜀 (3)
Where POL*A stands for the interaction term of democracy/stability and aid.
From the result table 5.1 1, the interaction term POL*A itself is significant. This means not only does democracy lead to less poverty, but it also changes the effectiveness of ODA has in reducing poverty level which means that the effectiveness of ODA on poverty reduction is conditioned by the degree of democracy in the recipient countries. The coefficient of ODA changes from -0.02 to -0.07, this means ODA will have a 0.05 (0.07-0.02) percentage increase in its effectiveness when democracy is present.
Table 5.1.3 Pooled OLS
Periods included: 10
Cross-sections included: 37
Within which unbalanced observations: 49
Dependent variable: POV_GAP
Interaction=
ODA*DEMOCRACY OLS
Without
POLITY V With POLITY V
ODA
0.001172 (0.026113)
0.026242 (0.036242)
Gross Gap Form
-0.051560 (0.130521) -0.073314 (0.130578) SCHOOL ENR -0.094355 (0.096549) -0.064534 (0.098945) Unemployment rate -0.439469** (0.222670) -0.413424* (0.231309) DEMOCRACY 0.653225 (0.423179) Interaction ODA*DEMOCRACY -0.006508 (0.004572) NB: *significant variable at 10% **significant variable at 5% *** significant variable at 1%
Now to test if the panel result changes across different models, we further run a pooled OLS model as this model better fits with unbalanced dataset. Comparing Table 5.1.3 to Table 5.1.1, we noticed the results differ in two methodologies. With the reduced model, the school enrolment rate is no longer significant in pooled OLS, instead the unemployment rate becomes highly significant at 0.05 significance level with an expected negative coefficient of -0.43. When including the policy index, we found unemployment rate remains its significance with a slight decrease in its absolute coefficient. Democracy in the complete model now is associated with an unexpected positive sign, with a rather insignificant probability. We argue that if there shall exist methodological shortcomings associated with unbalanced dataset; different models may produce mixed results.
5.1.2 Stability as policy index
Now we run separate regressions to test the effect of stability as the policy index may have on the impact of ODA effectiveness.
Table 5.1.4 Panel regression result (stability as policy measure)
Periods included: 10
Cross-sections included: 37
Within which unbalanced observations: 49
Dependent variable: POV_GAP
Interaction= ODA*STABILITY FIXED RANDOM
Without POLITY V With POLITY V Without
POLITY V With POLITY V
ODA -0.020750 (0.022493) -0.057267 (0.040551) -0.015510 (0.017129) -0.057267** (0.028470)
Gross Gap Form
0.062511 (0.066308) 0.056642 (0.048357) 0.002691 (0.057004) 0.056642 (0.043154) SCHOOL ENR -0.540237* (0.248465) 0.026051 (0.261179) -0.170915* (0.100793) 0.026051 (0.109329) Unemployment rate 0.189509 (0.566128) -0.865646 (0.544097) -0.308878 (0.226055) -0.865646 (0.215416) Stability -0.951648** (0.337877) -0.951648** (0.130251) Interaction ODA*STABILITY 0.000390 (0.000930) 0.000390** (0.000772) NB: *significant variable at 10% **significant variable at 5% *** significant variable at 1%
Table 5.1.5 Hausman Test 2
Table 5.1.5 shows the results from Hausman Test. It suggested that we cannot reject the null hypothesis, thus the random effect model was preferred.
According to Table 5.1.4, the regression results on reduced control variables have revealed that only school enrolment rate is statistically significant, and the rest of our control variables are not significant in terms of determining absolute poverty level. The absolute poverty is correlated with school enrolment rate with a coefficient of -0.17, which means 1 percentage increase in school enrolment rate will result in a 0.17 percentage decrease in absolute poverty level.
Now considering the effect of stability, this time, changes from the initial reduced model can be observed. School enrolment depicts a positive correlation but is not significant anymore. However, with this model, the official development aid becomes significant in reducing poverty gap. For each percent increase in ODA the poverty gap should be reduced by 5.7 percent. Withal, both stability and the interaction variable of Stability*ODA shows significance at a 10% level, but in two different ways. Whilst a higher level of stability is expected to decrease poverty gap at a large extent, the interaction term coefficient transcripts a slight positive correlation. This would imply that the effect of ODA on poverty gap conditioned to stability leads to a small increase in the former. This is an especially surprising observation given that the model advocates that ODA and Stability to both independently contribute to a lower level of absolute poverty.
Table 5.1.6 Pooled OLS 1
Periods included: 10
Cross-sections included: 37
Within which unbalanced observations: 49
Correlated Random Effects - Hausman Test summary Chi-Sq. d.f. Prob.
Dependent variable: POV_GAP
Interaction= ODA*STABILITY OLS
Without POLITY V With POLITY V
ODA
0.001172 (0.026113)
0.027230 (0.050342)
Gross Gap Form
-0.051560 (0.130521) -0.053790 (0.133048) SCHOOL ENR -0.094355 (0.096549) -0.072577 (0.108077) Unemployment rate -0.439469** (0.222670) -0.407728* (0.235909) Stability 0.054528 (0.184718) Interaction ODA*STABILITY -0.001255 (0.002153)
When considering the ordinary least squares regression, as depicted in table 5.1.6, the observations do vary in terms of relevant variables. We can observe a similar trend to the ones discussed in table 5.1.3 with the level of democracy. The reduced model provides no evidence of an effect of ODA on the poverty gap. Other variables all depict a negative correlation, although they are not significant, exception made of the unemployment rate, which the model suggest being reducing poverty by 0.43% for a 1% increase in the unemployment rate. However, this observation goes against the expected results we had and against findings of previous studies, suggesting for a bias in our dataset. We will later explore the possible reason for this unexpected negative corelation between unemployment and poverty in our discussion section. This phenomenon may reveal negative aid side effects and aid dependency in receipt countries.
Now embedding the stability variable and its interaction on ODA in the OLS model, the observations do not vary. Neither institutional stability nor its effect of stability on ODA’s capacity in terms of poverty reduction are significant in this model. Withal, the variables already present in the reduced model do still advocate for the questionable trends discussed earlier.
NB:
*significant variable at 10% **significant variable at 5% *** significant variable at 1%
Relative poverty measurement
In this part, the regressions should be interpreted inversely to the ones in the first part. This is because, as we have discussed in the previous part regarding the variables, the higher the income share held by the lowest 20%, the lower the relative poverty. Hence, in this part, a negative coefficient would imply an increase in relative poverty while a positive coefficient would imply a reduction in relative poverty.
5.2.1 Democracy as Policy index
Table 5.2.1 Panel regression result (democracy) 1
Periods included: 10
Cross-sections included: 37
Within which unbalanced observations: 49
Dependent variable: INCOME SHARE LOWEST
Interaction=
ODA*DEMOCRACY FIXED RANDOM
Without POLITY V With POLITY V Without
POLITY V With POLITY V
ODA -0.000714 (0.005315) -0.002846 (0.010595) -0.005932* (0.003637) -0.009031** (0.004660)
Gross Gap Form
-0.032670* (0.015667) -0.034494* (0.018121) -0.016555 (0.012995) -0.016282 (0.014364) SCHOOL ENR 0.089293 (0.058705) 0.093866 (0.067825) -0.002227 (0.018907) -0.005364 (0.018681) Unemployment rate 0.122187 (0.133759) 0.051365 (0.310226) -0.029882 (0.042616) -0.045337 (0.043050) DEMOCRACY -0.031923 (0.329759) -0.101472 (0.069409) Interaction ODA*DEMOCRACY 0.000495 (0.001209) 0.000802 (0.000580)
Table 5.2.2 Hausman test 3
Correlated Random Effects - Hausman Test summary Chi-Sq. d.f. Prob.
Cross-section random 6 0.6712
NB:
*significant variable at 10% **significant variable at 5% *** significant variable at 1%
Table 5.2.1 uses a different poverty measure to test for the estimation of relative poverty. The Hausman test in table 5.2.2 suggested us to use the RE model for our complete model, so our reduced model will align with Hausman test result and use RE as well. In the reduced model, we have observed that at the significance level 0.1, ODA has a probability of 0.11 being close to our selected significance level. Based on what we have observed, we concluded that the impact of ODA on relative poverty is not yet perfectly statistically significant but being close to. The coefficient of ODA is -0.006, indicating a 1% increase in ODA will lead to a minor increase in relative poverty level of 0.6% (as we measure an income share, the higher the dependant variable, the better in terms of poverty alleviation). Only one variable, unemployment rate, shows its expected sign.
After introducing the policy variable, we have observed an increase in the probability of ODA, keeping it as significant even at 0.05 significance level when democracy is in place. When ODA is alone in the reduced model, it has a barely significant negative coefficient. After democracy is introduced, ODA still has a close to zero coefficient, but it is significantly negative. Besides, the probability of democracy also gives us an indication that itself may not be significant enough in determining relative poverty level, but it has a potential impact on how ODA affects relative poverty.
5.2.2 Stability as Policy index
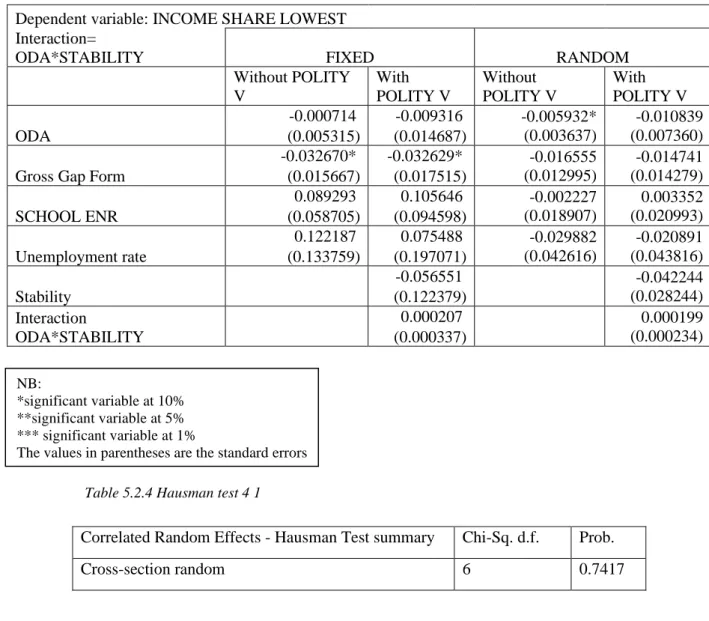
Analysing the same regression in table 5.2.1 below but with stability instead of democracy yields to similar tendencies. Stability shows a significance level which is close to the one of democracy. Both are unsignificant at a 10% level but seem to show a negative correlation, implying an increase in relative poverty which argues that a 1 percent increase in stability index would reduce the income share by 4.2%. The effect of Stability on ODA’s efficacy in terms of reducing relative poverty also seems to be unsignificant despite showing a positive correlation.
Table 5.2.3 Panel result (stability) 1
Periods included: 10
Cross-sections included: 37
Dependent variable: INCOME SHARE LOWEST Interaction=
ODA*STABILITY FIXED RANDOM
Without POLITY V With POLITY V Without POLITY V With POLITY V ODA -0.000714 (0.005315) -0.009316 (0.014687) -0.005932* (0.003637) -0.010839 (0.007360)
Gross Gap Form
-0.032670* (0.015667) -0.032629* (0.017515) -0.016555 (0.012995) -0.014741 (0.014279) SCHOOL ENR 0.089293 (0.058705) 0.105646 (0.094598) -0.002227 (0.018907) 0.003352 (0.020993) Unemployment rate 0.122187 (0.133759) 0.075488 (0.197071) -0.029882 (0.042616) -0.020891 (0.043816) Stability -0.056551 (0.122379) -0.042244 (0.028244) Interaction ODA*STABILITY 0.000207 (0.000337) 0.000199 (0.000234)
The most interesting finding in our regression result is that if we compare table 5.2.1 to table 5.2.3, the regression results show similar tendencies. In other words, if we keep our dependent variable fixed as a particular poverty measurement, the choice of policy measurement does not produce opposite results. Hence, we argue that the core of Burnside-Dollar conclusion still holds true – that ODA is more efficient in situations where good policy is in place, and this “good policies” is not conditioned to a particular choice of the policy variables. At least to say in our paper, both stability and democracy go in line with the main Burnside-Dollar assumptions. However, if we keep the policy variable fixed, but change the way we measure poverty, then the regression results alter dramatically across different poverty measurements. What might have a significant impact on absolute poverty level may not have the same amount of impact on relative poverty level.
Table 5.2.4 Hausman test 4 1
Correlated Random Effects - Hausman Test summary Chi-Sq. d.f. Prob.
Cross-section random 6 0.7417
NB:
*significant variable at 10% **significant variable at 5% *** significant variable at 1%
To sum up, we found our regression results mostly go in line with previous studies findings. We tested for both Polity variables and interaction terms and found that not only do both democracy and stability lead to less poverty, but they change the way how ODA affects poverty as well. This result only holds true for absolute poverty, and not surprisingly when considering relative poverty, neither Polity nor the interaction term works the same way. This could be explained by the essence of relative poverty – it depicts the degree of inequality in the economy – which is usually interested by the government to buy off poverty with. As the economy starts to comprise low inequality in order to reach low level of poverty, they are negatively correlated, being indifferent to political institutions and distortions.
Discussion
At the core of our observations, we found that our regression model provided consistent result with Burnside and Dollar’s work in that the estimated impact of ODA on absolute poverty level is statistically significant in a good policy environment. However, there are a few interesting findings which have not been dressed in previous studies, and thus are identified and given possible reasoning in this section.
The first interesting finding is that the contributing policy regimes which create the “good policy environment” could be highly correlated - democracy in a country is mostly likely to bring good fiscal, monetary, and trade policies. This explains why our choices of different policy measurement are somehow producing similar regression results. In our regression, we separated and isolated the impact of each policy variable by including single policy measurement once at a time, and interestingly found that the significance of aid impact on poverty is not conditional to particular choices of the policy variable. We found democracy and stability both play an essential role in shaping the patterns and designs of political institutions, and thus hard for us to define whether aid efficiency favours one determinant over the other, as democracy and stability are highly corelated and come hand in hand. Democracy contributes to receipt countries’ governmental accountability, while stability implies that strong and stable political institutions which incorporate more controls over the major economic and demographic variables (education, income, population density) that define poverty level.
Besides, we have found the unemployment across all models have unexpected negative corelations with poverty level. Usually, less poverty means economic prosperity and will in turn bring less unemployment. A negative corelation between these two variables reveals aid reliance and dependence in most African countries. This is an “unwelcome and unfortunate side effect of aid” (Thomas et al. 2011) which hinders sustained economic development. Such phenomenon intrinsically causes “political dependency” which may lead to corruption, so that donors have a political leverage over their own interest of which values and motivation are not necessarily to align with the public. This may in turn generate a vicious circle creating more unemployment in place.
Additionally, we have observed that, when testing for relative poverty, ODA has a negative correlation with the income share held by the lowest 20% of the population. An explanation could be found in the economic models previously introduced in this paper. Indeed, ODA has not proved to be directly affecting growth, it does so, mostly by the mean of a short-term increase in capital stock. Thus, the primary beneficiaries of ODA in the short-term are the possessors of this capital stock, which are assumably not among the lowest 20% earners within their respective country. As a consequence, the relative poverty increases as depicted in the models.
Also, as we have explained in part 4, we were expecting some coefficients and significance level to be biased because of scarce data on poverty. This has been the case several times. Some regression signs were not in line with the expected results based on previous studies. Some coefficients, such as unemployment rate have shown to be highly insignificant in some cases, while evidence of its effect of poverty has been proved by prior studies, which points towards the fact that data availability have had an unfortunate effect on the regression results we have obtained and interpreted. Conducting the same study on another sample of countries with more data availability on poverty variables would likely have allowed us to draw more precise conclusions.
6. Conclusion
The aim of this paper was to unravel the existence and nature of the process throughout which the level of democracy and political stability could impact the effect that official development aid has on poverty alleviation.
As a foundation for this thesis, the literature that we have reviewed has proposed different perspectives on whether ODA had an impact of poverty at all. When Easterly & Pfutze (2008) argued that ODA effect on poverty was always beneficial as long as it reduces chances of malnutrition, diseases, and death, others such as Deaton (2013), advocated for some mitigation. This, stating that providing ODA to an economy which do not meet the prerequisites for development is unnecessary. What our empirical results have highlighted, is that, both for relative and absolute poverty, adding the polity variable and its interaction term in the model caused ODA to have a significant negative impact on poverty whilst this same impact in the reduced model was more mitigated. Nonetheless, it is worth noticing that there is one exception, when testing the stability effect on relative poverty, in which case ODA prove to reduce poverty only at a 15% confidence level. Withal, regarding our findings, it appears safe to say that ODA is a triggering factor of poverty alleviation.
However, the main motivation of this paper was not to highlight if ODA could reduce poverty or not, but instead, to determine the effect of the institutional background on how ODA altered poverty. The first part of our empirical observations focused on absolute poverty and showed that both democracy and stability had a negative correlation coefficient, which mean that both supposedly reduce poverty in absolute term. However, the democracy variable has not proved to be significant. So, according to our findings, only the institutional stability of a country could actually affect poverty, and the way that ODA affects poverty in absolute terms. This goes in line with Burnside & Dollar (1997 and 2000) as they have first introduced how ODA effect on growth and poverty was conditioned to a good institutional background and later how aid effectiveness was sensible to institutional and policy distortions, advocating for stability as a main factor for ODA success. Secondly, considering relative poverty, similar observations have been made for democracy and stability; both slightly increased relative poverty, a trend which can be explained by the fact that ODA primarily increase the capital stock. The interaction terms were not significant neither, despite the fact that they suggested that both polity variables would induce ODA to yield to a decrease in relative poverty.
After all of that being said, it seems clear that, although other factors should be taken in consideration, democracy and stability do play a role on how ODA affects poverty. If the