Data Mining with Decision Trees in the Gene Logic Database – A Breast Cancer Study
(HS-IDA-MD-02-207)
Neda Rahpeymai (a98nedra@student.his.se)
Department of computer science Högskolan in Skövde, Box 408
S-54128 Skövde, SWEDEN
Masters Dissertation in bioinformatics, Spring 2002. Supervisor: Björn Olsson
Data Mining with Decision Trees in the Gene Logic Database – A Breast Cancer Study Neda Rahpeymai (a98nedra@student.his.se)
Abstract
Data mining approaches have been increasingly used in recent years in order to find patterns and regularities in large databases. In this study, the C4.5 decision tree approach was used for mining of Gene Logic database, containing biological data. The decision tree approach was used in order to identify the most relevant genes and risk factors involved in breast cancer, in order to separate healthy patients from breast cancer patients in the data sets used. Four different tests were performed for this purpose. Cross validation was performed, for each of the four tests, in order to evaluate the capacity of the decision tree approaches in correctly classifying ‘new’ samples. In the first test, the expression of 108 breast related genes, shown in appendix A, for 75 patients were used as input to the C4.5 algorithm. This test resulted in a decision tree containing only four genes considered to be the most relevant in order to correctly classify patients. Cross validation indicates an average accuracy of 89% in classifying ‘new’ samples. In the second test, risk factor data was used as input. The cross validation result shows an average accuracy of 87% in classifying ‘new’ samples. In the third test, both gene expression data and risk factor data were put together as one input. The cross validation procedure for this approach again indicates an average accuracy of 87% in classifying ‘new’ samples. In the final test, the C4.5 algorithm was used in order to indicate possible signalling pathways involving the four genes identified by the decision tree based on only gene expression data. In some of cases, the C4.5 algorithm found trees suggesting pathways which are supported by the breast cancer literature. Since not all pathways involving the four putative breast cancer genes are known yet, the other suggested pathways should be further analyzed in order to increase their credibility.
In summary, this study demonstrates the application of decision tree approaches for the identification of genes and risk factors relevant for the classification of breast cancer patients.
Table of contents
1.
Introduction... 5
2.
Background ... 8
2.1 Data mining and decision trees... 8
2.2 Decision trees and applications in medicine ... 10
2.3 Cancer ... 11
2.3.1 Breast cancer... 12
2.3.1.1 Risk factors ... 12
2.3.1.2 Major genes... 14
2.4 The Gene Logic database ... 17
2.5 The C4.5 algorithm ... 18
3.
Problem definition, hypothesis and motivations ...22
3.1 Aims and objectives ... 23
4.
Related work ...26
5.
Methods and results ...28
5.1 Filtration of data... 28
5.2 Deriving decision trees and production rules ... 30
5.2.1 Expression of 108 breast-related genes as input data... 31
5.2.2 Risk factors as input data... 36
5.2.3 Expression of breast-related genes and risk factors as input data... 43
5.2.4 Indication of pathways involving known breast cancer genes ... 46
5.2.4.1 The MKI67 nuclear antigen ... 47
5.2.4.2 The BCL2-associated X protein (BAX) ... 48
5.2.4.3 The Androgen receptor (AR) ... 49
5.2.4.4 Synuclein-gamma (SNCG) ... 50
6.
Analysis of results...52
6.1 Expression of 108 breast-related genes as input data ... 52
6.2 Risk factors as input data ... 55
6.3 Expression of breast-related genes and risk factors as input data ... 59
6.4 Indication of pathways involving known breast cancer genes ... 60
6.4.1 The MKI67 nuclear antigen... 62
6.4.2 The BCL2-associated X protein (BAX) ... 63
6.4.3 The Androgen receptor (AR)... 64
6.4.4 Synuclein-gamma (SNCG) ... 66
8.
Conclusions...74
9.
Future work...77
References ...78
1. Introduction
Data mining has been defined as "The nontrivial extraction of implicit, previously unknown, and potentially useful information from data"(Frawley et. al. 1992). It uses machine learning, statistical and visualization techniques to discover and present knowledge in a form which is easily comprehensible to humans.
The data mining concept has been popularly treated as a synonym of knowledge discovery in databases where intelligent methods are applied in order to extract data patterns (Han, 1999). However, mining the human genome to identify genetic mutations that cause complex diseases is like looking for needles in a haystack. In this process the coding regions in the genome must first be identified so that researchers can find disease-related sequences within these regions. Bioinformatics, that is, the use of information-technology and software developed for biological studies, makes it possible for researchers to look through the whole genome in order to find these genetic defects. Years of research have shown that genetic defects, whether caused bymutagens or inherited as defective gene copies, are inherent to the onset of cancer (Mort, 2000). Cancer’s characteristic uncontrolled cell growth usually involves some combination of an impaired DNA repair pathway, the transformation of a normal gene to an oncogene and/or a malfunctioning tumor suppressor gene(Mort, 2000).
One of the questions that may come to mind is if mining cDNA libraries might be a promising way of searching for breast cancer related genes in order to find genetic weapons to combat the disease. The answer to this question could be ‘yes’ due to the fact that data mining facilitates the management of the huge amount of information (data) accessible in the cDNA libraries. A key data mining technique is considered to be classification where database tuples, acting as training samples, are analysed in order to produce a model for the given data (Kamber, 1997). This technique has several applications including disease diagnosis. A well-accepted method for classification is the induction of decision trees. A decision tree is a flow-chart-like structure consisting of internal nodes, leaf nodes, and branches (Kamber, 1997). Each internal node represents a decision, or test, on a data attribute and each outgoing branch corresponds to a possible outcome of the test. Each leaf node represents a certain class. In order to classify an unlabeled data sample, the classifier tests the attribute values of the sample against the decision tree. A path is traced from the root to a leaf node which holds the class prediction for that sample. Decision trees can easily be converted into IF-THEN rules and used for decision-making (Kamber, 1997). ID3 and C4.5 are algorithms introduced by Quinlan in 1993 for induction of decision trees.
The main goal of this project is to evaluate the induction of decision trees for identifying genes and risk factors responsible for the establishment and growth of breast cancer. Achieving this goal involves a large data set including both gene expression data and clinical data. In this project the Gene Logic database will be used, containing this kind of information from more than 6,800 samples of both diseased and healthy patients. About 2,700 of these samples are cancer related. The clinical data available in the database is shown in Table 1 and the expression data that will be used in this project is from chipset HG-U95.
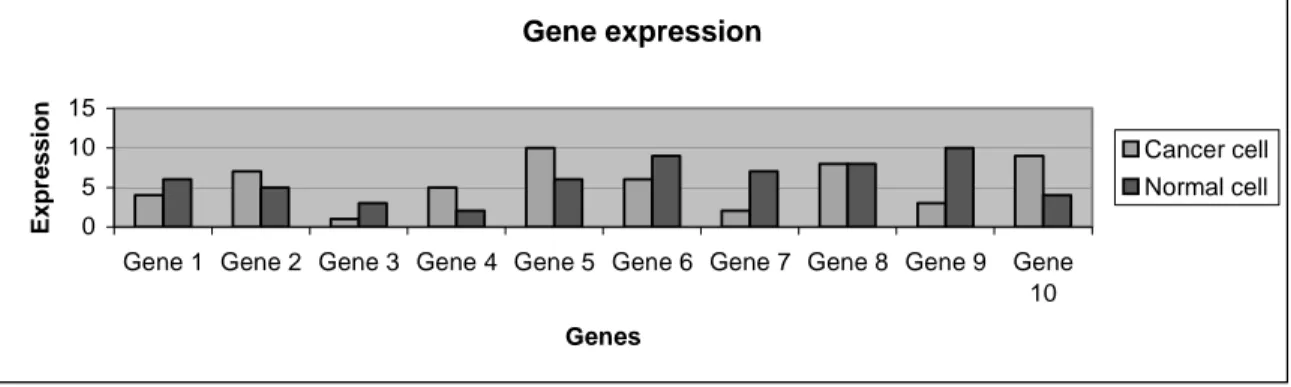
The hypothesis of this project is that decision trees are a useful classification technique in order to find genes and risk factors involved in breast cancer. Genes linked to the onset or prevention of breast cancer may be found by analysis of the gene expression pattern of cells. By comparing the production of gene products in normal and diseased cells one can decide which genes are over-expressed in the cancer cells. An example gene expression profile is shown in Figure 1. The over-expressed genes may then in different ways be involved in breast cancer and may therefore be possible drug targets.
Gene expression
0 5 10 15
Gene 1 Gene 2 Gene 3 Gene 4 Gene 5 Gene 6 Gene 7 Gene 8 Gene 9 Gene 10
Genes
E
x
pr
ession Cancer cell
Normal cell
Figure 1. An example of how a set of genes can differ in expression in cancer cells compared
with normal cells.
The genetic makeup and expression-profile of a cell may thus determine its fate as a normal or cancer cell. Each type of cell expresses a unique combination of genes. The degree to which genes are expressed in a cell can be quantified and displayed in a gene expression profile. Comparing the profiles of normal and breast cancer cells may elucidate which genes play a significant role in breast cancer (Mort, 2000). It is therefore important to determine which genes that are more expressed respective less expressed when cells become cancerous. In this way researchers can gain information about how the presence or absence of some genes is related to breast cancer. Bioinformatic tools must thus be developed in order to
identify different complex patterns when searching for cancer-related changes in gene expression.
This project demonstrates the application of decision tree approaches for the identification of genes and risk factors relevant for the classification of breast cancer patients. Chapter 2 describes the concept of data mining, the application of decision trees in medicine, the C4.5 decision tree algorithm, and the Gene Logic database. Chapter 2 also discusses the main genes and risk factors involved in breast cancer. In Chapter 3, the aims and objectives of this study are presented and the motivations behind this project are discussed. In Chapter 4, three works related to this project are briefly described. Chapter 5 explains the criteria that were used in order to filter the huge amount of data in Gene Logic. This Chapter further describes four different approaches performed in order to analyze the different aspects of the C4.5 algorithm. The resulting decision trees and production rules derived by the C4.5 algorithm are also shown in Chapter 5. In Chapter 6, the resulting decision trees and production rules are analyzed. The results are further discussed in Chapter 7. Finally, in Chapter 8 some conclusions are made while some possible future works are suggested in Chapter 9.
2. Background
This Chapter describes data mining with major focus on decision trees. Also breast cancer and the most central genes and risk factors involved will be discussed. Finally the C4.5 decision tree algorithm is described.
2.1Data mining and decision trees
The term data mining refers to using a variety of techniques to identify information or decision-making knowledge in bodies of data. This concept has become a popular technology in many applications. A large amount of data is handled in these applications where the data has a low value in its raw form since the valuable parts are often hidden in the data. The process of data mining thus generates models that are later used for predictions. With an appropriate learning method, that is, a method that uses the training data set in order to correctly classify new samples, it is possible to develop accurately predictive applications.
A data mining system can accomplish several different data mining tasks. Some of these tasks are described by J. Han (1999) as:
1. Class description. Class description provides a concise and succinct summarization of a
collection of data and distinguishes it from others. Class description should cover not only its summary properties, such as count, sum, and average, but also its properties on data dispersion, such as variance, and quartiles.
2. Association. Association is the discovery of association relationships or correlations among
a set of items. They are often expressed in the rule form showing attribute-value conditions that occur frequently together in a given set of data.
3. Classification. Classification analyses a set of training data and constructs a model for each
class based on the features in the data. A decision tree or a set of classification rules is generated for such a classification process. This can be used for classification of future data where for example one may predict a disease based on the symptoms of the patient.
4. Prediction. This mining function predicts the possible values of some missing data or the
value distribution of certain attributes in a set of objects. It involves the finding of the set of attributes relevant to the attribute of interest and predicting the value distribution based on the set of data similar to the selected object(s).
5. Clustering. This analysis is made to identify clusters, that is, a collection of data objects
specified by the users or experts. In clustering, in contrast with classification, the clusters are not labelled.
6. Time-series analysis. Time-series analysis is used to analyse large set of time-series data to
find certain regularities and interesting characteristics.
In this project, a decision tree model is used as the technique for mining the information in the Gene Logic database, see Section 2.5.
A decision tree is constructed by looking for regularities in data. Once a decision tree has been constructed, it is a simple matter to convert it into an equivalent set of rules. This course of action is simply shown in Figure 2.
Figur 2. The construction of decision trees and decision rules.
A decision tree is a model that is both predictive and descriptive (Kuo et. al. 2001). In other words, a decision tree has the ability to both describe available data and to predict the classification of new data. Decision trees mainly get their name from the resulting models that have the shape of tree structures with decision rules. An example of a decision tree is shown in Figure 3. This technique is mainly used for classifying which certain group a specific case belongs to. Decision trees are therefore believed to be an useful technique in this project in order to extract information about the most important genes and clinical data involved in breast cancer.
Weight > 60
sick
sick healthy
Figure 3. An example decision tree.
Allows us to make predictions on unseen data Decision rules Decision tree Data Weight < 60 Age < 45 Age > 45
2.2Decision trees and applications in medicine
Of particular value to medicine is the requested accuracy and interpretability of the results of data mining (Zupan et. al. 1998).
There are different branches of machine learning; statistical or pattern recognition methods, inductive learning of symbolic rules, and artificial neural networks (Lavrac, 1999). Probably the most promising area for medical data analysis was from the very first beginning, the symbolic learning of decision trees and decision rules. Neural networks on the other hand are more like black box classifiers lacking the transparency of generated knowledge and lacking the ability to explain the decisions (Kononenko, 2001).
According to a study performed by Igor Kononenko (2001), there are some specific requirements that any machine learning system has to satisfy in order to be used in the development of applications in medical diagnosis. These specific features include:
1. Good performance, which refers to the ability of the algorithm to extract significant information from the available data. The diagnostic accuracy on new cases should thus be as high as possible.
2. The ability to appropriately deal with the missing data and with noisy data. This is due to the fact that the description of patients in patient records often lacks certain data. Medical data also often suffers from uncertainty and errors.
3. The transparency of diagnostic knowledge. It is very important for the explanation of decisions to be transparent for the user. It should therefore be possible to analyze and to understand the generated knowledge.
4. The ability to explain decisions and the ability of the algorithm to reduce the number of tests necessary to obtain reliable diagnosis. The system must be able to explain decisions when diagnosing new patients. Also, since the collection of patients in medical practice often is very expensive and time consuming and sometimes also harmful for the patients, it is very desirable for the classifier to reliably diagnose with a small amount of data about the patients.
In the same study Kononenko (2001) compares the appropriateness of various algorithms, including decision trees and neural networks, for medical diagnosis. Among the compared algorithms, only decision tree builders were shown to be able to select the appropriate subset of attributes. This means that, with respect to the criterions of reduction of the number of tests, these algorithms have clear advantage over other algorithms. With respect to
transparency and explanation ability criteria, it turned out to be a great difference between the algorithms tested. The back-propagation neural networks showed to have a non-transparent knowledge representation, which means that they in general cannot easily explain the decisions made. Decision trees on the other hand were fairly easy to understand since the paths from the root to the leaves were shorter, containing few but most informative attributes. In many cases however, one might feel that such a tree, containing only a few nodes after pruning, describes very poorly the diagnoses and is therefore not sufficiently informative. This remains thus to be seen during this project where the decision trees will be tested on breast cancer data from the Gene Logic database.
2.3Cancer
Cells are components of the body and each cell has a fixed lifespan that is described by the cell cycle. The cell cycle has two major periods. In the first period the cell grows and performs its specific tasks in the body while in the second period it reproduces and splits into two new cells (Lodish et. al. 1995). The cell cycle is a very organized process and the cells that are produced are exact copies of the original cell. The growth and division of normal cells goes on continuously in order to produce sufficient amount of new cells that can replace the old and damaged cells (Lodish et. al. 1995).
In cancer cells the growth and dichotomy goes on without any control. This accelerated and uncontrolled growth of cancer cells results in a lump that is called a tumor. Tumors can be either benign or malign. A benign tumor is often harmless and is covered by a membrane that keeps the tumor isolated from the normal surrounding cells (Bristol-Myers Squibb, 2002). Usually a benign tumor grows slowly.
A malign tumor is almost never encapsulated or covered by a membrane. It usually grows faster than a benign tumor and invades the surrounding tissues. This is called infiltration (Bristol-Myers Squibb, 2002). Malign cells also have a capacity to metastasize through the blood and lymphatic systems to distant organs.
Cancer cells deprive nourishment from the normal cells which causes weight- and strength loss among cancer patients (Bristol-Myers Squibb, 2002).
2.3.1 Breast cancer
Breast cancer starts in the breast tissue and like most cancers it is named after the part of the body where it first starts but can later spread to other parts of the body.
As it is shown in Figure 4, the breast is made up of lobules, ducts, and fatty, connective, and lymphatic tissue. Lobules are the glands that make the milk when a woman has a baby and the tubes that connect them to the nipple are called ducts (American Cancer Society, 2002).
Figure 4. A close-up image of the female breast and its constituents (Reprinted by
permission from Anthony Saffioti,American Cancer Society, 2002).
A fluid called lymph is carried in lymph vessels and eventually leads to a collection of tissues called lymph nodes, mostly located under the arm. The lymph fluid contains immune system cells and tissue waste products. If breast cancer cells reach the underarm lymph nodes, there is a greater possibility for the cancer to spread to other organs of the body (American Cancer Society, 2002).
2.3.1.1 Risk factors
The cause of breast cancer is not yet known but there are certain risk factors that are linked to the disease. While all women have the risk of getting breast cancer, a risk factor is anything that increases a person’s chance of getting the disease (American cancer society, 2002). Some risk factors can be controlled while others can not be changed.
Some of these risk factors are described by M. Jönsson (2000) and include:
Gender: While breast cancer usually affects women, men can also get breast cancer,
although this is rare. The risk of developing breast cancer is estimated to be 100 times higher for a female.
Age: About 20% of the women that get breast cancer are under the age of 50
(Lidbrink, 2001). The chance of getting breast cancer thus increases as women get older. However, the rate of breast cancer incidence slows somewhat between the ages of 45-50 years. According to Lidbrink (2001) this must be due to the hormonal changes that arise during the menopause.
Family history and genetic risk factors: Breast cancer risk is higher among women
whose close blood relatives have or have had this disease. It is estimated that at least 5% of women with breast cancer have a true hereditary predisposition. These cases appear often as an effect of a single genetic abnormality in genes that are involved in predisposition to hereditary breast cancer such as BCRA1 and BRCA2.
Menstrual periods: Menarche represents the development of the mature hormonal environment of a young woman. Women who began having periods early, that is, before the age of 12, or who went through the menopause after the age of 55 have a small increased risk of breast cancer.
Age of pregnancy:The majority of studies have shown that a younger age at first full-term pregnancy predicts a lower lifetime risk of developing breast cancer while a first full-term pregnancy after the age of 30 increases the risk (Ranstam & Olsson, 1995). Alcohol: Alcohol consumption has gained attention as a possible risk in the
development of breast cancer. Consistent findings on the relationship between alcohol and risk of breast cancer seem to exist only for a relatively high consumption
(Ranstam & Olsson, 1995).
Smoking: There have been conflicting evidence in the literature on the relationship
between smoking and breast cancer but there is presently no strong support for this relationship (Mesko et. al. 1990).
Obesity: Being overweight appears to be associated with a higher risk of
post-menopausal breast cancer in most studies. However, some studies show that obesity might be slightly correlated with a decreased risk of breast cancer in pre-menopausal women (Pujol et. al. 1997).
The three last mentioned risk factors and also a patients age will be analysed and studied during this project in order to further evaluate the role of these four risk factors in breast cancer development. This is due to the fact that there has been a lot of research regarding the relations between these risk factors and breast cancer and it will therefore be interesting to find out if the resulting decision trees will reflect the relations described by different researchers.
2.3.1.2 Major genes
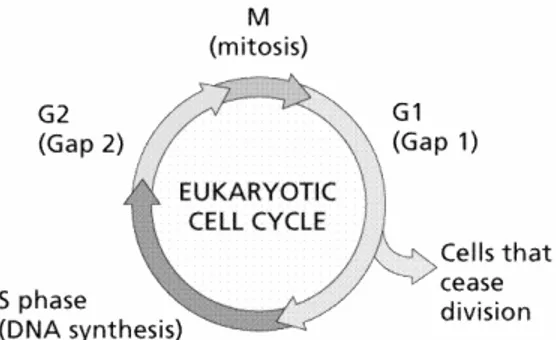
Breast cancer, like other cancer types is a disease of the cell cycle, see Figure 5 (Ingvarsson, 2000). Cell cycle disturbance is therefore thought be the main cause of cancer growth.
Figure 5. Illustration of the eukaryotic cell cycle (Reprinted by permission from
William E. Camelet,Lake Michigan College, 2002).
Genes that are differentially expressed in tumor tissues compared with normal tissues are potential diagnostic markers and drug targets. Progress has been made toward a better understanding of breast tumorigenesis and several markers have been identified. A few of the major genes involved in breast cancer are shortly described below.
• ErbB2
The tyrosine kinase receptor ErbB2, also called HER2/neu, is a member of the epidermal growth factor receptor (EGFR) family (Wang & Hung, 2001). This gene has been shown to be amplified/over-expressed in approximately 25-30% of invasive breast cancers in human (Mendelsohn & Baselga, 2000). ErbB2 encodes a transmembrane glycoprotein with tyrosine kinase activity that functions as a growth factor receptor. ErbB2 is thus important in breast cancer growth, accessible as a cell surface receptor, and is expressed at high levels in breast cancer and at low levels in normal tissue (Schnitt, 2001).
• C-myc
C-myc is involved in the regulation of the transcription of other genes important for cell growth regulation (Jönsson, 2000). Over-expression of Myc transcription factor runs the cell through the cell cycle. Amplification of this oncogene has been reported in 20% of primary breast tumors (Dairkee & Smith, 1996).
• Cyclin D
A small gene family encodes three different D-type cyclins called D1, D2 and D3. These are referred collectively as Cyclin D (Lodish et. al. 1995). An increase in Cyclin D eventually results in progression throughout the G1 and S phase of the cell cycle (Ingvarsson, 2000). Cyclin D is one of the most commonly over expressed proteins in breast cancer (Hynes & Dickson, 1996).
• p53
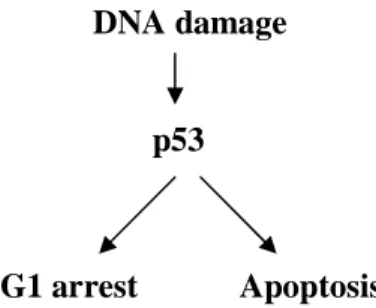
p53 is a cell cycle-regulating transcription factor (Hynes & Dickson, 1996). p53 is the most common genetic change found in breast cancer (Dairkee & Smith, 1996). Losses and/or mutations of p53 occur in about 40% of the breast cancer cases (Hynes & Dickson, 1996). The lack of p53 leads to increased rates of DNA alternation-mutations in the cells (Lodish et. al. 1995).
p53 has the ability to check cell-cycle progression and hold cells in quiescence or even lead cells to commit suicide, apoptosis, unless conditions are appropriate for cell-cycle progression (see Figure 6). This gene is therefore considered to be a tumor-suppressor gene which means that it can prevent cells from becoming cancerous (Lodish et. al. 1995).
DNA damage
p53
G1 arrest Apoptosis
Figure 6. p53 has a central role in cell division, maintenance of genetic integrity
• Rb
The Retinoblastoma (Rb) gene is also considered to be a tumor-suppressor gene (Lodish et. al. 1995). The Rb gene product is a nuclear phosphoprotein with DNA-binding properties (Dairkee & Smith, 1996). This product is associated with several other proteins as a means of regulating cell growth primarily at the G1 phase. Rb functions as a proliferation-inhibiting gene and its inactivation by a variety of mechanisms can finally lead to disease development (Jönsson, 2000).
• Wnt-5a
This gene has been proposed to be a novel tumor-suppressor gene and its lost has been shown to be related with an increased risk of breast cancer. A function suggested for the Wnt-5a gene is a role in the blocking of cell movement.
Wnt-5a can thus prevent tumor-cells from migration and metastasizing (Jönsson, 2000).
• BRCA1 and BRCA2
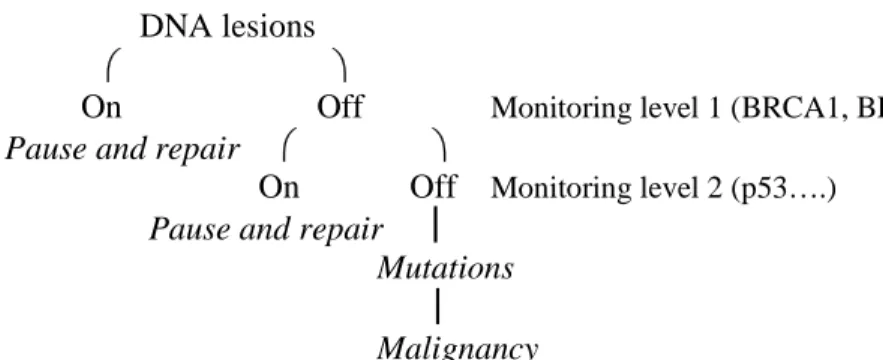
Germline mutations in either BRCA1 or the BRCA2 gene are responsible for the majority of hereditary breast cancers (Feunteun, 1998). These two genes play a role in monitoring and/or repairing DNA lesions, see Figure 7. The relaxation of this monitoring caused by mutations of either of these two genes leaves un-repaired events, leading to accumulation of mutations and finally to cancer (Hedenfalk et. al. 2001).
DNA lesions
⎛ ⎞
On Off Monitoring level 1 (BRCA1, BRCA2….)
Pause and repair ⎛ ⎞
On Off Monitoring level 2 (p53….) Pause and repair ⎮
Mutations ⎮ Malignancy
Figure 7. The above model illustrates the flow of possible events leading to
In Figure 7 the BRCA1 and BRCA2 genes work as genome caretakers, that is, molecules that act as sensors of DNA lesions and participate in repair processes. p53 works as a gatekeeper, that is, a molecule that directly controls the progression of the cell cycle. The right side of the model illustrates the events leading to cancer whereas the left side illustrates the alternative pathways that are taken when the monitoring of DNA lesions is fully active (Feunteun, 1998).
2.4 The Gene Logic database
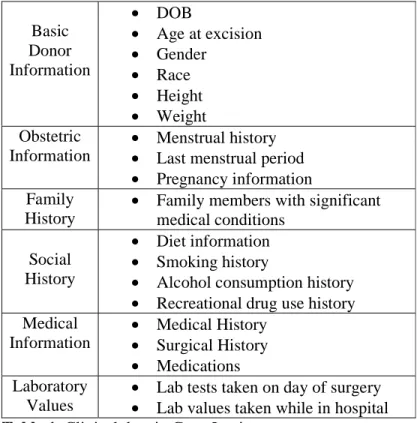
The Gene Logic database contains gene expression data and clinical data from more than 6,800 samples. About 2,700 of these samples are cancer related. Most of the expression data is gained from the Affymetrix technology, containing gene expressions from human, rat and mouse. In this project, only the information from chipset HG-U95 will be used. Gene Logic contains gene expression data from 65,000 transcripts in human. Gene Logic also contains a list of clinical data, which are shown in Table 1.
Basic Donor Information • DOB • Age at excision • Gender • Race • Height • Weight Obstetric Information • Menstrual history
• Last menstrual period
• Pregnancy information Family
History
• Family members with significant medical conditions
Social History
• Diet information
• Smoking history
• Alcohol consumption history
• Recreational drug use history Medical Information • Medical History • Surgical History • Medications Laboratory Values
• Lab tests taken on day of surgery
• Lab values taken while in hospital
Table 1. Clinical data in Gene Logic.
The HG-U95 chipset used in this project contains both quantitative and qualitative measures of the gene expression profiles. The quantitative measures are called Average difference. These measures are described by a real number. The measures in Gene Logic are normalized
and no negative values of average difference exist in the database. The qualitative measures on the other hand are called Abscall. These measures use the values ‘present’ (P), ‘absent’ (A) and ‘marginal’ (M) to describe the expression of a gene in Gene Logic. Abscall uses a threshold to place different genes in these three categories. The threshold is set by Affymetrix in a confidential manner but it is considered to be statistically correct. If the expression of a gene is over the threshold, the expression has been detected in the tissue and the gene is thus said to be ‘present’. On the other hand, if a gene’s expression has not been detected in the tissue, it is said to be ‘absent’. This does however not mean that genes in the ‘absent’ category surely are not expressed. It only means that the expression of these genes has not been detected or that the expression has not been possible to measure. The expression of the genes in the ‘marginal’ category are thought to be somewhere in between the expression of the genes in the ‘present’ and the ‘absent’ categories. The ‘marginal’ category is thus more like a gray-zon. In a few cases, the expression of a gene can also be presented by a zero (0). This means that the expression of that gene has not been examined for the patient and thus no results are found.
2.5 The C4.5 algorithm
Several systems for learning decision trees to correctly classify samples have been proposed. Prominent among these are ID3 and its new version C4.5 (Nilsson, 1996). C4.5 is a software extension of the basic ID3 algorithm designed by Quinlan in 1993. Given a set of classified examples, the ID3 algorithm can induce a decision tree biased by the gain measure. This measure is aimed to minimize the number of tests needed for classification of a new object. The gain measure is the standard information entropy difference achieved at node x and it is expressed as:
Gain(x) = info(T) – infox(T)
Gain(x) thus represents the difference between the information needed to identify the class of an element of the training set T and the information needed to identify the class of an element of T after the value of attribute x has been obtained. In other words, this ratio represents the gain in information due to attribute x (Quinlan, 1993).
The gain measure introduced above has however been shown to have a serious weakness since it has a strong bias in favour of tests with many outcomes. To avoid this problem, the C4.5 algorithm was introduced using a combination of gain and gain ratio criteria (Quinlan, 1993). The gain ratio criterion uses the measure of SplitInformation defined as:
SplitInformation (x) = -
∑
=
n
i 1
( | Ti | / | T | ) * log 2 ( | Ti | / | T | )
where T is the number of samples in the training set and Ti is the partition of T induced by
attribute x. SplitInformation represents the potential information generated by dividing the training set T, on the basis of the value of the categorical attribute x, into n subsets.
The gain ratio measure, used by the C4.5 algorithm, is defined as GainRatio (x) = Gain (x) / SplitInformation (x)
and expresses the proportion of information generated by the split, that is, the information that appears helpful for classification. If the split is trivial, the split information will be small and this ratio will be unstable. The gain ratio criterion therefore selects a test to maximize this ratio as long as the numerator, that is, Gain (x), is larger than the average gain across all tests examined (Quinlan, 1993).
An essential property of the C4.5 algorithm is called pruning. Pruning of a decision tree is done by replacing a whole subtree by a leaf node. The replacement takes place if a decision rule establishes that the expected error rate in the subtree is greater than in the single leaf. Pruning is a method most widely used for obtaining appropriately sized trees and there are different kinds of techniques for pruning. C4.5 uses pessimistic pruning to prevent overtraining. The pessimistic pruning uses a statistical method to calculate the error rate associated with each node and to adjust the tree to reflect bias. Thus, this pruning technique pessimistically increases the errors observed at each node using statistical measurements to encourage pruning.
According to Quinlan (1993), the advantages of pessimistic pruning over other pruning methods include:
1. It builds only one tree.
2. It does not require held out training data for error estimation. 3. It provides a more reliable tree when data is scarce.
The C4.5 algorithm can also address other issues not dealt with by its predecessor ID3. Some of these issues include:
• Handling and incorporation of numerical (continuous) attributes, in this case ‘age’ and ‘BMI’.
• Dealing with incomplete information (missing attribute values), in this case some values of ‘alcohol status’ and ‘smoking status’.
• Avoiding overfitting to the data by determining how deeply to grow a decision tree.
• Post-pruning after induction of trees in order to increase accuracy and avoid overfitting.
• Improving computational efficiency.
Another property of C4.5 is rule derivation, where rules are derived from the decision tree. A principal aim of decision tree models is that it should be intelligible to human. C4.5 thus tries to achieve this goal by re-expressing a classification model as production rules, a format that appears to be more intelligible than trees (Quinlan, 1993). At first, a rule is written for each path in the decision tree from the root to a leaf. The left-hand side (L) of a rule is easily built from the label of the nodes and the labels of the arcs, whereas the right-hand side (R) is a class, L Æ R. The rules derived by some paths may have an unacceptably high error rate or may duplicate rules derived from other paths. The process therefore usually yields fewer rules than the number of leaves on the trees. The resulting rule set can then be further simplified and reduced. Some of the conditions on the left-hand side of the rules may be eliminated. The left-hand side of those rules will then be replaced by new conditions (L’). This replacement happens only if the proportion of the training set that satisfy respectively L and L’ are equal (Quinlan, 1993). For example, consider the following simple rule:
AGE > 20
ALCOHOL_STATUS = NEVER_USED AGE > 36
-> class NON_CANCER
The C4.5 algorithm may eliminate the first condition of the above rule (Age >20). This can happen if this condition covers a single or only a few instances, for example, if only 1 patient in the data set is between the ages of 20 and 36. In that case, the first condition may not be considered, by the C4.5 algorithm, to contribute to the classification of samples and the C4.5 algorithm might therefore simplify the rule to:
ALCOHOL_STATUS = NEVER_USED AGE > 36
-> class NON_CANCER
It is however also conventional to define a fallback or default rule that comes into play when no other rule covers a case. A reasonable choice for the default class would be that class
which appears most frequently in the training set. The system therefore simply chooses the class which contains the most training cases, not covered by any rule, as the default class. The system will in this way be in favor of the class with the higher absolute frequency.
An extension of the C4.5 algorithm, called C5.0, has also been developed. The Unix program C5.0 and its Windows counterpart See5 (Quinlan, 1996) are considered to be superior to the C4.5 algorithm in several ways. For instance, C5.0 has several new data types in addition to those available in C4.5, C.5 is more than 200 times faster than C4.5, and it incorporates several new facilities such as variable misclassification costs, instead of treating all misclassifications as equal. However, since only incomplete demonstration versions of the C5.0 software are available for free, the C4.5 algorithm is instead used in this project.
3.
Problem definition, hypothesis and motivations
This disease mining project will explore the possibilities of data mining on the Gene Logic database, containing gene expression data and clinical data for thousands of samples taken from both diseased and healthy tissue. The problem definition is to create a general method for the development of decision trees in order to extract valuable information regarding the major genes and risk factors involved in different diseases. The method will in this project be tested on the breast cancer data found in the Gene Logic database. The main goal is thus to develop a method that can isolate drug targets by identifying genes that are modulated in breast cancer, and which vary with clinical parameters associated with this disease.
The hypothesis is that decision trees are a useful classification technique in the disease mining project. Consequently, with this technique it may be possible to mine through an amount of gene expression data and clinical data in order to classify patients correctly. It may thus be possible to extract valuable information about the main genes and risk factors involved in breast cancer.
There are a couple of different ways to define the concept of ‘useful classification technique’ mentioned in the hypothesis. When is it adequate to state that the hypothesis is true respective false? Well, the resulting decision trees can differ dependent on how many genes and risk factors that are classified correctly. Even if the decision trees don’t classify all the genes and risk factor correctly, as described by different literatures, it might still be an ‘useful’ classification technique depending on the amount of genes and risk factors classified correctly in comparison with the total amount of attributes present in the resulting tree. If the decision tree for example correctly identifies three out of five attributes, there is good reason to further analyze the two new attributes in order to find out if and in what way these are involved in breast cancer. Probably the simplest and most profitable way to evaluate the classification performance of a created decision tree in this project, is to compare the gained classification results with classification results made by a very simple randomized algorithm, where the classifications is made in a random manner. This randomized algorithm is an algorithm where the distribution of the cancer and non-cancer patients in the data set is known. If this algorithm gives better classification results than the decision trees created by the C4.5 algorithm, the created decision trees will be regarded as insignificant and the application of decision trees on the Gene Logic data will therefore be dismissed. Otherwise, the C4.5 decision tree algorithm will be considered to be a better classification technique, compared with the randomized algorithm, for the classification of data in the Gene Logic database.
It’s important to remember that there is still much that is unknown about breast cancer and therefore any kind of technique that gives more significant classification results than randomly made classifications, must be considered useful. In other words, any classification technique that in some way simplifies an earlier diagnosis of the breast cancer and also simplifies the separation of cancer and non-cancer patients, is very valuable and should be further investigated and developed.
One motivation behind this disease mining project is the fact that very little attention has been given to the potential of applying decision trees to the kind of data found in the Gene Logic database, see Chapter 4. The rise in attention and focus on decision support solutions using data mining techniques has become a big interest in different classification modelling (Apte & Weiss, 1997). Decision tree and decision rule solutions offer a level of interpretability that is unique since these tree-like solutions are often easy to understand, even for the non-technical users.
Another motivation is that the data content of the Gene Logic database is quite new and has not yet been fully analysed. It is therefore interesting to examine if the conclusive results illustrated by the final decision trees will agree with the findings of the important genes and risk factors involved in breast cancer so far. The decision tree may also shed some light on new, unknown genes and risk factors involved in breast cancer.
3.1Aims and objectives
• Selection of an appropriate amount of data from the Gene Logic database. In order to extract valuable information it is important to only consider the amount of data necessary for the creation of decision trees. Otherwise it might become very difficult to extract any kind of interpretable information from the resulting trees. In order to increase the probability of selecting the right amount of data, a lot of literatures concerning the main genes and risk factors involved in breast cancer, will be read. The LocusLink website, at the NCBI homepage (http://www.ncbi.nlm.nih.gov), will also be used as a tool in order to find the known breast-related genes. The expression profiles of these genes will later be used as input to the decision tree algorithm.
• Installation of software for the creation of the decision trees. Several different methods exist for the generation of decision trees and the results vary significantly depending on the chosen method. In this project the C4.5 algorithm, induced by
Quinlan in 1993, will be used. This software is an extension of the basic ID3 algorithm and is therefore believed to better handle situations where ID3 has shown certain weaknesses, see Section 2.5.
• Deriving decision trees and production rules based on gene expression data. Gene expression data will be used as input to the C4.5 algorithm in order to find relevant breast cancer markers that can separate cancer patients from non-cancer patients in Gene Logic. This approach is thus performed in order to investigate the capacity of the C4.5 algorithm in diagnosing patients on the basis of gene expression data.
• Deriving decision trees and production rules based on risk factor data. Risk factor data will be used as input to the C4.5 algorithm in order to investigate the capacity of the C4.5 algorithm in diagnosing Gene Logic patients based on only risk factor data. In this way it may be possible to shed light on the risk factors that are most important in the development of breast cancer.
• Deriving decision trees and production rules based on both gene expression data and risk factor data. Gene expression data and risk factor data will be used as input to the C4.5 algorithm in order to investigate the capacity of C4.5 in diagnosing patients when the two data sets are combined.
• Deriving decision trees and production rules based on the expression of different probes of breast cancer related genes. In this way it may be possible to suggest genes involved in different signalling pathways during breast cancer.
• Evaluation of decision trees, production rules and the performance of the C4.5 algorithm.
o The performance of the decision tree algorithm in classifying patients correctly will be evaluated through comparisons with the classification performance made by a simple algorithm, where the sample classifications are done in a random manner. In this way it is possible to determine if the classification performance of the decision trees created by C4.5 is better
than the classification performance of the randomized classification algorithm.
o The resulting decision trees and production rules created for the illustration of different signalling pathways will be evaluated through comparisons with existing literature. In this way it is possible to find out if the resulting trees really reflect the relations and pathways described by different researches within the molecular biology of breast cancer.
4. Related
work
Only a few previous works have been done regarding decision trees and breast cancer studies. Some articles concerning the use of decision tree models are described below. However, none of the articles mentioned below apply the use of decision trees on the kind of gene expression- and risk factor data that will be used in this project. It is therefore very hard to compare this project with these related works in order to analyse and evaluate the different approaches used. This situation has both its advantages and disadvantages. The advantage is that this project explores a new and unknown area that might contribute with very interesting and valuable results important in different medical approaches and for earlier patient diagnosis. The disadvantage is of course that the evaluation of the resulting trees will be more difficult because there is no previous works to compare the resulting trees with. In other words, it is not possible to get any tips or ‘warnings’ from studies and research done within this area since searches against PubMed to current date (2002-04-18) do not show any similar approaches compared with this project.
However, in a study performed by Pendharkar et. al. (1999) the authors attempted to illustrate how different data mining approaches can be used to predict and diagnose the occurrence of breast cancer. According to this paper researchers have previously used several statistical and artificial intelligence approaches for predicting breast cancer and these studies have indicated that artificial intelligence approaches can be successfully applied in this way. In the study of Pendharkar et. al., artificial neural networks (ANN) and data envelopments analysis (DEA), for binary classification problems, are used and compared as tools for mining breast cancer patterns. The results indicate that neural networks outperform DEA in terms of prediction accuracy. However, one of the problems described concerning data mining techniques is the wide variety of approaches that can be used. This makes the selection of a particular technique that “best” matches a given problem a difficult task. In the study made by Pendharkar et. al., the authors specially emphasize on how association rules can play an important role in the prediction of cancer development and the authors also discuss the future possibilities of using the ID3 machine learning technique for the generation of decision trees from existing breast cancer data. In order to further explore these possibilities mentioned by the authors, this project will use the C4.5 decision tree algorithm on breast cancer data found in Gene Logic. In other words, the C4.5 algorithm will be used instead of the ID3 algorithm since this algorithm is the new version of ID3 and thus introduces a number of extensions.
Another study that focuses on the growing demand for decision model approaches for problems in medicine and health care was written by Bohanec et. al. (2000). The authors present an approach to the development and application of hierarchical decision models that is based on an expert system shell for multi-attribute decision support, DEX. They demonstrate the applicability of this approach presenting different real-life applications in health care including the assessment of breast cancer risk. A prototype model is developed in order to assess the risk of breast cancer. The risk of cancer is evaluated by decision rules that are defined by the experts. In other words, the models presented in the study of Bohanec et. al. were developed “manually”, that is, through the collaboration between the experts and decision analysts, who used DEX mainly as a computer-based editor and storage of models. The study of Bohanec et. al. thus only uses information about the risk factors of breast cancer for the creation of decision trees. In this project however, both risk factor data and gene expression data will be used for the creation of decision trees and production rules. In other words, this project also explores the possibilities of using gene expression data as input to the C4.5 algorithm.
In 2001, Kuo et. al. performed a study where breast masses in a series of pathologically proven tumors were evaluated using data mining with decision tree model for classification of breast tumors. Regions of interest of ultrasound images and co-variance texture parameters were used as the inputs to construct the decision tree model. C5.0 algorithm was used for the construction of decision trees. Summary of performance between an experienced physician and the proposed data mining model provided evidences for good diagnosis of breast tumors with the proposed method. Since the results from this study provided evidences for good diagnosis of breast tumors, the disease mining project performed here will also make use of the decision tree model for the analysis of breast cancer data, found in Gene Logic. In this project however, the C4.5 algorithm will be applied on different kinds of input data, compared with the study performed by Kuo et. al. (2001).
5.
Methods and results
This Chapter describes the data and the methods used during this project. The resulting decision trees and production rules are also presented.
5.1 Filtration of data
As it was mentioned in the first objective shown in Section 3.1, one of the first steps in this project is to select an amount of data from the Gene Logic database to work with when running the decision tree program. This amount should not be too large but it should not be too small either. A too small amount of data could be overfitted by the decision program and may therefore give the wrong impression about the effect of attributes on the cause and development of breast cancer. A too large amount of data on the other hand, consisting of many samples and attributes, may cause some problems when it is used as input to the C4.5 algorithm. One problem could for example be caused by long running times when creating the decision trees. This project will focus on data concerning female patients of all ages in the database. The female patients should all have values on certain specific attributes. These attributes include BMI, age, alcohol status and smoking status. Since there has been a lot of research regarding the relations between these four risk factors and breast cancer, it will be interesting to find out if the resulting decision trees and production rules will reflect the relations described by different studies. The values of height and weight in gene Logic will be used in order to calculate the body mass index (BMI) of each patient. This value is a measure that correlates with fatness. To determine BMI, weight in kilograms is divided by height in meters squared, BMI = Kg / (m)2. A BMI of 25 to 29.9 is considered overweight and one of
30 or above is considered obese (National Heart, Lung and Blood institute, 2002).
The patients selected from the database must also have gene expression values (abscall values) for 108 specific genes earlier chosen from the LocusLink homepage, at NCBI. These genes were gained when the word ‘breast’ was used as a keyword against the LocusLink database. These 108 genes, shown in appendix A, are thus known to be breast-related in humans and it is therefore very interesting to study their differences in gene-expression between non-cancer patients and patients suffering from breast cancer.
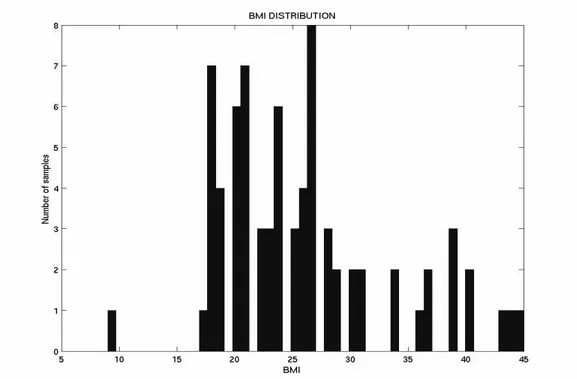
The above described filtrations of the data in Gene Logic results in a total of 75 patients that in all ways match the criteria set. 53 of these patients suffer from breast cancer whereas 22 patients are non-cancer samples. In Figure 8, the age distribution of the 75 patients in the data set is shown, whereas Figure 9 shows distribution of BMI values for the 75 patients.
Figure 8. The age distribution of the 75 patients. The samples
are distributed between the ages of 16 and 74.
Figure 9. The distribution of BMI values for the 75 samples in
The association between the ‘age’ and the ‘BMI’ values in the data set, containing values for the 75 samples, is plotted in the diagram shown in Figure 10.
Figure 10: Plot showing the association between the ‘age’
and the ‘BMI’ values for the 75 samples in the data set.
As it can be seen in Figure 10, no association exists between the values of BMI and age. Thus, the values of these two attributes are completely independent of each other.
As mentioned earlier, only the abscall measures of the gene expressions data will be considered when comparing gene expression profiles of cancer and non-cancer patients. This is because, the average difference measures of gene expression are very much time-dependent and also very individual, see Section 2.4. Thus, these measures are very context specific and might therefore vary tremendously depending on the patient and the time of the day that the measures were taken. The abscall measures on the other hand can handle a greater amount of noise and are thus considered to be more appropriate for this study.
5.2 Deriving decision trees and production rules
The C4.5 algorithm is implemented in the C programming language and it runs on a Unix platform. The only parameter used in the C4.5 algorithm is the decision variable. This means that all the performed runs are very similar except for the fact that different decision variables
are used in different runs. The decision variables are chosen depending on which aspect of the C4.5 algorithm is being analyzed. Another difference between the performed runs is that different data sets are used as input for each run. This is done in order to study the classification performance of C4.5 when different kinds of data sets are used as input to the algorithm.
In this project, four decision tree approaches are performed. Different kinds and amounts of data are used as input to the C4.5 algorithm when creating the decision trees. The resulting trees therefore have different decision variables and illustrate different aspects of the data. In this way it is possible to analyze the different perspectives of the application of decision trees on the kind of data found in the Gene Logic database. As mentioned earlier, four different tests were set and examined. These tests and the results gained are presented below.
5.2.1 Expression of 108 breast-related genes as input data
By using the abscall values for the expression of the known breast-related genes as input to the C4.5 algorithm, it may be possible to create a decision tree that can identify the genes important for the classification of breast cancer samples. Thus the decision tree may be able to separate cancer patients from non-cancer patients considering only the expression of a set of breast-related genes.
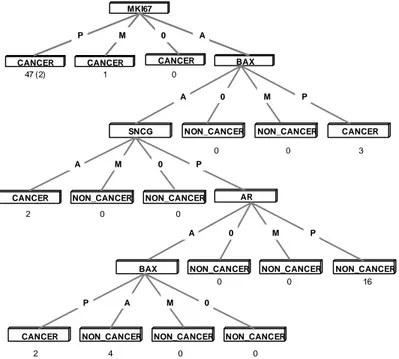
In this test, the expression profiles of 108 genes, shown in appendix A, represented by abscall values for each patient were used as input. The input data thus contained 75 different sets of abscall values. This input resulted in the pruned decision tree shown in Figure 11.
The resulting decision tree in Figure 11 presents four genes, out of the 108 genes tested, whose expressions are considered to be most relevant in order to separate cancer patients from non-cancer patients in the data set used. The apoptosis-related gene BAX is shown twice in the resulting tree. This is because two different probes of BAX were earlier used on the HG-U95 chipset. Since BAX appears twice as a significant marker in the decision tree, the presence of BAX is identified by C4.5 as a strong marker of breast cancer. However, the greatest marker of breast cancer according to the resulting tree is the expression of a nuclear antigen called MKI67. As it can be seen in Figure 11, 2 out of 47 instances belonging to the path “if MKI67 = P then cancer” have been misclassified. The expression of MKI67 is however still present in 45 out of 53 cancer patients and is therefore considered to be a valuable marker. This is also indicated by the fact that the remaining data set, consisting of 28 patients where the expression of MKI67 is not present, only contains 8 patients suffering from
breast cancer. According to Figure 11, the presence of androgen receptor (AR) and the absence of a gene called synuclein-gamma (SNCG) also seem to contribute to the separation of cancer and non-cancer patients. The final results from this run further showed that the decision tree in Figure 11 correctly classified 53 cancer patients and 20 non-cancer patients. In other words, only 2 patients were misclassified by the below decision tree.
MKI67
CANCER CANCER CANCER BAX
SNCG NON_CANCER NON_CANCER CANCER
CANCER NON_CANCER NON_CANCER AR
NON_CANCER NON_CANCER
NON_CANCER BAX
CANCER NON_CANCER NON_CANCER NON_CANCER
P A M 0 2 4 0 0 A 0 M P 0 0 16 A M 0 P A 0 M P P M 0 A 47 (2) 1 0 3 0 0 2 0 0 P M 0 A
Figure 11. The pruned decision tree gained when the abscall values of 108
breast-related genes were used as input. Four genes (MKI67, BAX, SNCG, and AR) are identified by this tree. The symbol ‘P’, in the above tree, stands for ‘present’ and indicates when a certain gene is expressed. ‘A’ stands for ‘absent’ and is used when the expression of a gene is not detected. The ‘M’ symbol denotes an expression between the symbols ‘P’ and ‘A’. Finally, ‘0’ (zero) denotes a situation where the expression of a gene has not been examined for the patient. The first number beneath each node of the tree denotes the number of instances, out of the total number of cases, which belong to that path in the tree. This number may be followed by a second number in a parenthesis, for example, 47 (2). This second value (2) denotes the number of classification errors encountered out of the total number of classifications made from the data in that particular path of the decision tree (47).
The set of production rules induced by this approach, where gene expression data is used as input to the C4.5 algorithm, are presented below. Every enumerated rule is composed of one or several attribute-values and a resulting classification. For instance, the first production rule below indicates that the presence of MKI67 expression is an indicator of patients suffering from breast cancer.
1. MKI67 = P Æ class CANCER 2. BAX = P Æ class CANCER 3. AR = P BAX = A SNCG = P MKI67 = A Æ class NON_CANCER 4. AR = A BAX = P Æ class CANCER 5. BAX = A SNCG = P MKI67 = A Æ class NON_CANCER 6. SNCG = A Æ class CANCER
The above production rules are analyzed in Section 6.1.
As described in Section 2.5, production rules are generated by writing a rule for each path in the decision tree from the root to each leaf. Some of the conditions on the left-hand side of each rule may then be eliminated and simplified. Therefore usually fewer rules are created compared to the total number of leaves in the trees. The first production rule shown above, derived from the decision tree shown in Figure 11, covers 47 patients where the expression of MKI67 is present. This path can be seen at the top of the decision tree shown in Figure 11. Acoording to Figure 11, the second production rule shown above covers 3 cancer patients where the expression of BAX is present. This rule is gained with the first probe of the BAX gene, which has been identified as the second most relevant attribute in Figure 11. As can further be seen, the third production rule derived from the decision tree in Figure 11 covers 16 non-cancer patients in the data set. This rule is gained by following the decision tree branches starting at the the top of the tree where the expression of MKI67 is absent, corresponding to the fourth condition of the production rule, MKI67 = A. Eventually, by following the second, the third, and finally the first condition of the rule , this rule will correctly classify 16 non-cancer patients. As can further be seen in Figure 11, the fourth derived production rule shown above covers 2 cancer patients. This rule consists of AR and the second probe of the BAX gene, which has been identified as the fourth most relevant attribute in the decision tree.
According to Figure 11, the fifth derived production rule again classifies the 16 non-cancer patients who were earlier covered by the third production rule mentioned above. The fifth production rule is thus very similar to the third production rule. However, accoding to Figure 11, the fifth production rule also covers 4 additional non-cancer patients in the data set. This rule is thus gained by following the path starting at the top of the tree where the expression of MKI67 is absent. By then following the first and then the second condition of the rule, this rule will correctly classify a total of 20 (16+4) non-cancer patients. However, the fifth production rule misclassifies the 2 cancer patients shown at the bottom of the tree in Figure 11, where the second probe of the BAX gene is present. Finally, the sixth production rule shown above covers the 2 cancer patients where the expression of SNCG is absent.
The sum of unique patients covered by each of the above described production rules is however 74, even though the data used as input to the C4.5 algorithm contains 75 patients. This is because the input data contains 1 cancer patient where the expression of MKI67 is ‘marginal’. This patient has therefore not been covered by any of the six above production rules derived from Figure 11. However, as earlier mentioned in Section 2.5, a default class is defined during each decision tree run and this class comes into play when none of the derived production rules can cover a case. The default class is set to the class which appears most frequently in the input data. The default class during this approach, where gene expression data was used as input to the C4.5 algorithm, was thus set to ‘cancer’ since the input data contains 53 cancer patients and only 22 non-cancer patients. In other words, the patient following the path “if MKI67=M then cancer” was correctly classified due to the defined default class.
In order to get an indication of how well this decision tree approach will do when it is asked to classify ‘new’ patients based on their gene expression data, a 5-fold cross validation was performed. Cross validation is a model evaluation method that is often used in order to prevent overfitting.
In K-fold cross validation the data set is divided into k subsets, and the holdout method is repeated k times. Each time, one of the k subsets is used as the test set and the other k-1 subsets are put together to form a training set, each time resulting in a new decision tree. Then the average error across all k trials is computed. The advantage of this method is that it matters less how the data gets divided (Schneider, 1997). Every data point gets to be in a test set exactly once, whereas it gets to be in a training set k-1 times. As mentioned earlier, the data set in this project contains 75 different samples (patients) and thus a 5-fold cross validation was performed where the patients in each data set were randomly chosen. Each test
set contained 15 cases whereas each training set contained 60 cases. For each training set a decision tree was built and tested on a corresponding test set. All the decision trees created during the cross validation procedure again identified the four genes presented in Figure 11, that is, MKI67, BAX, SNCG, and AR, even though the exact tree topology differed a bit between the created trees. The cross validation procedure resulted in the classifications shown in Table 2. In other words, the cross validation procedure again indicated the value of these four genes for the separation of cancer respective non-cancer patients.
Data set
Correctly classified
Misclassified Error Correctly classified Misclassified Error 1 60 (44/16) 0 (0/0) 0.0% 13 (9/4) 2 (0/2) 13.3% 2 58 (38/20) 2 (0/2) 3.3% 13 (13/0) 2 (2/0) 13.3% 3 58 (40/18) 2 (0/2) 3.3% 15 (13/2) 0 (0/0) 0.0% 4 58 (42/16) 2 (0/2) 3.3% 13 (9/4) 2 (2/0) 13.3% 5 56 (48/8) 4 (0/4) 6.7% 13 (5/8) 2 (0/2) 13.3%
Table 2. Columns 2-4 present the classification results for the 5 training sets, each containing
60 samples. Columns 2 and 3 give information about the number of correctly classified respective the number of misclassified samples in each data set. The first number in the parentheses, shown in columns 2 and 3, represents the number of cancer patients in each data set. This number is followed by a second number which represents the number of non-cancer patients in each of the data sets. Column 4 presents the error percentage gained during the classifications. The three last columns in this Table present the same kind of information for the five test sets, each containing 15 samples. Note that the distribution of cancer and non-cancer patients varies in each of the test sets.
Column 5 and 6 in Table 2 show the number of correctly classified and misclassified patients in the five different test sets. In parentheses, also shown in these two columns, is the number of cancer patients in each data set. This number is followed by the number of non-cancer patients in each of the data sets. The same kind of information is shown in columns 2 and 3 for the training sets. The number of classification errors and their corresponding error percentage of the total number of cases are shown in column 3 and 4 for the training sets, and in column 6 and 7 for the test sets.
In order to further evaluate the performance of the decision tree approach, when using gene expression data as input, the mean value for the error percentages, shown in column 7 for the five test sets shown in Table 2, was calculated:
(13.3% + 13.3% + 0.0% + 13.3% + 13.3%) = 10.64 % 5
This calculated mean value is a measure of the risk of the decision tree making an incorrect classification. In other words, the above decision tree approach has the capacity of correctly classifying samples approximately 89 % of the time.
5.2.2 Risk factors as input data
Despite the numerous risk factors for the development of breast cancer that have been investigated, only a few demonstrate a clear association with breast cancer development. Four probable risk factors associated with breast cancer are investigated in this project.
By using the risk factor values of age, BMI, alcohol status, and smoking status for the 75 patients as input to the C4.5 algorithm, it may be possible to shed light on the risk factors that are most important in the development of breast cancer. Thus by only considering the values of the four mentioned risk factors, it may be possible to separate non-cancer patients from patients suffering from breast cancer in the data set.
The risk factors that were used as input resulted in the pruned decision tree shown in Figure 12. As can be seen in Figure 12, the values for smoking respective alcohol status of a patient in Gene Logic can be set to one of the six following attribute-values: ‘current use’, ‘no current use’, ‘never used’, ‘previous use’, ‘occasional’, and ‘unknown’.
The distribution of the 75 patients, with respect to the six possible attribute-values describing alcohol and smoking status in Gene Logic, is shown in Table 3.
Current use No current use Never used Previous use Occasional Unknown Alcohol status 4 17 5 0 14 35 Smoking status 5 0 22 12 0 36
Table 3. Distribution of patients with respect to the attribute-values used when describing
alcohol and smoking status. Since the risk factor data contains information about 75 patients, the sum of each row is 75.