I
Preface
This Master thesis is the final part of our Master of Science degree in Industrial Engineering and Management at Lund University, Faculty of Engineering. The thesis has been carried out at IKEA of Sweden in Älmhult, in collaboration with the department of Industrial Management and Logistics at Lund University, Faculty of Engineering.
First of all we would like to thank Paul Björnsson at IKEA for his constant support and advice, and his genuine interest in our work. We would also like to give a special thank to Stig-Arne Mattson, for his valuable comments and guidance.
Finally we would like to thank Marie Andersson, and everyone else within IKEA that has helped us throughout the project, for taking time answering our questions.
We hope that this report will help IKEA in their future work with measuring processes.
Lund, January 2010 Anna Dahlberg Hildén Anna Wittrup
III
Abstract
Title: Performance Measurement in a Process Oriented Organization – a study of IKEA Supplying Process, and its core process Plan & Secure Supply
Authors: Anna Dahlberg Hildén and Anna Wittrup
Supervisors: Paul Björnsson – Process Leader for Plan & Secure Capacity, IKEA of Sweden
Stig-Arne Mattson – Department of Industrial Management and Logistics at Lund University, Faculty of Engineering
Keywords: Business Process Management (BPM), Process orientation, performance measurement, strategy Purpose: The purpose is to map current measures in the main
process Supplying and to select those that can be used to support the core process Plan & Secure Supply. Further, recommendations of new suitable measures for Plan & Secure Supply shall be given. Method: This is a qualitative study, mainly based on answers
from semi-structured interviews with employees at IKEA. 51 interviews, within all organizational units connected to Supplying, were held to ensure a full view of the used measures. The secondary data that the frame of reference is based on primarily consists of literature about process orientation and
IV measurement systems.
Conclusions: When mapping the measures within Supplying, 226 were found. There are significant differences between the measurement structures of different organizational units, both concerning the presentation and the number of measures used. Of the 226 Supplying measures, eight can be used to support Plan & Secure Supply, e.g. Forecast Accuracy, DD Share and stock measures. Further, new measures such as Cost of Poor Planning and Order proposal Accuracy, are recommended to be developed.
V
Content
1 INTRODUCTION ...1 1.1 BACKGROUND ...1 1.2 PROBLEM DISCUSSION ...2 1.3 PURPOSE ...2 1.4 DELIMITATIONS ...3 1.5 TARGET GROUPS ...3 1.6 COMPANY DESCRIPTION ...3 1.7 TIME PLAN ...4 2 METHODOLOGY ...5 2.1 METHODOLOGY APPROACHES ...52.2 INDUCTION, DEDUCTION AND ABDUCTION ...6
2.3 QUALITATIVE AND QUANTITATIVE STUDIES ...7
2.4 DATA COLLECTION ...8 2.4.1 Interviews ...8 2.4.2 Observations ... 10 2.4.3 Literature study ... 10 2.5 CREDIBILITY ... 10 2.5.1 Validity ... 10 2.5.2 Reliability ... 11 2.5.3 Objectivity ... 11 2.5.4 Criticism of sources ... 12 2.6 PROJECT STRUCTURE ... 12 3 FRAME OF REFERENCE ... 15 3.1 WHAT IS A PROCESS? ... 15 3.1.1 Main Processes... 16
3.1.2 Support and Steering processes ... 17
3.1.3 Components of a process ... 17
3.2 BUSINESS PROCESS MANAGEMENT AND PROCESS ORIENTATION ... 19
3.2.1 Business process management ... 19
3.2.2 Process Orientation ... 19
3.3 PERFORMANCE MEASUREMENT ... 20
VI
3.3.2 Measurement and strategy ... 22
3.3.3 Measurement systems... 23
3.3.4 Develop new measurement systems ... 24
3.3.5 The Balanced Scorecard... 25
3.4 CULTURE ... 28
4 EMPIRICAL STUDY ... 29
4.1 IKEAORGANIZATION... 29
4.1.1 Home Furnishing Businesses ... 29
4.1.2 Categories ... 30
4.1.3 Trading Operations ... 30
4.1.4 Distribution Services Operations ... 30
4.1.5 Transport Global ... 31
4.1.6 Retail Logistics ... 31
4.1.7 Customer Distribution ... 32
4.1.8 Free Range ... 32
4.1.9 The Red Group... 32
4.1.10 Regional Supply Teams ... 33
4.2 “WORKING TOGETHER AS ONE IKEA” ... 33
4.2.1 Process terminology in IKEA... 34
4.2.2 IKEA’s main processes ... 34
4.2.3 Supplying ... 35
4.2.4 Plan & Secure Supply ... 36
4.3 COMPUTER SYSTEMS AT IKEA ... 38
4.4 MEASURES WITHIN SUPPLYING ... 39
4.4.1 Availability ... 40
4.4.2 Total cost ... 43
4.4.3 Quality ... 46
4.4.4 Social and Environmental Responsibility ... 48
4.4.5 People ... 49
4.5 OWNERSHIP ... 49
4.6 MEASURES WITHIN SUPPLYING’S UNITS AND PROCESSES ... 49
4.6.1 Business Navigation Supplying ... 50
4.6.2 Home Furnishing Businesses ... 50
4.6.3 Categories and Trading ... 50
4.6.4 Distribution Services Operations ... 51
4.6.5 Transport Global ... 52
VII
4.6.7 Customer Distribution ... 52
4.6.8 Free range ... 53
4.6.9 The Red Group... 53
4.7 IKEACULTURE ... 53
5 MAP STRUCTURE... 55
5.1 MAP ... 55
5.1.1 Management perspective ... 56
5.2 DEFINITION SHEET ... 57
5.3 NUMBER OF MEASURES IN THE MAP ... 58
6 REFLECTIONS ABOUT SUPPLYING’S MEASURES ... 61
6.1 FOCUS ON THE CUSTOMER ... 61
6.2 HOW DIFFERENT UNITS WORK WITH MEASURES ... 62
6.3 SUPPLYING AND PROCESS ORIENTATION ... 63
6.4 BALANCE IN THE MEASUREMENT SYSTEM ... 64
6.5 TRAFFIC LIGHTS ... 64
7 MEASUREMENT RELATED TO PLAN & SECURE SUPPLY ... 65
7.1 DEVELOP A MEASUREMENT SYSTEM ... 66
7.2 COMPONENTS OF PLAN &SECURE SUPPLY ... 66
7.2.1 Processes and activities ... 66
7.2.2 Object in, resources and information ... 66
7.2.3 Objects out and outcomes ... 67
7.3 PREVENT SUB OPTIMIZATION ... 68
8 RECOMMENDATIONS ... 69
8.1 EXISTING MEASURES ... 69
8.1.1 Forecast Accuracy and Supply Plan Accuracy ... 70
8.1.2 DD share ... 71
8.1.3 Filling rate ... 72
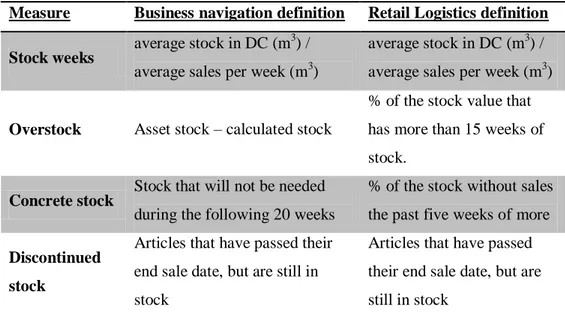
8.1.4 Stock measures ... 72
8.1.5 Fixed order type share ... 73
8.1.6 Service Level and Total cost ... 73
8.2 NEW MEASURES ... 74
8.2.1 Cost of Poor Planning ... 74
8.2.2 Order Proposal Accuracy ... 75
8.2.3 In time measures ... 75
VIII 9 CONCLUSIONS ... 77 10 REFERENCES ... 79 10.1 LITERATURE ... 79 10.2 JOURNALS ... 80 10.3 ELECTRONIC SOURCES ... 80 10.4 INTERVIEWS... 81 10.4.1 Personal ... 81
10.4.2 Email and Telephone ... 84
1
1 Introduction
This chapter aims to give an introduction to the thesis by describing the background and the purpose, which the report are based on. Furthermore the delimitations are stated, and a short presentation of IKEA is given.
1.1 Background
Increased competition and a more global market imply challenges for all companies, and efficiency and flexibility are urgent necessities to survive. Traditional functional oriented organizations are no longer considered able to handle those challenges, why the movement towards more process oriented organizations is popular.1 IKEA sees the advantages of the new way of working, and took a first step towards a more process oriented organization in 2002. The result of this first step was the creation of three main processes2;
Creating the Home Furnishing Offer
Supplying
Communicating & Selling
A second step in the process orientation was taken in 2008. Supplying, which is responsible for making the product range available to the customers, was then divided into core processes. One of Supplying‟s four core processes is Plan & Secure Supply, which aims to plan demand and supply, optimize supply chain network and secure capacity in all dimension, for the next 84 weeks.3 The process orientation is part of the creation of “One IKEA”, where everyone works in the same direction towards common goals.
1
Ljungberg, A. & Larsson, E. (2001) p. 11, 68 2
Internal material (2009) p. 16 3
2
“What gets measured gets done” is a frequently used statement4, which points out the importance of measuring the right things as well as things right. Many of the measures that Supplying is using today were defined before step II of the process organization was initiated, and are related and optimized from a functional perspective. A justified thought is that many of the measures are not aligned with the work in, and the goals of, the processes and perhaps even counteract them. However, there is an ongoing project (“PSS Mäta”) with the purpose to create a future set of measures within PLAN & SECURE SUPPLY.5
1.2 Problem discussion
For large organizations it might be difficult to get an overview of all measures, and how they are defined and connected to each other. This is the case for some parts of IKEA, and therefore mapping of current measures, including definitions, measurement frequency, data sources etc. is important. Other important steps in the creation of ”One IKEA” are to review and develop a new measurement structure that is aligned with the processes.
1.3 Purpose
The purpose of this master thesis is to:
Map current measures (”as is”), including Key Performance Indicators (KPIs) and other performing indexes, within the IKEA Supplying process, and comment on the measurement structure.
Select the existing (“as is”) measures used within Supplying that can be connected to the core process Plan & Secure Supply, and relate them to the process.
4
Ljungberg, A. & Larsson, E. (2001) p. 215 5
3
Recommend new (“to be”) measures to be developed to support Plan & Secure Supply.
1.4 Delimitations
The mapping is primarily focused on the main process Supplying, while the following selection and recommendations only focus on Plan & Secure Supply.
Only established measures that are followed up on regular basis are included in the mapping. This implies that measures that are only followed up occasionally, or that only a couple of people follow up for their own interest, are not regarded.
The analysis of Plan & Secure Supply is based on the tentative objects out, which perhaps have been or will be changed. Neither the process design nor the tentative objects are questioned.
1.5 Target groups
This thesis is mainly addressed to employees at IKEA, especially within the core process Plan & Secure Supply. Apart from the main target group, this report may also be useful for students, teachers and other people within the academic world that have an interest in supply chain management, process orientation and measurement systems.
1.6 Company description
IKEA was founded by Ingvar Kamprad in 1943, and furniture was introduced into the range in 1948. Since then IKEA has become a global company with stores in 44 countries and with a vision to create a better everyday life for the many people. The business idea is to offer a wide range of well-designed, functional home furnishing products at prices so low that as many people as possible will be able to afford them. The IKEA Group is
4
owned by a foundation based in the Netherlands, has 128,000 co-workers, and generates annual sales of more than 21.1 billion Euros. Since September 1 2009 Mikael Ohlsson is IKEA‟s CEO.6
1.7 Time plan
The mapping of current measures is the most time consuming part of the project. About two thirds of the total time is dedicated to interviews, collocation of information and designing of the map. The result of the mapping is difficult to present in a written report, why only examples of the map is provided. Therefore, the presentation of the map in this report does not give a full picture of the work that is required. This disposition is needed to fulfill the purpose, which is provided by IKEA.
6
5
2 Methodology
This chapter aims to describe the choice of methods used in the project. A selection of methods is done to suit the purpose of the project. The selection of methods for research, gathering of data, report credibility and criticism of sources are discussed further.
2.1 Methodology approaches
A study can be explorative, descriptive, explanative or normative, and the choice of study is based on the existing amount of knowledge within the area of study. Explorative studies are used when there is little knowledge and basic understanding is wanted. When fundamental understanding exists, a descriptive study can be used to describe, but not explain relations. Explanative studies are used when profound knowledge is desired and relations should be both described and explained, while normative studies are used when a certain degree of knowledge exists and the objective is to give guidance and suggest measures.7
This master thesis will be based on both descriptive and normative studies. In the first, descriptive, part of the project the measurement structure within Supplying is described, without explanations and valuations. The objective in the second part, however, is to give guidance and suggest recommendations about the suitable measures for Plan & Secure Supply. There are three assumptions that define the scientific approach of the study; the analytic, the system and the actor´s approach. With an analytic approach the reality is explained as objective and complete as possible and much effort is spent on finding cause-effect-relations. It is assumed that the whole is the sum of the parts, and therefore the problem can be divided into several
7
6
sub-problems. With the system approach, the reality is explained objectively, but the whole is considered to differ from, and is often more than, the sum of the parts. Within the system approach synergy effects between different parts are emphasized, and the relations between the parts are as important as the parts themselves. According to the last, actor‟s approach, the reality depends on its observers and gives rise to subjectivity. Consequently, the description of the reality depends on the researcher‟s experiences and acting.8
For this master thesis, a system approach was chosen, because seeking a holistic view of the system was important. However, in the second part of the thesis, some element of the actor‟s approach is used, as the evaluation of the measuring system is affected by the authors‟ experiences.
2.2 Induction, deduction and abduction
When working on a research project there are normally two ways to start the project; induction or deduction. Induction means starting by collecting data from reality, without prior theoretical studies, and then drawing general and theoretical conclusions. A disadvantage with this method is the difficulty of being unbiased, since a standpoint is established already when deciding what to study. Deduction on the other hand starts with theory, and a theoretical hypothesis is tested empirically. Conclusions are drawn based on existing theory.9
Abduction is a way to draw conclusions about what caused an observation based on probable connections. It cannot be used schematic, but requires
8
Björklund, M. & Paulsson, U. (2003) p. 59 9
7
thorough experience within the field of study. The conclusions are normally not valid without further testing.10
Since the empirical study is the basis for this thesis, an inductive approach is used. The mapping of the measures is based on empirical observations, such as interviews, and the recommendations are influenced by personal analysis. However, the analysis is to some extent based on existing theory about for example process management.
2.3 Qualitative and quantitative studies
Quantitative studies contain information that can be measured or valued numerically. However, quantitative studies are limited by the fact that not everything can be measured quantitatively. Qualitative studies are used to create a deeper understanding of a specific subject, a specific occurrence or situation. They are not possible to generalize to the same extent as quantitative studies.11
The choice between a qualitative and a quantitative study is made based on the purpose of the study. Observations and interviews are suitable for qualitative studies, while questionnaires and mathematical models are suitable for quantitative studies.12
This thesis is a qualitative study since the purpose is to create an understanding of how, and what, IKEA is measuring. This understanding is needed to be able to evaluate the measures within the core process “Plan and Secure Supply”. Since the study is qualitative interviews are used to collect data and information.
10
Wallén, G. (1996) p. 48 11
Björklund, M. & Paulsson, U. (2003) p. 63 12
8
2.4 Data Collection
There are two types of collected data; primary and secondary data. Primary data consists of information that is collected specifically for the research, for example by interviews, questionnaires and observations. Secondary data is general and public information that can be found for example in books and journals.13 A combination of primary and secondary data has been used for this thesis.
2.4.1 Interviews
A method for collection of primary data is interviews, which can be structured, semi-structured or unstructured. In a structured interview, all questions are set beforehand and are discussed in a definite order. If only the subject fields are set, and specific questions are formulated during the interview, it is called semi-structured. An interview can also be in the form of a conversation or discussion, with no predestined question, and is then called unstructured.14
Primary data for this master thesis have, above all, been obtained through interviews with people within IKEA. Using personal interviews, instead of questionnaires, ensured that the respondent understood the questions, and that the desired answers were obtained. The interviews were semi-structured, that is a discussion based on a number of questions and subject fields. This was necessary because the interviewees had different knowledge about the subject, and individual structured interviews were impossible to obtain. With semi-structured interviews the interviews could be lead in a way that fit the interviewee, at the same time as no important information was missed. Every interviewee received a short presentation of the background and purpose of the master thesis a couple of days before the
13
Björklund, M. & Paulsson, U. (2003) pp. 67-68 14
9
interview. This guaranteed that everyone knew what the interview was about, and that they had time for necessary preparations. The questions that the interviews were based on can be found in Appendix 1.
51 persons at IKEA have been contacted. 34 of these were personal meetings and 17 were contacted by email or telephone. The interviews were held with people from the organizational units Categories, HFB, Trading, DS Operations, Transport Global, Retail Logistics, the Red Group, Free range, Supply Teams, and CD (further on all these are referred to as the units). Additional interviews were held with people from Business Navigation Supplying, as well as from Plan & Secure Supply. The first interviews were mostly held with business navigators, with the purpose to get an overview of the units and the top measures that are used. Further interviews were then held in each unit, both with business navigators from different areas as well as with people working more operative. The personal interviews were mostly held with people located in Älmhult, but also with some people visiting from other countries in Europe. For practical reasons, personal interviews were not always possible, why email or telephone sometimes were used for all contacts with a unit. However, email was mostly used to verify information obtained from personal interviews. To get an overall picture of the measures within Supplying, and not only the ones used in Älmhult, people from different trading areas, transport areas etc. were contacted. People within Supplying have helped us to choose areas and find people to guarantee that the map of the measures is representative for all of Supplying.
10 2.4.2 Observations
The collection of primary data from interviews has been complemented with observation of information packages at IKEA‟s intranet. However, all information found at the intranet, has been discussed with the interviewees. 2.4.3 Literature study
The secondary data that the frame of reference is based on consist primarily of literature about process orientation and measurement systems. Books, scientific theses as well as journals have been used. More general theories related to the subject have also been investigated such as company culture and balanced scorecard.
2.5 Credibility
To ensure a study‟s credibility different aspects can be evaluated; validity, reliability and objectivity. For the results of a study to be trustworthy validity, reliability and objectivity should be as high as possible.15 Criticism of sources is also important to ensure the credibility of the report.
2.5.1 Validity
Validity shows to what extent what was intended to be measured is actually measured.16 In this case, validity refers to the communication with the interviewees. It must be secured that the questions have been correctly comprehended and that the answers have been interpreted in an accurate way. The validity is considered to be of high credibility since all interviewees were contacted afterwards and asked to verify the information in the map that was received in their interview. The interviewees that are set as sources in the definition sheet all received an excel file with the measures in question, and were asked control the information. If no answer was received, the information was assumed to be correct.
15
Björklund, M. & Paulsson, U. (2003) pp. 59-60 16
11 2.5.2 Reliability
The term of reliability concerns the trustworthiness of the study and the degree of reliability of the measuring instrument, i.e. to what extent the same result is achieved if the study is repeated.17 Almost all interviews have been held by two persons. This means that all information achieved during the interviews has been heard and discussed by more than one person. Most personal interviews were recorded, which further decrease the risk of misunderstandings. As the interviews were semi-structured they often resulted in a free discussion around the subject. Therefore it is difficult to guarantee that the exact same results would be obtained if the study was repeated. However, because of the nature of the subject in combination with the authors‟ lack of prior experience within IKEA, semi-structured interviews were seen as necessary.
Concerning the repeatability of the study, IKEA is a dynamic company that can transform rapidly due to market changes or internal circumstances, meaning that a similar study can find other results if conducted at a later stage.
2.5.3 Objectivity
The objectivity shows to what extent someone‟s values influence the study.18 As the project is carried out by two persons, who have worked on all analysis and conclusions together, no one‟s personal opinions have been allowed to dominate. Further, none of the authors have any prior engagement with IKEA, research findings to defend or other reasons to let personal opinions affect the project. For literature studies information originating from several independent sources is used, and therefore the objectivity is considered satisfying for this area.
17
Björklund, M. & Paulsson, U. (2003) pp. 59-60 18
12 2.5.4 Criticism of sources
This study is based on both literature studies and several interviews. With respect to the large number of sources, consisting of books, scientific theses and journals, the understanding of the theories used in the analysis is considered to be good. Naturally, a literature study covering more sources would have given the theory chapter further trustworthiness. Most literature about process orientation used in this thesis is written by Anders Ljungberg, which could imply a partial view of the subject. However, the fact that Ljungberg has done researches in the subject and presently work with process orientation makes him a reliable source.
Most parts of the empiric studies originate from information based on interviews with employees working within Supplying. The sufficient number of interviews within each unit ensures that an objective view of the measurement structure has been obtained. However all interviewees work for IKEA, why their objectivity could be discussed.
2.6 Project structure
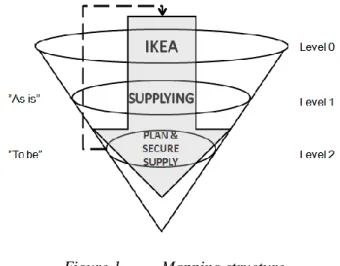
In the first part of this thesis, measures within Supplying were in focus. The mapping was supposed to start by looking at all of IKEA (Level 0) and then be gradually more and more detailed for Supplying (Level 1) and Plan & Secure Supply (Level 2). This structure can be compared to the funnel in Figure 1. The reasons for starting at level 0 were to get an idea of the total number of different measures used within IKEA, as well as making sure that no measures connected to Supplying were disregarded. This turned out to be more difficult than expected, since all of the interviewees work within a specific unit or process and none of them could provide a total picture. As the purpose of the thesis is to map measures on levels 1 and 2, level 0 was left out. However, the probability that this would affect the results is
13
regarded as low since the large number of interviews increases the probability of a complete picture.
Figure 1 Mapping structure.
At Level 1, an “as is”-picture of the measurement structure within Supplying was obtained though a large number of interviews. The mapping was the largest and most time-consuming part of this project. It was done parallel with interviews and took about two thirds of the total time of the project.
In the second part of this thesis, the measures within the core process Plan & Secure Supply were analyzed. First a selection of the existing measures that could support the process was made. After that, a discussion about new possible measures that could be developed was held.
15
3 Frame of reference
This chapter aims to describe theories that are relevant for the report and analysis. The chapter mainly covers theory about business processes and measurement systems.
3.1 What is a process?
In the literature many definitions of a process can be found, which may lead to misunderstandings. To facilitate the work with processes it is therefore important that everyone has the same perception of what a process is. The definition used by Ljungberg is19:
“A process is a repetitively used network of orderly linked activities using information and resources for transforming inputs to outputs, extending from the point of identification to that of the satisfaction of the customer’s needs.”
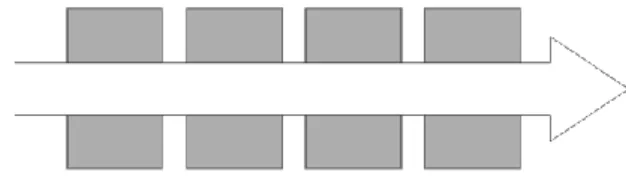
A metaphor often used to describe a process is a road, which cuts across functions and divisions (Figure 2). The road starts with a customer need and ends with customer satisfaction, and is always measurable and repetitive.20 A process is strongly related to the business concept of an organization, and how it is realized in practice.
Figure 2 Processes cuts across functions and divisions.21
19
Ljungberg, A. (1998) p. 57 20
Ljungberg, A. & Larsson, E. (2001) pp. 44-47 21
16
When describing an organization from its processes, the following types of processes can be used22:
Main processes
Support processes
Steering processes 3.1.1 Main Processes
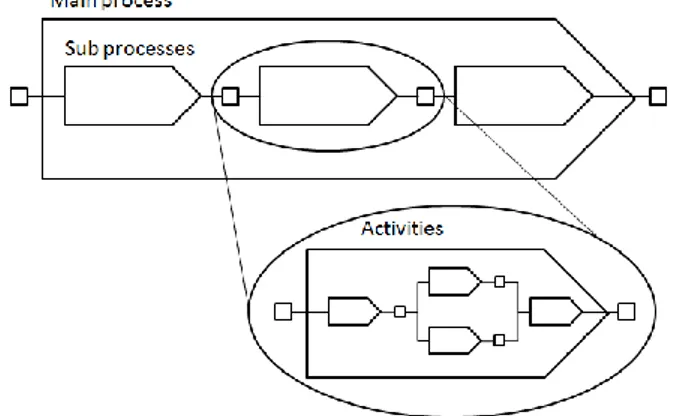
The main processes describe the purpose and give a perspicuous picture of an organization. By studying the main processes, it can easily be understood what is most important for the organization, and how different parts work together to create the whole.23 A main process can be described in different levels of detail, and can be divided into a number of sub processes and activities (Figure 3). Sub processes are subordinate main processes, and activities are subordinate sub processes.24
Figure 3 Different levels of detail for processes.25
22
Ljungberg, A. & Larsson, E. (2001) p. 184 23
Ljungberg, A. & Larsson, E. (2001) p. 84 24
Ljungberg, A. & Larsson, E. (2001) p. 193 25
17 3.1.2 Support and Steering processes
The support processes are needed to make the main processes work. Examples of support processes are invoicing and creation of budgets and balance sheets. The steering processes are used to coordinate the main and support processes, that is for example to define the strategy, create the financial and resource prerequisite as well as follow up the development of the organization.26
3.1.3 Components of a process
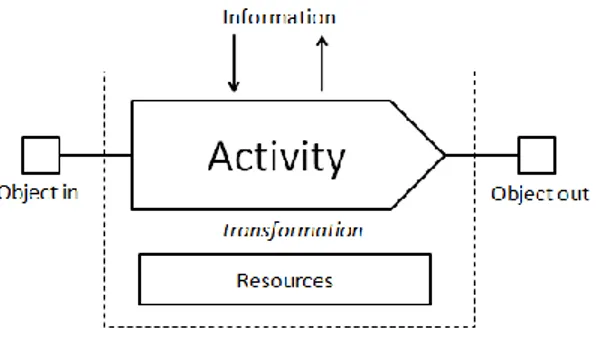
A process normally consists of six different components; object in, activity, resources, information and object out, see Figure 4.
Figure 4 An activity transforms object in to object out.27
3.1.3.1 Object in
Object in, which is drawn as a square, represent the trigger that cause an activity to start. Object in comes from the immediately preceding activity or process, which is an internal or external supplier with a certain need. Examples of object in can be an order or a new product idea. Object in is not everything that goes into the process, and should be distinguished from recourses and information, that are further described below. However,
26
Ljungberg, A. & Larsson, E. (2001) pp. 185-186 27
18
object in can be in form of both resources and information, given that they trigger the process.28
3.1.3.2 Object out
Object out is the immediate result of the transformation within an activity or a process. Object out from one process or activity can be object in to the following.29
3.1.3.3 Activity
Within an activity, the object in is transformed to object out. An activity, as well as a process, is drawn as a box with a tip pointing to the right, building up a flow from left to right. A process consists of a network of activities, where the object out of the last activity is the same as the object out of the superior process.30
3.1.3.4 Resources and information
Resources, for example people and equipment, are required for the performance of an activity. The resources are dedicated to a certain activity, and do not follow the object through the process. Object in and object out can be of information type. However, the difference between objects and information is that objects trigger the process, while information facilitates and supports it.31
3.1.3.5 Outcome
The result of a process does not only consist of object out, but also the process‟ outcome. The outcomes are the more long term result of the
28
Ljungberg, A. (1998) p. 66 29
Ljungberg, A. & Larsson, E. (2001) p. 195 30
Ljungberg, A. & Larsson, E. (2001) p. 195 31
19
process, like customer satisfaction. The outcomes are often more difficult to define and measure than object out.32
3.2 Business process management and Process
orientation
The traditional function oriented and hierarchic organization is built on a couple of assumptions that are not aligned with the reality today. One example of an old-fashioned assumption, that has been the basis of the work in many organizations, is that identification of small and specialized tasks, which all have a best way to be performed, always is possible. Another example is that improvement of every task implies improvement of the whole organization.33 When focusing on performance of functions, an immediate risk of sub-optimization occurs because of lack of a comprehensive view and focus on the overall goals of the organization.34 3.2.1 Business process management
Two goals within Business Process Management are integrating the management of the whole organization and creating focus on customers through all activities. A precise definition of BPM is difficult to find, but the main strand in existing definitions is that BPM is a structured, analytical, and cross-functional management approach that is striving for innovation and flexibility in the organization and continuous improvement of processes.35
3.2.2 Process Orientation
In a process oriented organization, processes are used to create customer value. The emphasis is not on functional and hierarchical structures, but on
32
Ljungberg, A. & Larsson, E. (2001) p. 197 33
Ljungberg, A. & Larsson, E. (2001) p. 68 34
Ljungberg, A. & Larsson, E. (2001) p. 71 35
20
the improvement of entire chains of business operations.36 If processes are the basis of the organization‟s way to observe, develop and manage the business, the organization is process oriented.37
3.3 Performance Measurement
To improve the performance of an organization, it is important to know how well it performs today. Therefore, measurement has become critical for the success of an organization. A well-developed measurement system can for example help the organization to understand how good they are at meeting customer expectations, pinpointing cost, time and quality of their logistics operations as well as deciding which suppliers are the most effective to deal with.38 As the objective with measures is to steer an organization in a certain direction, it is not enough to measure the right things, but it is also important to measure it the right way.39 Furthermore, a well developed measurement system facilitates benchmarking, identifies problems, creates a common language and gives motives for change.40 For example Johnson and Kaplan point out some needs of good measurement systems, especially the need of non-financial indicators. These indicators should be based on the organization‟s strategy and focus on the key areas of work, e.g. manufacturing, marketing, and R&D.41
3.3.1 Traditionally used measurements
Traditional measures that are often used within organizations today usually possess one or several shortages. When organizing around processes instead of functions, a new way to measure is required. The focus should move
36
Reijers, H. A., (2006) p. 392 37
Ljungberg, A. & Larsson, E. (2001) p. 88 38
Keebler, J. S. et al. (1999) pp. 2-4 39
Ljungberg, A. & Larsson, E. (2001) p. 215 40
Ljungberg, A. & Larsson, E. (2001) pp. 223-225 41
21
from the functions to the processes.42 43 Some potential shortages with traditional measures are described below.
3.3.1.1 Functional oriented
Many organizations still use performance measures that focus on functional optimization. Even if these measures help to improve the performance in one specific function, they can counteract improvements of the whole logistics process.44 This is the reality especially in many manufacturing organizations. The production manager wants plenty of raw materials to support long production runs, while the sales manager desire a high level of finished goods inventory to handle spikes in demand and the finance manager is trying to cut costs by keeping inventory levels low.45
3.3.1.2 Too financially focused
The long-term economic results are an effect that appears long after the decisions and actions, that are the basis of the results, were made. Because of this, economic results are often difficult to use to steer and develop an organization.46
3.3.1.3 Too historical
Measurements are often based on things that have already happened. A determining factor of a measurement‟s ability to steer and develop an organization is if the measurement is done early or when the final result is reached. If the measurement is done after a course of events is completed the risk of not doing it better next time is bigger.47
42
Meyer, C. (1994) p. 96 43
Johson, H. T. & Kaplan, R. S. (1987) p. 253 44
Keebler, J. S. et al. (1999) p. 34 45
Keebler, J. S. et al. (1999) p. 76 46
Ljungberg, A. & Larsson, E. (2001) p. 218 47
22
3.3.1.4 Not always focusing on the customer
Sometimes organizations are focusing too much on their own needs, without considering if it is relevant from a customer perspective. If the customer and the supplier measure the same performance, the customers mostly do not get as good results as the supplier. An example of this is a customer who orders four pistons for his tractor, but only receives three of them at the right time. As three pistons are of no use, the delivery precision is seen as zero by the customer, while the supplier perhaps register it as a delivery precision of 75 %.48
3.3.1.5 Focusing on input instead of output
Traditional measures often focus on input instead of output. There are often a lot of information about the recourses used, and substantially less information about the actual result created.49
3.3.2 Measurement and strategy
The statement “What gets measured gets done” indicates the importance of well-defined measurement systems that are in line with the strategy. To ensure that all employees work for common goals, and not only their own, it is of vital importance that the measures support the overall business strategy.50 In fact, the strategy is the most important factor for the performance of a measurement system. Without a well defined strategy it is impossible to know what to measure. Inversely, a well defined measurement system is needed to achieve the objectives of the organization.51 More specifically, an organization that is focusing on quality should measure non-financial indicators concerning this, e.g. scrap, rework, defect rates and
48
Ljungberg, A. & Larsson, E. (2001) p. 220 49
Ljungberg, A. & Larsson, E. (2001) p. 221 50
Keebler, J. S. et al. (1999) p. 74 51
23
customer complaints, and organizations that aim to be low cost producers should measure how well they are able to do more with less.52
3.3.3 Measurement systems
Different departments and functions need different measures. According to Kaydos, a department in a typical organization needs anything from ten to fifty measurements, not including the normal financial functions. Even if this may seem like a large number, he is of the opinion that it is not costly to monitor that many measurements with a well-designed system.53 However, Keebler et al. recommend managers not to measure “everything that moves”. The temptation to use many measures is often strong when the management is not clear on which measures best reflect the overall performance of the organization. A survey even suggests that top performers of a given process use fewer measures than average.54
Lindvall mentions three phases that organizations pass in their attitude towards, and ambition with, measurements. In the first phase measurements strengthen the attention within the organization, but still mainly act as confirmation and presentation of statistics. The ambition is to report what has happened, and not to use the measurements to manage the organization in the future. In this first phase the number of measures is often large and it is mainly someone superior who has any interest in the measures.55
The second phase is often a reaction to the passive, administrative first phase, and organizations now develop different variants of goal-steering. Focus is on following up if managers reach their goals, but not how they are reached. The measurements are therefore only focused on the final goal and
52
Johson, H. T. & Kaplan, R. S. (1987) pp. 256-257 53 Kaydos, W. (1991) p. 66 54 Keebler, J. S. et al. (1999) p. 76 55 Lindvall, J. (2001) p. 209
24
activities that affect the result are hard to evaluate. Organizations in the second phase are often decentralized.56
The interest in how good results are created increases in the third phase. It becomes important to be able to fully benefit by all the competences that are available in the organization, why the need for identification and development of common ways of working increases. The question of how the work is performed is now very interesting, and it is important to know which processes and activities that are performed within the organization. This implies that organizations in the third phase are interested in process orientation. Models, such as the balanced scorecard described in section 3.3.5, becomes important in this phase.57
3.3.4 Develop new measurement systems
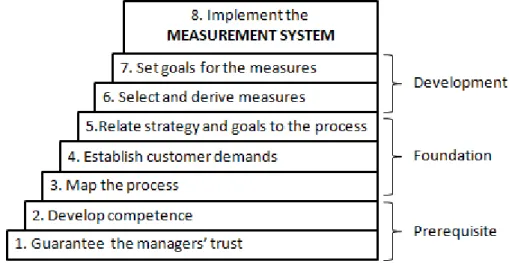
Ljungberg describes an eight steps model to be used when developing a new measurement system. To guarantee a well designed system, none of the eights steps in Figure 5, can be left out.58
Figure 5 Seven steps for developing a measurement system.59 56 Lindvall, J. (2001) pp. 209-210 57 Lindvall, J. (2001) pp. 209-210 58
25
Also Keebler et. al. describe a number of steps that can be used when to implement a new, or review the old, measurement system. (This methodology is not directly related to measurement of processes.) The first step of their seven-step approach is “record the existing measures”. The authors emphasize the importance of understanding the measures that are currently used in the organization. A solid documentation of the measures will generate knowledge about the motivators in the work environment, as well as give a foundation for the development of the new measures.60 3.3.5 The Balanced Scorecard
Measurement systems for organizations have historically been financial. However, to survive in information age competition organizations need to use measurement and management systems that are derived from their strategies and capabilities.61 As mentioned earlier, financial measures only provide information about past performance, but say nothing about the present or the future.62
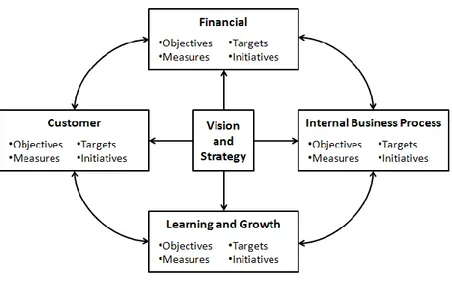
A model that complements financial measures of past performance with measures of future performance is the Balanced Scorecard. The measures of the Balanced Scorecard are divided into four perspectives; financial, customer, internal-business-process, and learning and growth.63 Altogether, the Balanced Scorecard translates an organization‟s vision and strategy into objectives, measures, targets, and initiatives across these four perspectives, and aims to create a balanced measuring system (Figure 6).
59
Based on Ljungberg, A. & Larsson, E (2001) p. 249 60
Keebler et. al. (1999) p.128 61
Kaplan, R. S. & Norton, D. P. (1996) p. 21 62
Kaplan, R. S. & Norton, D. P. (1996) p. 24 63
26
Figure 6 The Balanced Scorecard.64
3.3.5.1 The Financial perspective
The financial perspective is included in the scorecard since financial measures are good for summarizing economic consequences of past actions. It indicates if the implementation and execution of an organization‟s strategy contribute to improve the bottom-line. Return-on-capital-employed and economic value-added are examples of financial measures.65
3.3.5.2 The Customer perspective
For an organization to achieve long-term financial results it must create and deliver what is valued by the customers. In the customer perspective organizations therefore identify the customer and market segments where they choose to compete, and that will bring revenue. The main customer outcome measures are satisfaction, loyalty, retention, acquisition, and profitability.66
64
Based on Kaplan, R. S. & Norton, D. P. (1996) 65
Kaplan, R. S. & Norton, D. P. (1996) pp. 25-26 66
27
3.3.5.3 The Internal Business Process perspective
Organizations need to identify the critical internal processes that will enable them to deliver the value propositions that will attract and retain customers as well as satisfy the shareholders‟ expectations. This could be improved quality, reduced cycle times, maximized throughput, and lower costs. Two differences between the Balanced Scorecard and traditional performance measurements are that the Balanced Scorecard identifies new processes at which an organization needs to excel and includes innovation processes in the internal-business-process perspective.67
3.3.5.4 The Learning and Growth perspective
The learning and growth perspective identifies the infrastructure that organizations need to build up to create long-term growth and improvement. By only using the capabilities and technologies that exist today organizations are unlikely to meet the targets for customers and internal processes. Organizational learning and growth are mainly based on people, systems, and organizational procedures, and the scorecard can reveal gaps between the existing infrastructure and the one needed to improve the performance.68
3.3.5.5 Other perspectives
The foundation for working with the balanced scorecard is an organization‟s strategy. This implies that other perspectives than the four mentioned above might be applicable. Some organizations have therefore added a fifth perspective, while others have changed one of the original to one that is better suitable.69
67
Kaplan, R. S. & Norton, D. P. (1996) pp. 26-27 68
Kaplan, R. S. & Norton, D. P. (1996) p. 27 69
28
In Swedish organizations the employees often have a quite strong position, so adding a co-worker perspective is quite common. The co-worker perspective can include areas such as education, work satisfaction, age structure, gender structure, and experience. Other perspectives that could be possible are environment and supplier.70
3.4 Culture
The performance of an organization cannot be improved by solely focusing on technical aspects. The human aspect is also very important since everything happens through people. People act differently depending on their beliefs, values, and knowledge, i.e. their culture. All organizations have different cultures, and the work environment affects individual performance. Hence, the level of performance that can be achieved is limited by the organization‟s culture since there is a strong cause-and-effect relationship between the culture, what the organization can do, and how things get done.71
70
Ax, C. et. al. (2009) p. 457 71
29
4 Empirical study
The empirical study is mainly based on information from interviews with people working within Supplying. Documents obtained from IKEA’s intranet and from the interviewees are also used to support the empirical study. The chapter intends to give an overview of the organization and the measures that are used within Supplying. When no source is specified the information comes from one of the interviewees.
4.1 IKEA Organization
IKEA is divided into several different organizational units. The past decade IKEA has started to implement Business Process Management (BPM), and is now in addition organized in processes. The units and processes are described below.
4.1.1 Home Furnishing Businesses
IKEA‟s range consists of home furnishing articles that are developed by IKEA of Sweden in Älmhult.72 IKEA of Sweden is divided into different Home Furnishing Businesses (HFB) that are responsible for different parts of the range, e.g. kitchen, workspaces, and textiles. The HFBs are active in all main processes, and handle activities such as range management, communication, and supplying.73
The HFBs that do not have furniture in their range are referred to as satellite HFBs, and their business must be handled differently. One reason is that customers often behave differently when buying furniture from when buying cheaper and smaller articles.
72
IKEA 2009 (b) 73
30 4.1.2 Categories
Every HFB used to be responsible for purchasing the material and the components needed for their articles, but a new way of working is purchase development in categories. A category is defined as a group of articles which belong to the same industry, i.e. they share similar materials and/or production technique and supplier base. The Categories are also grouped into Material Areas. Two examples of categories are plastic and carbon steel tubes. Each category has one category leader at IKEA of Sweden and one in each relevant Trading region. The Categories do not follow the HFB structure, but might cover one or many HFBs. This new way of working will increase the coordination between functions and secure that IKEA has an optimal supplier base.74
4.1.3 Trading Operations
IKEA purchases material and components from all over the world. To be able to monitor production, test new ideas, negotiate prices and check quality as well as keep an eye on social and working conditions, IKEA has 41 trading service offices in 30 countries. 67 % of the total purchase comes from Europe, 30 % from Asia, and 3 % from North America.75 The trading organization is divided into nine trading areas; five in Europe, three in Asia, and one in North America.
4.1.4 Distribution Services Operations
Distribution Services Operations (DS Operations) handles all the warehouses, called distribution centers (DC), in the supply chain. DS Operations is divided into different DS Areas that normally consist of a number of countries in the same geographical region. To optimize the flow of goods there are two types of DCs; high flow and low flow. The idea is
74
IKEA Intranet (b) 75
31
that goods that only need to be stored during a short period will go through a high flow DC, while the rest will go through a low flow DC.
In addition to the warehouses DS Operations handles transports. The transport business is divided into five geographical areas; three in Europe, one in Asia and one in North America, and each area has its own transport organization that is responsible for all transports that start within that area. The transport areas are closely connected to the DS areas, and they often work together to optimize the supply chain.76
4.1.5 Transport Global
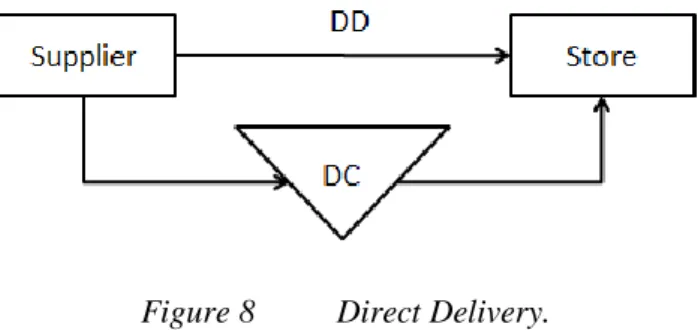
Transport Global plans, purchases, operates, and controls all IKEA‟s transportation activities globally. No transportation activities are carried out by IKEA, but are purchased from external carriers, and the flow of goods can be transported directly from supplier to store or via a distribution center or consolidation point. The transport business is divided into four categories; land transportation, ocean transportation, customer delivery, and handling material. Handling material, such as pallets, has a two way flow as it is also transported from stores back to suppliers or DCs.
4.1.6 Retail Logistics
Retail Logistics is responsible for in-store logistics, which includes activities such as goods receiving, transportation within the store, and refill. This is the part of the supply chain that meets the customers and securing availability in the sales location is prioritized. Retail Logistics operates where the two main processes Supplying and Communicating & Selling meet, which sometimes result in contradictive goals. Customer satisfaction might for example not be achieved by striving to minimize the inventory
76
32
carrying costs. Every country that has an IKEA store has its own retail organization.77
4.1.7 Customer Distribution
Everything that is delivered to a customer‟s home is called customer distribution (CD). This includes deliveries from the stores that the customer cannot bring home itself, called local customer delivery (LCD), as well as home shopping via internet, called central customer delivery (CCD). The products that customers buy via internet are stored in special warehouses called customer distribution centers (CDC). CD is part of the activities for DS Operations, Transport Global, and Retail Logistics.
4.1.8 Free Range
Free Range is similar to a HFB, and handles articles that are outside the normal range. The articles from Free Range can be divided into three segments; time restricted offers, gap fillers, and store direct. Time restricted offers are articles that are only sold during a couple of days or a week in some selected stores, e.g. in a country. The goal is to attract more customers to the stores when there is a time restricted offer. Gap fillers are articles that are not part of the IKEA range, but that are introduced on certain markets to fill gaps. It is normally articles that the customers would expect to find in an IKEA store, such as chopsticks in China. Store direct are articles that the stores can choose themselves and buy from an internal web shop.
4.1.9 The Red Group
There are some IKEA stores around the world that are not owned by IKEA, but by franchisers in each country. The stores owned by IKEA are called the blue group while the stores owned by franchisers are called the red group. The stores in the red group are mainly located in countries where it can be
77
33
hard for a foreign organization to start its business. All contacts between the franchisers and IKEA are handled by Inter IKEA Systems Services (IISS). For example IISS buys all products and then sells them to the franchiser, arranges all transports, and helps with marketing. IISS designs the supply chain for the stores in the red group and decides for which articles direct delivery should be used.
4.1.10 Regional Supply Teams
The Regional Supply Teams work to create high availability in stores and CDC. They manage inventory throughout the supply chain in order to meet sales expectations and look for possibilities to reduce lead times. The work is performed in cooperation with suppliers, Trading, and Retail.78
4.2 “Working together as One IKEA”
In 2002 IKEA started to implement Business Process Management, with the objectives to increase customer satisfaction, increase the ability to sustain growth in revenue, and increase the short and long term profitability. The definition of BPM that is used by IKEA is79:
“A structured way to implement improvement, management & control of our essential processes to achieve the goals defined in our Strategy.”
Instead of using the term process orientation, IKEA calls it “Working together as One IKEA”. Working as “One IKEA” implies that everyone has the customers and their expectations in focus and the goal is to contribute to the customer success. IKEA‟s founder, Ingvar Kamprad, has had these ideas long before the implementation of ”One IKEA”, so even though it has not been called BPM it has been affecting the way of working. For example in
78
IKEA Intranet (e) 79
34
the booklet known as Ingvar Kamprad‟s testament some BPM concepts, e.g. simplicity, are mentioned.
Today the functions still remain, but the work is increasingly organized around the processes. The work is performed in diverse teams across organizational boarders, and a shared process map facilitates to describe, share and improve the way of working.80
4.2.1 Process terminology in IKEA
IKEA is using a terminology for processes that is similar to what is presented in section 3.1 in this report. However, there are some differences, and to avoid misunderstandings these are presented below.
The expression main process is at IKEA used in the same way as the frame of reference states, i.e. processes that describe the purpose and give a perspicuous picture of an organization. According to the frame of reference main processes consist of sub processes, which at IKEA are referred to as core processes. At IKEA a sub process is a part of a core process. The most detailed components of the processes are, as in the theory, called activities. 4.2.2 IKEA’s main processes
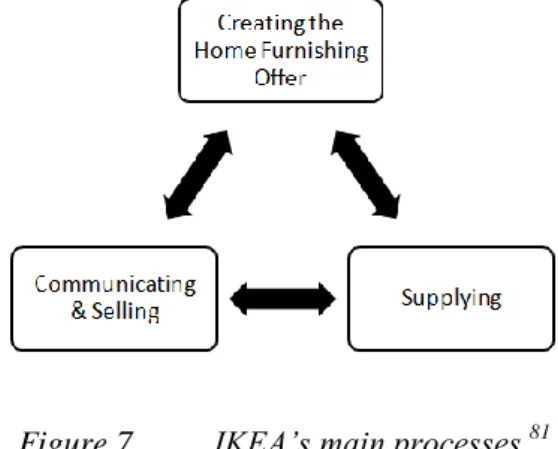
IKEA has three main processes; Creating the Home Furnishing Offer, Supplying, and Communication & Selling (Figure 7). As the name unveils, Creating the Home Furnishing Offer is the process responsible for creating and developing the range. This includes for instance design, product development, and testing. The second process, Supplying, is responsible for making the range available for the customer. This includes all activities from purchasing of material and components, till the product is on its sales location. The focus of this project is on Supplying, why it is further
80
35
described below. The last of the three main processes is Communicating & Selling, which is responsible of communicating the product range to the customers in the store, catalogue or other media.
Figure 7 IKEA’s main processes.81 4.2.3 Supplying
The main process Supplying is responsible for the supply chain, from raw material to customer. It cuts through the four functions Trading Operations, Transport Global, DS Operations, and Retail Logistics. The overall goals for Supplying are:
Everyday good product quality,
Produced and distributed under good conditions,
Available when customers want it,
At lowest total cost, and
People
The work within Supplying can be seen as an optimization model where the goal is to minimize the total cost, given the constraints availability, product quality, social and environmental requirements, and people.82 When working as ”One IKEA”, better results will be generated for all five goals.
81
Based on Internal material (2009) p. 16 82
36
Today the units within Supplying sometimes have developed parallel working methods which can result in sub-optimization, unnecessary overlaps and high operational costs. In addition to the four functions, there are two organizational divisions especially important for the work within Supplying; the Categories and the Home Furnishing Businesses.
The supplying process has four core processes, as well as a couple of steering and supporting processes. The four core processes are:
“Purchase Development & Design Supply”
Plan & Secure Supply
“Supplier Development”
“Excellent Logistics for Availability”
None of the processes are completely defined yet, but Plan & Secure Supply is the process that is most developed. The other ones are only preliminary at the moment. The second part of the thesis is focused on the core process Plan and Secure Supply, why this is further described below.
4.2.4 Plan & Secure Supply
The core process Plan and Secure Supply consists of activities that, as the name reveals, aim to make sure that IKEA‟s supply of material and products works as it should within a time span of 0-84 weeks. The purpose of the process is to create a “One common plan” for the current and following year that is accurate, agreed and executable. It should also optimize flows and secure that the Supply Chain Development Plan is possible to execute. The Process consists of a number of sub processes:
Plan Demand
Plan and Optimize Supply Chain Network
37
Plan and Secure Capacity
Within the sub process Plan Demand a demand plan of how much each store will sell is designed. The plan is based on a sales forecast that comes from the financial headquarters in Leiden. Objects out from this process are the demand plan and an operational forecast. The demand plan does not include 100 % of the articles in the product range. Some articles belong to the so called non forecast based range, and in addition to that some news and outgoing articles etc. are not forecasted.
The sub process Plan & Optimize Supply Chain Network aims to plan an optimal replenishment solution, based on a design made by Purchase Development & Design Supply. Decisions made within this process concern for example direct delivery share, and if a DC should be high flow or low flow. The object out from the process is an optimal replenishment solution, which is used as information for the following processes.
Based on the demand plan and information about the optimal replenishment solution, a supply plan is created and order proposals are sent to the core processes “Supplier Development” and “Excellent Logistics for Availability”. This is made within the sub process Plan Supply. The supply plan is based on forecasted demand and therefore the supply plan is not 100 % complete, which can cause problems. In this process, calculations of the safety stock are also made. The main objects out from this sub process are the supply plan and order proposals on time.
The last sub process is Plan & Secure Capacity. Work to balance need and capacity is carried out in this process. Based on the supply plan the process calculates the capacity that is needed throughout the supply chain. The
38
process secures the supplier capacity as well as the capacity in stores, DS Operations and Transport Global, based on two capacity plans calculated in Plan Supply. The object out from Plan & Secure Capacity is a “One common plan” for the processes Perform Finance and Administration, Excellent Logistics for Availability and Supplier Development. As mentioned above, the supply plan is seldom complete, which often implies shortages in the following capacity plans.
The tentative objects out from the Plan & Secure Supply process are:
“One Common Plan”
Order Proposals on time
Availability Info on time
SC Deviations resolved on time
Precision in phasing in/out
Increased DD share
Minimized Inventory Costs
The long term results of the process are Excellence in Operations, Reduced Total Supply Cost and Availability.
4.3 Computer Systems at IKEA
IKEA uses several different data bases, tools and systems. The major data bases are IDW (IKEA Data Warehouse), RT70, Razon, IBIS (IKEA Business Intelligence System) and CNS (Cargo Network System). The information in IDW can only be used centrally, while information in e.g RT70 can be used by everyone.
Business object (BO), Access and Cognos are tools that are used to read the information in the data bases. Access is a tool where everyone can create
39
their own reports and measurements, which require good knowledge about the system. As many co-workers do not have this knowledge the result is that many poor and misleading reports are created. BO and Cognos, on the other hand, have predefined reports. Previously BO has been used to large extent, but IKEA is now trying to make Cognos a common tool. The use of predefined reports in Cognos ensures that everyone looks at, and compares, the same things.
Information from all stores, besides the franchise stores, is reported into MHS (Möbel Hus System) and transformed into IDW. The franchise stores use their own systems, and EDDA is one of the most used. Even if the measures are the same, the use of different systems implies different results of the measurements.
4.4 Measures within Supplying
What measures are followed up within a unit depends on what the main tasks of the unit are. It also varies over time depending on what the main focus areas for the organization are. One effect of the process organization is the development of measures that are not only optimizing one function, but the whole supplying process. However, there are still a large number of functional measures that aim to optimize certain activities within a function, and most functions follow-up a combination of functional and process measures.
When looking at measures from a management perspective, there are different levels of importance, i.e. some are important for managers and some are important for co-workers lower in the organization. Most units have a weekly or monthly management report that shows the most important measures and their results on an aggregated level, e.g. per HFB, Category or trading area. In addition to this highest level the measures are normally also