Volume 6 • Number 4 • December 2015 • pp. 70–86 DOI: 10.1515/mper-2015-0038
ANALYZING SUSTAINABLE COMPETITIVE ADVANTAGE:
STRATEGICALLY MANAGING RESOURCE ALLOCATIONS
TO ACHIEVE OPERATIONAL COMPETITIVENESS
Nurul Aida Abdul Malek
1,2
, Khuram Shahzad
2, Josu Takala
2,
Stefan Bojnec
3, Drago Papler
3, Yang Liu
2 1Universiti Tun Hussein Onn Malaysia (UTHM), Malaysia 2
Department of Production, University of Vaasa, Finland 3
Faculty of Management, University of Primorska, Slovenia
Corresponding author:
Nurul Aida Abdul Malek Department of Production University of Vaasa
Wolffintie 34, 65200 Vaasa, Finland phone: (+358) 451809585
e-mail: aida.abdmalek@gmail.com
Received: 4 September 2015 Abstract
Accepted: 14 September 2015 In today’s dynamic business environment, a key challenge for all companies is to make adap-tive adjustments to their manufacturing strategy. This study demonstrates the competiadap-tive priorities of manufacturing strategy in hydro-power case company to evaluate the level of sustainable competitive advantage and also to further analyze how business strategies are aligned with manufacturing strategies. This research is based on new holistic analytical evaluation of manufacturing strategy index, sense and respond, and sustainable competitive advantage models. These models help to describe, evaluate, and optimize resource alloca-tion to meet the performance requirements in dynamic decision making. Furthermore, these models evaluate operational competitiveness for manufacturing strategies according to the multi-criteria priority. The results show that the adjustments of competitive priorities in manufacturing strategies by implementing the proposed holistic analytical models are help-ful in strategically managing business operations. The discussion derives the most critical attributes in business operations while alignment of resource allocation with competitive priorities help to strategically focus those attributes. In conclusion, we argue that resource allocation and manufacturing strategies have become the most important capabilities in a business environment where companies focus to get a sustainable competitive advantage. Keywords
sustainable competitive advantage, sustainable operations, competitive priorities, sense and respond, manufacturing strategy index, adaptive strategy.
Introduction
European Union (EU) has embedded the aim to improve energy efficiency, reduce emissions and to raise the share of renewable energy significantly by 2020 as compared to 1990 to effectively balancing the economic development and environmental per-formance. In this global economic development era, manufacturing enterprises are trying to develop their competitiveness to survive and be stable. During the last two decades, this increased global
competi-tion and recent developments in product and process technologies have enhanced the interest of manufac-turing firms to focus on their core competencies and manufacturing strategies [1]. Relatively, the energy market has been deregulated to encourage competi-tion along with sustainable development and there-fore, the production of energy has been evoked to engage in a free market environment. It has been mentioned the benefits of decentralized electricity generation ranging from economic benefits, ecolog-ical benefits as well as improvement of sustainability
[2, 3]. However, the distribution network of the en-ergy is still operating in a natural monopoly where Energy Market Authority (EMA) is monitoring the transparency of network service pricing.
In this situation, firms need to syndicate forward-thinking strategies into their operations to sustain in future competitive environment under vibrant and complex business circumstances [4]. Moreover, firms need to holistically employ dynamic and multi-focused strategies into their business operations and decision-making process. For that reason, firms are more eager to think about competitive priorities that are significantly critical to perform a role of connec-tion among business strategies and manufacturing objectives [1, 4]. However, innovation and services have also been included in the manufacturing strat-egy range in modern studies [5–7].
Manufacturing strategy is typically driven by the overall business strategy of the organization and de-signed to maximize the effectiveness of production and support elements while minimizing costs [8]. Competitive priorities can help companies to analyze their category competence development in compar-ison with global context and the level of support-ed business strategies, as well as manufacturing ob-jectives [4, 9]. Therefore, a manufacturing strategy based on a business strategy includes three objec-tives as follows: competitive priorities, manufactur-ing objectives and action plans [10].
This study theoretically builds a resource-based assessment of the case companies where resource-based strategies are discussed. A resource refers to tangible or intangible assets owned by a company at a specific point of time that will give them strengths or weaknesses in the market they are competing in [11]. According to [12], there are four company strategy groups; 1) prospector, 2) analyzer, 3) de-fender, and 4) reactor, where reactor is not signif-icant and consistent. Similarly, according to [10], firms can calculate the global operative competitive-ness in each above mentioned strategy group through their proposed analytic calculation model to differ-ent multi-criteria weights for quality, cost, time, and flexibility.
As an associate member of EU, the enforcement of deregulation of energy market has been undertak-en gradually since 1999 in Slovundertak-enia [13]. [14] founds the deregulation has given some impacts on the dy-namics of market competition and demand different management approach as well as quality of service in the supply chain management among electricity providers in Slovenia. Prior to the enforcement, there were five regional electricity distribution enterprises in Slovenia. The main focus of this paper is Electro
Gorenjska Kranj which holds 10% of electricity mar-ket share. They are implementing hydro-electricity production which is considered as green electrici-ty production with electricielectrici-ty substitution from wa-ter resources reduces CO2 emissions from the non-renewal sources of electrical energy such as coal [15]. Although they are remaining the most significant in their region, this amount has been declining reflected from the addition of competitors into the market.
The objectives of this paper are to analyze and evaluate major competitive priorities and to propose how to improve company’s operational performance and competitiveness by answering the following re-search questions:
1. What kind of competitive priorities and manu-facturing strategies are utilized by companies in free market conditions to design their operations?
2. Which are highly focused competitive prior-ities and adopted manufacturing strategies in past and future?
3. Which critical attributes have to be improved in order to increase the overall operational competi-tiveness?
Moreover, the focus is to showcase the types of manufacturing strategies and competitive priorities by using different tools in Sense and Respond (S&R) method. This study analyzes the sustainable com-petitive advantage (SCA) in business units of case company and how the business strategies are sup-ported by the manufacturing strategies. To achieve the set targets, different tools: the Manufacturing Strategy Index (MSI) and Normalized Scaled Criti-cal Factor Index (NSCFI) were Criti-calculated. Most im-portantly, NSCFI has not been tested widely and very few case studies have been published previous-ly [16–18]. Moreover, this study enhances the scope of research conducted by [19] which highlighted the need to examine these models in new business sit-uations. Thus, this study contributes to quantify these established models in hydro-power case compa-ny to provide new discussion point of view in acad-emia.
For this purpose, the following assumptions are set for the objectives study and to find out the re-quired results. First, due to the transitions from monopolized market to free market among energy providers in Slovenia, we assume that all business units of this case company are moving towards an-alyzer strategy group that focuses on flexibility and gives a balanced weight to cost, quality, and time. Secondly, the distribution unit (sales) is following the best from a new strategy point of view of free market due to a small gap between the company and their customers or stakeholders along the supply chain.
Therefore, we assume that they understand the mar-ket orientation better and react accordingly in their strategy development.
Theoretical research background
In the compound and dynamic business environ-ment, companies need to rely on progressive business strategies for future competitiveness of business op-erations. Companies should focus more on dynam-ic business straggles holistdynam-ically in their operations based on their business objectives. Therefore, com-petitive priorities have a significant bridging role be-tween manufacturing objectives and business strate-gies [20]. In the same vein, sustainable competitive advantage has become an important critical factor in business operations by implementing a value creating strategy [21]. Furthermore, [22] argued that success of a firm hides in the balance between capabilities and resources that can be utilized to get a competi-tive advantage.
[23] argued that social, economic, and environ-mental factors are significant in sustainable devel-opment of energy concepts. [24] introduced the ini-tial idea of sustainable competitive advantage (SCA) in the form of SWOT (strength, weakness, op-portunity, threat) analysis to enhance the inter-nal strengths and demolish the weaknesses. Lat-er, [25] proposed a generic strategy which is based on the overall cost leadership, differentiation, and segmentation. Due to the extremely dynamic and turbulent business environment, this strategy was not applicable enough [26]. Thereafter, a resource-based view concept was presented in this dy-namic and turbulent business environment to get a competitive advantage. A resource-based view presents and explores the resource side of firms by studying firm’s resources more than the prod-uct side [11]. He proposed resource-prodprod-uct matri-ces in his study that are useful tools to analyze the firm’s resources and highlight the most sig-nificant resources to get a competitive advantage. According to [11], resources can be anything that causes strength or weakness of firms. Meanwhile, [21] claimed that resources of firms are rare and they are not only source of competitive advantage, but also to avoid threats. In this competitive, dynam-ic, and turbulent environment, firms behave differ-ently in situations and use their possible resources to achieve sustainable competitive advantage. For that reason, operations or manufacturing strategy, competitive priorities, and types of organizational adaptation need to be addressed in firm’s opera-tions.
Competitive priorities
and operations/manufacturing strategy
Competitive priorities are important and decisive variables for operation manager to better manage the global manufacturing issues [27]. The effective-ness of an operations strategy is determined by the degree of consistency between emphasized competi-tive priorities and corresponding decisions regarding operational structure and infrastructure [28]. There-fore, competitive priorities are mostly decided during the first phase of the development of manufacturing strategies to act as a link between the overall aim of the company and manufacturing objectives. Accord-ing to [29], there are four types of competitive pri-orities that a company can choose from, depending on the type of market that they are serving, which are: Quality (Q), Cost (C), Time/Delivery (T) and Flexibility (F).
[9] focused on the analysis of environmental man-agement as new competitive priorities in business operations. They found that environmental manage-ment can also affect the four types of competitive priorities positively. In addition, studies on supply chain management suggested that these four priori-ties can be narrowed down into two groups: efficien-cy and responsiveness. Typically, these groups pro-duce predictable demand of products with long shelf life. The second group is also referred as agile supply chain, which concentrates at quick and fast deliver-ies. Therefore, this type of supply chain focuses on two competitive priorities; flexibility and time. On the other hand, quality is also prioritized in both types of supply chains.
Operations strategy has been a topic of experien-tial study for 25 years. There are two different models that explain the link among competitive priorities: 1) the traditional trade-off model, and 2) the cumula-tive model [27]. Generally, operations strategy can be measured as companies’ importance on specific competitive capabilities like cost, delivery, flexibility, and quality. These objectives explain manufacturing operations of the firm. However, in current studies, two more capabilities have been added, i.e. innova-tion and services in the range of operainnova-tions strat-egy [5–7]. Moreover, adjustments in manufacturing strategies can be the result of improved operational competitiveness [10]. Green manufacturing strategy has not only becomes crucial in getting competitive advantage, but also contributes to the application of sustainable development philosophies [30].
Recently, the concept of strategy has been evolved adequately, which involves other aspects of it. The approach of strategy recognition and se-lection has been established because of the rapid
change of the business environment, which allows organizations to grab the strategic idea and plan-ning more firmly [31]. Furthermore, responsiveness, agility and leanness (RAL) possess a significant chal-lenge for holistic and multi-focused strategies. Three dimensions of RAL model explain the characteris-tics of each aspect, i.e. R – responsiveness covers the unexpected requirements, whereas A – agility deals with optimal cost structure and L – leanness reduces waste in all activities and resources [32]. Hence, man-ufacturing strategy is based on a set of considera-tions including future plans, arrangement of perfor-mance, evaluating position in market, and a percep-tion to overview the business activities and evaluate the competitors [33].
Moreover, [34] proposed conceptual framework where the focus was to analyze sustainability strate-gies from an innovation perspective. His framework provided three implementation strategies aligned with sustainability: resign, offensive, and defensive. Similarly, [35] discussed “defensive” and “offensive” strategies in their study where the argument was developed based on these strategies. They argued that firms implement defensive strategy when sup-plier management for risks and performance is re-quired and offensive strategy is implemented when supply chain management for sustainable products is required in their operations. [36] created value and strategic success by presenting a dynamic framework for implementing sustainability. They distinguished internal and external strategies based on the current and future operations.
Types of organizational adaptation
While discussing how an organization can adapt to an uncertain and constantly changing business en-vironment, [12] study led to the development of the adaptive cycle model. Their discovery shows that top management choices and decisions also have great impacts on the company’s strategy. They however ar-gued that the strategic-choice approach explains the organization’s perceptions of environmental condi-tions and the decisions it makes in with coping these conditions [12]. There are four strategic types of or-ganizations, namely defenders, analyzers, prospec-tors, and reactors [12]. 1) Defenders have narrow product-market domains. According to [20], the most important factor in defender strategy is cost as it relates to the competitiveness ranking of quality, cost, time and flexibility. 2) Analyzers use formal-ized structures and techniques to operate in a sta-ble product-market domain but in changing environ-ments, they look out for innovative ideas from their competitors and quickly adopt the most promising
ones. In the competitiveness ranking of quality, cost, time and flexibility, analyzers focus mainly on flex-ibility, which gives them a balanced focus on cost, quality and time [20].
Meanwhile, 3) prospectors are organizations which continually seek to carry out research in de-veloping new and innovative products. Considering the quality, cost, time and flexibility competitive-ness ranking, prospectors are known to focus main-ly on the quality [20]. Lastmain-ly, 4) Reactors: accord-ing to [12], changes and uncertainties are perceived in the reactor organizations, but their top manage-ment are unable to respond effectively until they are compelled by environmental pressures. Hence, due to their highly unstable structure, reactors change over time to one of the other three groups [37].
Table 1
Definitions of variables for critical success factors and manufacturing strategies (adapted from [38]).
Variables Definitions
Q The weight of quality in manufacturing strat-egy or resource allocation
C The weight of cost in manufacturing strategy or resource allocation
T The weight of time/delivery in manufacturing strategy or resource allocation
F The weight of flexibility in manufacturing strategy or resource allocation
P Competitiveness index of manufacturing strat-egy (MSI) or resource allocation (RAI) in prospector group
A Competitiveness index of manufacturing strat-egy (MSI) or resource allocation (RAI) in an-alyzer group
D Competitiveness index of manufacturing strat-egy (MSI) or resource allocation (RAI) in de-fender group
Analytical model development
The term sense and respond (S&R) as a busi-ness concept first appeared in the article by [39]. The S&R thinking was developed by [40] and [41] to an-alyze dynamic business strategies [42]. S&R model is a business management concept used by organi-zations to analyze applicable strategies for rapidly changing business structures. The ability to quickly adjust the processes will be a decisive factor in the concurrent economy [42]. The main outcome of this method is to provide signals so that companies can react accordingly based on the “traffic lights” indi-cator given by the result. Red, yellow and green bars indicate the status of each attribute. Red represents critical attributes which require immediate attention from companies. Yellow signifies potentially critical
attributes which may or may not be critical in the future and the green indicates the non-critical at-tributes.
The S&R thought was utilized by [43] to devel-op the devel-operative management system by introducing critical factor index (CFI) [42]. Based on the CFI in-troduction, the S&R model has undergone four im-provement stages from CFI to Balanced BCFI to SCFI and NSCFI. Generally, the aim of each mod-el is similar, which is to calculate the status of each attribute understudied. The four-stage models have common parts as part of the equation and different parts as numerator. The CFI was introduced by [43] for the first time to interpret and evaluate the crit-ical factors of strategic adjustment, which can sup-port the strategic decision-making phase. The BC-FI was developed by [44] based on the principle of the CFI model. On the other hand, the SCFI mod-el was discussed and devmod-eloped by [42] which fur-ther tested and published by [16–18]. Along with the study, a new S&R model, named NSCFI, was developed based on previous models [16]. For this reason, this study uses NSCFI model that has not been tested widely, and very few case studies have been published previously. Furthermore, this model has proven to generate results which reflect the real situation [38].
The analytical models for manufacturing strate-gy are used to calculate the operational competitive-ness indexes of companies in different competitive groups, namely prospector, analyzer and defender [12]. The theory of analytical models is subsequent-ly described by four main criteria: cost, quality, time and flexibility. Based on the analysis of the four main criteria, the manufacturing strategies are analyzed. The methods of calculating the priority weights as well as manufacturing strategy indexes are adopted through [38].
Table 2
Definitions of variables (adapted from [38]).
Variables Definitions
CFI The old model (critical factor index) which measures the level of resource allocations in the defined attributes
BCFI The old model (balanced critical factor index) which measures the level of resource alloca-tions in the defined attributes
SCFI The old model (scaled critical factor index) which measures the level of resource alloca-tions in the defined attributes
NSCFI The new model (normalized scaled critical fac-tor index) which measures the level of resource allocation in the defined attribute
Sustainable competitive advantage
The concept of competitive advantage has been significantly discussed over the last three decades [45, 46]. He argued that competitive global business ap-proaches are grounded on differentiation by distinc-tive knowledge of product’s quality and technolo-gy. The notion of excellence in the business world provides a foundation for a dynamic competitive-ness, which is a source of sustainable competitive advantage [47, 48]. Similarly, manufacturing man-agers have a key role in achieving superior competi-tive performance by accompeti-tively participating in strate-gic planning processes [49, 50]. [11] and [21] orig-inated sustainable competitive advantage based on the attributes of resources and capabilities, while [51] contemplated certain manufacturing competitive pri-orities and dynamic capabilities along with unique decision strategies for achieving a sustainable com-petitive advantage.
Sustainable competitive advantage is a business strategy based on firm’s resources that support firms to sustain their competitive advantage by outper-forming others in a competitive market [52]. [53] ar-gued that employing customer oriented business strategies by exploiting unique competences and re-sources bring a sustainable competitive advantage for firms. Close relationships with suppliers, customers, and employees enable firms to rationalize their busi-ness strategies in favor of firm’s competitive advan-tage. Moreover, sustainable competitive advantage is a concept of achieving financial and market ben-efits, and distinctive dynamic capabilities which has emerged as a vital research field [54–56]. Recently, several researchers have identified the significance of sustainable competitive advantage as a source of de-veloping core capability, knowledge sharing, market innovation, global resources, and most importantly positive psychological capital and vice versa [57–62]. Keeping these important factors into consideration identified by researchers, this study implement SCA to identify the significant factors that help compa-nies not only to enhance their performance but also sustain the best manufacturing strategies to get a competitive advantage.
The SCA analysis provides a clear view for the management of companies to prioritize their manu-facturing strategy to get a competitive advantage. It explains the risk probability, where case companies might have to consider changing the manufactur-ing strategy in different competitive groups, namely prospector, analyzer, and defender. Sustainable com-petitive advantage (SCA) results are obtained from the integrated MSI and S&R results of the study. To achieve the necessary level of reliability of the
results, three methods of validation (i.e. MAPE: Ab-solute Percentage Error, RMSE: Root Mean Squared Error, and MAD: Maximum Deviation) are utilized to ensure a moderate level of reliability in the results. The equations for calculating risks are obtained from Takala et al. [17].
Research methods
This paper consists of a case study based on hydro-power integrated supply chain in Slovenia. This well-known group operates in electricity chain which ensures the production, network, and distrib-ution of electricity in the northwestern part of Slove-nia. These business units are controlled by Elec-tro Gorenjska Kranj within the company. Producing electricity from hydro power has become a quite im-portant necessity and cost-effective system of energy technology considering the economic, social, and en-vironmental factors [63]. The aim of the production unit is to improve and maintain their current opera-tions including their facilities and human resources. Furthermore, network unit focuses on providing qual-ity, punctual and cost-efficient operations in deliver-ing their service to end customer. Overall, the net-work unit is also aiming to actively participate with various activities that encourage sustainable devel-opment opportunities in Slovenia. Distribution unit focuses on improving the cost performance of the company including in attaining favorable purchase price of the electricity.
Methodologically, this research employs construc-tive research approaches which focusing on solving problems through innovative constructions and si-multaneously contributes to the related field of study where it is applied [64]. The suggested innovative constructions are also attempted to be tested to see the relevancy of its applicability. For this study, the innovative constructs is the integrative holistic sys-tem for the identification of critical attributes and manufacturing strategy. The results generated from the models would be validated by the case company as a weak market test. If they are satisfy with the result obtained, further actions for improvement will take place.
This research approach involves close participa-tion between practiparticipa-tioners and researchers in order
to appropriately identify the actual problem and pro-pose the fitting solution as well as to achieve rich de-scriptions to the scope of research and also best con-tributing to the related knowledge field [65]. There-fore, this company was chosen to be the case com-pany of this study due to the close collaboration be-tween research authors and management of the com-pany. By reason of the complexity of data collection procedure, it is crucial for the researchers to have a close link with the respondent to assure the qual-ity and reliabilqual-ity of the data collected. It is also significant to make sure the respondents understand the instructions and questions listed in the question-naire so that deep and meaningful analysis can be performed. Moreover, the experts and developers of these models are also involved in this study, which increases the validity of data analyzing.
Data collection and data analysis
Data collection for the research is tied partic-ularly to the method being undertaken. The gen-eral method used for the research was by sending out web-questionnaires to managers of the top levels and operational levels in the business units in No-vember 2013. Questionnaires containing percentage value of multi-criteria priority weights were sent to top level management. The head of each business unit responded with their answers according to their own evaluation towards each business unit’s strate-gy. Questionnaires containing organizational compe-tences by [43] comprising four categories; knowledge and technology management, processes and work-flows, organizational systems and information sys-tems were sent to operational level managers of each business unit. Thirteen respondents answered our questionnaires comprising: five from the pro-duction unit, four from the network unit, and four from the distribution unit. All of these 13 respon-dents have sufficient knowledge about the opera-tions of the company and are decision makers or at least working in middle management group. In total, there are 21 attributes that are further cat-egorized into four types of competitive priorities; quality, cost, time and flexibility. It also shows the deviations of experiences and expectations. Ta-ble 1 contains the questionnaire sample used in this study.
Table 3 Questionnaire sample.
Expectations Experiences Direction of development Development experience
Attributes (1–10) (1–10) Worse Same Better Worse Same Better
Attribute 1 Attribute 2
Table 4
Definitions of variables used in the study (adapted from [38]).
Variables Definitions
Expe-riences The level of experiences in a scale of 1–10 in the defined duration Expecta-tions The level of expectations in a scale of
1–10 in the defined duration Better, worse The trend of the development
situ-ation in a choice of better, same or worse in the defined duration. The counts of ‘better’ and ‘worse’ are de-rived into percentage weights Perfor-mance index Measures the average of experiences
scaling between 0 and 1, and the larg-er value means a bettlarg-er plarg-erformance experience of the attribute
Impor-tance index Measures the average of expectations scaling between 0 and 1, and the larg-er value means a more important ex-pectation of the attribute
Gap index Measures the gap between experi-ences and expectations. The value 1 means that there is no gap; the value above 1 means that experiences are lower than expectations and the val-ue below 1 means that experiences are higher than expectations Develop-ment index Measures the direction of
develop-ment compared to the old situations. The value 1 means that performance remains on the same level; the val-ue above 1 means that performance is going worse and the value below 1 means that performance is going bet-ter
MSI Competitiveness indexes of manufac-turing strategy in prospector, analyz-er and defendanalyz-er groups
RAI Competitiveness index of resource al-location in prospector, analyzer and defender groups
SCA The final evaluation results indicat-ing the sustainability level of the competitive advantage during the measured period.
The overall flow of data collection and data analysis
The analysis of the data starts with a descrip-tive analysis where the percentage given by the top management is carefully evaluated to set the weight of each competitive priority based on their point of view. This result will be used again later as an input for a later part of the analysis.
Consequently, the analysis is going deeper by an-alyzing the data given by the operational level by using S&R model which is NSCFI. As mentioned in the literature, NSCFI is the latest and improved an-alytical models in the S&R analysis to evaluate
com-petitiveness of a company based on past and future resource input levels. The model has proven to gen-erate result that best reflect the actual situation [18, 38, 66]. For this research, NSCFI will measures com-petitive priority weighting according to resource allo-cations scale assessed by the informants correspond-ingly for all business units. It generates resource allo-cation indexes for all 21 attributes and these indexes were then accumulated according to their competi-tive priority group so that the allocations can be seen at the priority group level both in past and future re-spectively.
Based on that, deviations from past to future val-ues are calculated to acquire the trend of changes in resource allocations. In order to identify the sta-tus of each attributes, they are evaluated individu-ally based on resource allocation indexes by gener-ated by NSCFI. High value indicates over resourced whilst low value demonstrates the opposite. Other than that, the attribute is considered to be at a sat-isfactory level. Additionally, the development trend of each attribute from past to future was analyzed. The interest is to seek for attribute with worse trend which requires further improvement from organiza-tion’s side. The trend is evaluated based on the fol-lowing conditions; (1) if the attribute’s status is sat-isfactory in both past and future, the trend is con-sidered to be unchanged and marked with “–”, (2) if the attribute’s status changes from satisfactory to either over resourced or low resourced, it means the trend is going worse development and (3) if the status change from either over resourced or low resourced to satisfactory, the trend is in better development. Essentially, the results generated from NSCFI were folded in various layers and the interpretation has been done for each layer to establish valuable con-clusions as well as providing the most benefit to the case company.
In order to identify the type of strategy orienta-tion adopted by each business unit, their operaorienta-tional competitiveness indexes are calculated. The index-es are generated by rindex-espective analytical model for prospector, defender and analyzer. The main inputs for these analytical models derived from the weights of Q, C, T and F given by the top management as well as those calculated by NSCFI. In regards to that, there are two main outcomes generated from the an-alytical models. They are: (1) the numeric values that represent each strategy group from top man-agement’s point of view which to be defined as MSI while the other one is (2) the numeric values that represent each strategy group from resource alloca-tions point of view which to be defined as RAI. The strategy type with the highest calculated value is
as-sumed to be adopted by the corresponding business unit. The MSIs and RAIs were generated for both past and future periods and will be further analyzes to see the trend of changes through their deviations. Ultimately, the analysis continues with SCA analysis where the consistency of manufacturing strategies (MSI) and resource allocations (RAI) are evaluated. To achieve this aim, the evaluation was performed based on the results generated by MAPE and RMSE. The validation results are in the range of 0 to 1, where 1 indicates perfect consistency be-tween the strategies developed in the past and fu-ture compared to the resources that have been or to be allocated. Therefore, high indexes represent good support of resource allocations in strategy implemen-tation which is the key capability in achieving sus-tainable competitive advantage.
The following Fig. 1 summarizes the flow of data collection for data analysis.
Fig. 1. The flow of the data collection and data analysis.
Analysis results
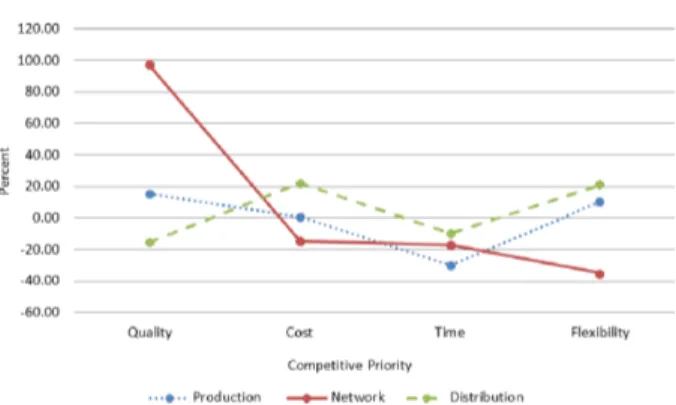
Figure 2 shows the percentage of deviation of multi-criteria priority weights of Q (Quality), C (Cost), T (Time) and F (Flexibility) from past to future based on top management. The data given by the informants is fully based on their subjective assessment of the company’s strategy. The deviation reflects the decision where the resources should or
should not be allocated in the future period. Based on these decisions, the positioning of the company in the market can be determined by defining their preference competitive priorities which ultimately in-dicates their manufacturing strategy. Positive devi-ation means the resources allocated for a particu-lar competitive priority are increased. On the other hand, negative deviation means the resources allo-cated are decreased.
Fig. 2. Percentage of deviation of multi-criteria priority weights from past to future.
The result shows the priority that is expected to be improved according to the opinions of the top management for each unit. Negative or zero deviation shows that a particular priority does not need fur-ther additional resources as they are good at present. From Fig. 2, it can be seen that the highest increase in resource allocation for both production and distri-bution units is flexibility. The calculated sum of re-source allocation for each priority and business unit demonstrate that the production unit is focusing on quality while the distribution unit is focusing on cost. However, the deviations show both are mostly in-creasing the allocation for flexibility. On the con-trary, the network company is assigning most of their resources in time but the deviation values indicate that they are increasing the portion for quality and reducing time.
Based on the sense and respond method, NSCFI model generate results that demonstrate the direc-tion of development from past to future values of re-source allocation among competitive priorities under this study. From this result, the overall concentration of resource allocation in past and future is defined in each unit. Figure 3 points out the percentage of de-viations of multi-criteria priority weights of Q, C, T and F from past to future based on the results cal-culated by NSCFI models.
Fig. 3. Percentage of deviations of multi-criteria priority weights from past to future based on NSCFI models.
In the production unit, the overall result reveals that they are focusing on flexibility. However, the deviation values show that they are putting more resources into quality. Nevertheless, the amount of deviation among other competitive priorities is low and this indicates the allocations are almost balance to all priorities with the lowest amount assigned to time. On the other hand, past NSCFI values show that the network unit is focusing on flexibility but shifting to quality in the future. The deviation figure supports this by showing the highest values in qual-ity. Meanwhile, both past and future values indicate that the distribution unit is concentrating on qual-ity. Yet, at the same time, they are attempting to improve their flexibility as well by having high value of deviation in this priority.
To highlight the main finding of sense and re-spond’s analysis, the study has shortlisted the at-tributes with a worse trend development in each business unit. According to the evaluation, these at-tributes are critical and need further improvement on resource allocations to have a long-term success in the market they are competing in. These attribut-es are sent for weak market tattribut-est accordingly to all business units. The results were presented and dis-cussed and their feedbacks were collected and doc-umented for verification. Table 5 shows the list of suggested critical attributes in detail and the at-tributes are categorized according to their business unit and competitive priority group for better fo-cus in future improvement. Out of 21 attributes
an-alyzed, six critical attributes were identified under production unit and nine from network and distrib-ution.
As shown in Table 5, the production company consists of two critical attributes: ‘quality control of products, processes and operations’ and ‘inno-vativeness and performance of research and devel-opment’. The first attribute belongs to the quali-ty group while the latter is cost. The study sug-gests the production unit to pay attention to these two attributes due to the worse trend they had from past to future. Meanwhile, the study propos-es three attributpropos-es for improvement in the network unit. The first two attributes are under cost group that are related to ‘knowledge and technology dif-fusion’ and ‘code of conduct and security of da-ta and information’. Another attribute is ‘commu-nication between different departments and hierar-chy levels’ which lies under the time group. Among all three units, the distribution unit consists of the most number of attributes from three different pri-ority groups.
In sum, the study recommends seven attributes to be focused on. The first two attributes belong to the quality group: ‘on-time deliveries to customer’ and ‘control and optimization of all types of inventories’. As the final units before they reach their customer, these two attributes play important roles to ensure the smooth flow of products to the end user. In the meantime, the next two attributes belong to the cost group. The study suggests more attention should be given to ‘knowledge and technology diffusion’ and ‘reduction of unprofitable time in processes’. The last three attributes are under flexibility group; ‘training and development of the company’s personnel’, ‘short and prompt lead-times in order-fulfillment process’ and ‘well-defined responsibilities and tasks for each operation’.
Based from the feedbacks, all business units were agreed with results at the same level. According-ly, some of the critical attributes identified were proven critical since they are already at improve-ment stages while one is completely solved. There-fore, the results are validated and reflect the real sit-uation.
Table 5
List of critical attributes under each business unit.
Production Network Distribution
Critical attribute Feedback Critical attribute Feedback Critical attribute Feedback Quality On-time deliveries to customer Agree about services, while electricity sup-ply is on-time. On-time deliveries to customer Agree about services, while electricity sup-ply is on-time. On-time deliver-ies to customer Agree about services. Quality control of products, processes and operations Agree (there are complains about accounts) Usability and functionality of information systems Agree as they had problems, but some improvements are with new provider of remote con-trol
center.
Control and op-timization of all types of inven-tories Agree. – – Usability and functionality of information systems It is not anymore a problem. Cost Innovativeness and perfor-mance of research and develop-ment Agree (it is at early stage) Knowledge and technology dif-fusion Partly disagree due to some im-provements. Knowledge and technology dif-fusion Agree about marketing. Knowledge and technology dif-fusion Agree, but there have been improvements in the meantime Leadership and management systems of the company Agree with market developments. Remote control center has brought some improvements. Reduction of unprofitable time in processes Agree. – Code of conduct and security of data and infor-mation Agree. – Time – Communication between differ-ent departmdiffer-ents and hierarchy levels Agree. Availability of information in information systems Agree. Flexibility Adaptation to knowledge and technology Partly disagree: they have introduced remote control center, which has substituted employment Short and prompt lead-times in order-fulfillment process
Agree. Training and
development of the compa-ny’s personnel Agree. Lack of electrical engineers. Well-defined responsibilities and tasks for each operation Partly disagree: on 1 January 2015 they have introduced ISO standard 9001 with monitor-ing input and output flows with project organization. Adaptation to changes in demands and in order backlog Agree due to lack of coherent approach. Short and prompt lead-times in order-fulfillment process Improvements this year. – Well-defined responsibilities and tasks for each operation Agree due to present frag-mentation. Well-defined responsibilities and tasks for each operation
Sustainable competitive advantage (SCA) analysis
In order to react to their environment, companies can be generally defined into four types of strate-gic groups: P: Prospector, A: Analyzer, D: Defender, and R: Reactor. The features of each strategy deter-mine their positions in the market. Figure 4 shows the trend of strategy orientation among all business units according to their manufacturing strategy and resource allocations indexes respectively in past and future.
Fig. 4. Percentage of deviation from past to future strat-egy based on the results generated by MSI and RAI.
The MSI tendency for production describes their strategic focus was more on prospector in the past but shifted to analyzer in the future which leads this business unit from quality to flexibility orienta-tion. The pattern is almost similar with their RAI’s trend except for past period which they are more into analyzer instead of prospector. Nevertheless, fu-ture RAI indicates that they are moving towards the same strategic focus as the MSI. For network busi-ness unit, their aim is to be efficient in the quality of delivering their product and this influences the priority within their operations. MSI indicates con-centration in prospector strategy both in past and future. On the other hand, the RAI in both time pe-riods do not support the MSI by directing more in-to analyzer strategy. Similarly, distribution unit also does not support alignment as both periods indicate unmatched strategy type orientation between their MSI and RAI indexes. The manufacturing strategy is more in the direction of defender whilst the RAI lead to analyzer strategy.
Based from RAI values, it can be seen that all business units are tend to be in analyzer group both in past and future which is a strategy that balanc-ing resource allocations toward all four competitive priorities and assumed to be less risky as all com-petitive priorities are supported equally. However, this approach is not competitive if the manufacturing strategies are intentionally developed to be directed into another type of strategy orientation which to better suit the market competition.
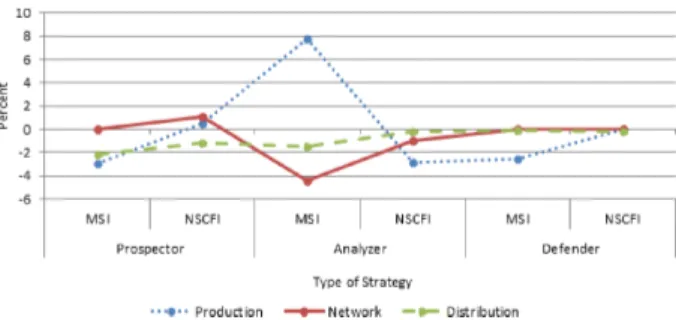
The SCA analysis is further elaborated in Fig. 5 where the percentages of deviation from the past strategy to future strategy for each model are taken into consideration. In this perspective, the amount of changes from past to future strategy based on the results generated by MSI and NSCFI are take in-to account and can be seen. The numbers along the line represent the amount of deviation in percent-age values. Positive deviation means the values are increased from past to future. On the other hand, negative or zero deviation means the values are de-creased or not shifting at all.
Fig. 5. Percentage of deviation from past to future strat-egy based on the results generated by MSI and NSCFI.
The overall results for both in past and future pe-riods lead the production unit to the same strategy, which is analyzer. This is supported by the highest amount of deviation in the analyzer strategy. There is a possibility for the company to have minor fea-tures of prospector strategy as there is a slight posi-tive increment in that category. Meanwhile, the net-work unit also seems to have the highest increment in the analyzer strategy. Nevertheless, their MSI val-ues which represent responses from the top manage-ment show the opposite. This supports the overall results in the past and future period where MSI and NSCFI do vary in generating network’s type of strat-egy. From the result found in SCA analysis, there is no absolute result on which type of strategy does the distribution unit belong to as each model leads to a different strategy. However, the deviation val-ue indicates the highest increment is in the analyzer strategy with 5 percent changes. Nevertheless, this does not represent the actual strategy adopted by this unit.
The ultimate aim of this study is to evaluate op-eration strategy developed in the past and future against the resources that have been or to be allo-cated by the management of all business units. To achieve this aim, the evaluation was performed based on the results generated by MAPE and RMSE. The validation results are in the range of 0 to 1, where 1 indicates perfect consistency between the strategies
developed in the past and future compared to the re-sources that have been or to be allocated. Therefore, high indexes represent good support of resource al-locations in strategy implementation which is a key capability in achieving sustainable competitive ad-vantage.
The result calculated for the validation is illus-trated in Fig. 6. Past and future indexes are ex-pressed by the lines respectively to all business units based on MAPE and RMSE. The comparison high-lights production as the dominant business unit in a right direction. Their future index’s values are high-er than the past index for both models which means their manufacturing strategy is sustainable and com-petitive. On the other hand, network and distribu-tion unit do not show competitive result where the future values hold lower than past value. These indi-cate misalignments in relation to resource allocations and uncompetitive steer into the intended direction of their manufacturing strategy implementations.
Fig. 6. Calculated validation based on MAPE and RMSE.
Discussion
In the following Table 6, the summary of results according to the MSI and NSCFI (for three vertical-ly integrated business units) is defined. The compet-itive priorities and strategy group for the case com-pany are mentioned according to their operations in comparison to two methodologies (MSI and NSCFI).
Table 6
Competitive priorities for each company.
Past Future
MSI NSCFI MSI NSCFI
Production Quality Cost Quality Flexibility Network Time Flexibility Time Quality Distribution and DeliveryCost
(same weight)
Quality Cost Quality
Competitive priorities act as a link between the overall aim of the company and manufacturing ac-tivities. The competitive priorities of each unit have
been identified in the analysis. The alignment of competitive priorities between the top management level and operational level management has been compared. This analysis is also aligned with one of the manufacturing strategy aspects (fit) identified by [67]. They identified strategic intent, focus, fit, and resource configuration to evaluate and configure them to get a competitive advantage. In this study, each business unit is categorized into the type of manufacturing strategy (past and future) based on the competitive priorities.
The result found by this study is consistent with the previous work done by [16, 17], which describes that NSCFI models are valid tools to perform such analysis that can assist managers to review their cur-rent strategy and further make decisions accordingly. Common vision towards strategy planned is crucial between the top level and operational level manage-ment to avoid resources to be misspent. Interesting-ly, the results show that competitive priorities be-tween the top level and operational level manage-ment are not particularly aligned in all business units of case company. This suggests that the judgment of the company’s representative towards their respec-tive company’s strategy is not in coherence with the resources allocated. It is suggested for managers to make adjustment accordingly in resources allocation to make sure in the future they are following the intended direction as planned [67]. The competitive landscape has now encouraged companies to compete not only on their own capabilities but also together with their entire supply chain. Therefore, it is cru-cial for each of the company’s business unit within the supply chain to align their competitive priori-ties all across functional areas. We found very rele-vant results regarding competitive priorities that are aligned with the objectives of this study. Additional-ly, this study has also found that evaluating compet-itive priorities help to identify critical attributes that must be improved to enhance the overall operational competitiveness. These critical attributes are listed in Table 5.
The second main finding of the study discovered the strategy group of each company belongs to. The following Table 7. shows the type of strategy group of each business unit in detail.
Table 7
Type of strategy group for each company.
Past Future
MSI RAI MSI RAI
Production Prospector Analyzer Analyzer Analyzer Network Prospector Analyzer Prospector Analyzer Distribution Defender Analyzer Defender Analyzer
According to the SCA analysis, the production unit generally focuses on flexibility in implementing their manufacturing strategies during the transitions from monopolized market to free market among en-ergy providers in Slovenia. They seem to follow well the free market conditions and being flexible to adapt to the intensity of market competition, as well as to increase new customer and new market. This is also supported by the deviation value from past to future period which mostly increased in flexibility. The risks calculated are almost zero and decrease from past to future. This indicates the company is sailing towards the intended direction developed from the beginning. The network unit does not follow well the free market trend. It remains competing as a prospector group that focuses on quality as their main priority in executing their manufacturing strategy. It is possi-ble due to the dominant ownership of the instrument used for the distribution of electricity in the north-western part of Slovenia. It is common for a company to belong to a prospector’s group in such monopo-lized environment without many competitors. The risk level calculated is increased to 10 percent from past to the future values and the highest among oth-er companies along the supply chain. This finding suggests the company deviates away from the initial strategy developed by the top management. From the analysis, it is found that the distribution com-pany that works closely with the end customer also does not follow the free market trend. They empha-size more on quality and this made them to be in the prospector group. Even though the risk level is be-low 10 percent, the values are increasing from past to future. Nevertheless, the deviation value shows that there is an increment in the analyzer strategy from the past to future values. However, the overall value leads this unit to prospector type of strategy.
[14] found the deregulation of the energy ket has given some impacts on the dynamics of mar-ket competition and demand different management approach as well as quality of service in the sup-ply chain management among electricity providers in Slovenia. Due to the transitions from monopolized market to free market among energy providers in Slovenia, we assumed the business units of case com-pany are moving towards analyzer strategy group which is focused on flexibility and gives a balanced focus on cost, quality and time in order to win big-ger market share. We also assumed the distribution unit (sales) is following the best from the new strat-egy point of view of the free market due to the small gap between their unit and customers or stakehold-ers along the supply chain. The distribution unit is assumed to understand the market better and react
accordingly at their strategy development. Howev-er, based from the findings of this research, the only player along the supply chain which is moving to-wards analyzer group is the production unit. The other two units are still focusing on other priority on implementing their strategy rather than flexibili-ty. As a result, we have identified the manufacturing strategy groups of each business unit according to their manufacturing strategy.
Managerial implications of this study suggest that the allocation of resources should fit the mar-ket situation to get a competitive advantage. The results derived from NSCFI, lead to the conclusion both in past and future that can assist managers to review their current business strategy. From the dis-cussion above, this study recommends to operational managers that the allocation of resources should be aligned with the top level management’s strategies and to make sure in the future they are following the intended directions. Apart from that, this study also suggests to the managers that paying more at-tention to identified critical attributes and allocating significant resources properly will improve the overall operational competitiveness. The competitive land-scape now has encouraged companies to compete not only on their own capabilities but also with the entire supply chain. Therefore, it is crucial for each of the business unit within the supply chain to align their competitive priorities all across functional areas. For this purpose, this study suggests managers to align competitive priorities with organizational capabili-ties. Moreover, analytical models used in this study will assist managers to review the current situation of resource allocation for strategy implementation and in case of improvement in the future.
Conclusions
This paper has analyzed the current and future resource allocations of the case company for sustain-able competitive advantage (SCA) using unique an-alytical models. These models support in decision making of manufacturing strategy development in dynamic and turbulent business environment by tak-ing resources allocation into consideration. Further-more, this study has determined and analyzed the competitive priorities and manufacturing strategies utilized by the case company in free market con-ditions to design their operations. The study iden-tifies the critical factors based on past experience and future expectation between different organiza-tional levels. The study has evaluated and suggested significant adjustments of competitive priorities in manufacturing strategies to get operational
compet-itiveness in free market. In this study, the assump-tions were to analyze how different strategy groups are moving towards free market. In the same vein, we presumed that the distribution/sales unit follows the free market. However, this assumption was not met due to lack of allocation of resource in this business unit to fit the analyzer type of strategy.
Knowledge and technology management process-es and workflows, organizational system, and in-formation system are the organizational competen-cies that bring significant value to get a sustain-able competitive advantage [59]. Similarly, this study has found most of the critical attributes in knowl-edge and technology management competency that need to be improved in all business units of the case company. For practice, these approaches have substantial perceptions empirically into the opera-tional competitiveness where competitive priorities should be aligned and configured with allocated re-sources [67]. In free market situation, every compa-ny wants to keep its market share. In this situation, prospectors and defenders groups move towards the analyzer group to get more flexibility and
competi-tive advantage. The necessity to prioritize flexibili-ty in their manufacturing strategy still requires fur-ther improvement. In conclusion, we argue that re-source allocation and manufacturing strategies have become the most important capabilities in business environment where companies focus to get a sustain-able competitive advantage.
This study focuses only on the comparison of a business unit operating under one case company. Future research can focus on multiple case studies in different countries to compare the resource allocation with competitive priorities. A large number of infor-mants can provide a better overview of manufactur-ing strategies and competitive priorities of a compa-ny that will ultimately help academia to generalize the overall results. Besides, this study focuses only on three manufacturing strategy types; “prospector”, “analyzer”, and “defender”. Future research can in-clude “reactor” into these types of manufacturing strategies. This promising strategy type can enrich the discussion of manufacturing strategy types and enable competitiveness in turbulent business envi-ronment.
Appendix
Attributes Competitive Priority Symbol
Knowledge & Technology Management
Training and development of the company’s personnel Flexibility F1
Innovativeness and performance of research and development Cost C1
Communication between different departments and hierarchy level Time T1
Adaptation to knowledge and technology Flexibility F2
Knowledge and technology diffusion Cost C2
Design and planning of the processes and products Time T2
Processes & Work Flows
Short and prompt lead-times in order-fulfillment process Flexibility F3
Reduction of unprofitable time in processes Cost C3
On-time deliveries to customer Quality Q1
Control and optimization of all types of inventories Quality Q2
Adaptiveness of changes in demands and in order backlog Flexibility F4
Organizational systems
Leadership and management systems of the company Cost C4
Quality control of products, processes and operations Quality Q3
Well-defined responsibilities and tasks for each operation Flexibility F5
Utilizing different types of organizing systems Flexibility F6
Code of conduct and security of data and information Cost C5
Information systems
Information systems support the business processes Time T3
Visibility of information in information systems Time T4
Availability of information in information systems Time T5
Quality & reliability of information in information systems Quality Q4
References
[1] Kim J.S., Arnold P., Operationalizing
manufactur-ing strategy: An exploratory study of constructs and linkage, International Journal of Operations &
Pro-duction Management, 16 (12), 45–73, 1996. [2] Karger C.R., Hennings W., Sustainability
evalua-tion of decentralized electricity generaevalua-tion,
Renew-able and SustainRenew-able Energy Reviews, 13 (3), 583– 593, 2009.
[3] Fraser P., Distributed generation in liberalised
elec-tricity markets, International Symposium on
Dis-tributed Generation: Power System and Market As-pects, pp. 1G–12, 2002.
[4] Si S., Liu Y., Takala J., Sun S., Benchmarking and
developing the operational competitiveness of Chi-nese state-owned manufacturing enterprises in a global context, International Journal of Innovation
and Learning, 7 (2), 202–222, 2010.
[5] Boyer K.K., Pagell M., Measurement issues in
em-pirical research?: improving measures of operations strategy and advanced manufacturing technology,
Journal of Operations Management, 18 (3), 361– 374, 2000.
[6] Christiansen T., Berry W.L., Bruun P., Ward P.,
A mapping of competitive priorities, manufactur-ing practices, and operational performance in groups of Danish manufacturing companies, International
Journal of Operations & Production Management, 23 (10), 1163–1183, 2003.
[7] Dangayach G.S., Deshmukh S.G., Practice of
man-ufacturing strategy: Evidence from select Indian au-tomobile companies, International Journal of
Pro-duction Research, 39 (11), 2353–2393, 2001. [8] Williams F.P., D’Souza D.E., Rosenfeldt M.E.,
Kas-saee M., Manufacturing strategy, business strategy
and firm performance in a mature industry, Journal
of Operations Management, 13 (1), 19–33, 1995. [9] Jabbour C.J.C., Maria da Silva E., Paiva E.L.,
Al-mada Santos F.C., Environmental management in
Brazil: is it a completely competitive priority?,
Jour-nal of Cleaner Production, 21 (1), 11–22, 2012. [10] Takala J., Kamdee T., Hirvela J., Kyllonen S.,
Ana-lytic calculation of global operative competitiveness,
IAMOT International Conference on Management of Technology, Management of Technology for Ser-vice Economy, IAMOT 2007.
[11] Wernerfelt B., A resource-based view of the firm, Strategic Management Journal, 5 (2), 171–180, 1984.
[12] Miles R.E., Snow C.C., Organizational strategy,
structure, and process, McGraw-Hill, 1978.
[13] Filippini M., Hrovatin N., Zoriˇc J., Efficiency and
regulation of the Slovenian electricity distribution companies, Energy Policy, 32 (3), 335–344, 2004.
[14] Papler D., Bojnec S., Electricity supply management
for enterprises in Slovenia, International Journal
of Management and Enterprise Development, 4 (4), 403–414, 2007.
[15] Bojnec ˇS., Papler D., Renewable sources of energy:
hydro-electricity in Slovenia, Tehniˇcki Vjesnik, 19
(4), 2012.
[16] Takala J., Liu Y., Feng B., Yang W., Analytical
Evaluation of Sustainable Competitive Advantage,
Manufacturing Modelling, Management, and Con-trol, 7 (1), 1240–1243, 2013.
[17] Takala J., Shylina D., Forss T., Malmi J., Study on
resource allocations for sustainable competitive ad-vantage, Management and Production Engineering
Review, 4 (3), 65–75, 2013.
[18] Takala J., Shylina D., Tilabi S., How to Apply
Sus-tainable Competitive Advantage for Regional Devel-opments (Case: Ostrobothnia Region of Finland),
Management and Production Engineering Review, 5 (2), 66–77, 2014.
[19] Liu Y., Sustainable competitive advantage in
turbu-lent business environments, International Journal of
Production Research, 51 (10), 2821–2841, 2013. [20] Si S., Takala J., Liu Y., Competitiveness of
Chi-nese high-tech manufacturing companies in global context, Industrial Management & Data Systems,
109 (3), 404–424, 2009.
[21] Barney J., Firm resources and sustained competitive
advantage, Journal of Management, 17 (1), 99–120,
1991.
[22] Barney J.B., Resource-based theories of competitive
advantage: A ten-year retrospective on the resource-based view, Journal of Management, 27 (6), 643–650,
2001.
[23] Santoyo-Castelazo E., Azapagic A.,
Sustainabili-ty assessment of energy systems: Integrating envi-ronmental, economic and social aspects, Journal of
Cleaner Production, 80, 119–138, 2014.
[24] Ansoff H.I., Corporate strategy: an analytic
ap-proach to business policy for growth and expansion,
New York: McGraw-Hill Higher Education, 1965. [25] Porter M.E., The Competitive Advantage of
Na-tions, New York: The Free Press, 1990.
[26] Porter M.E., What Is Strategy?, Harvard Business Review, 74 (6), 61–78, 1996.
[27] Boyer K.K., Lewis M.W., Competitive Priorities:
Strategy, Production and Operations Management,
11 (1), 9–20, 2002.
[28] Leong G.K., Snyder D.L., Ward P.T., Research in
the process and content of manufacturing strategy,
Omega, 18 (2), 109–122, 1990.
[29] Ward P., Configurations of manufacturing strategy,
business strategy, environment and structure,
Jour-nal of Management, 22 (4), 597–626, 1996.
[30] Zhang X., Shen L., Wu Y., Green strategy for
gain-ing competitive advantage in housgain-ing development: a China study, Journal of Cleaner Production, 19
(2), 157–167, 2011.
[31] Grant R.M., Contemporary Strategy Analysis,
Malden: Blackwell Publishing, 2005.
[32] Takala J., Hirvel¨a J., Liu Y., Malindˇz´ak D.,
Glob-al manufacturing strategies require “dynamic engi-neers”?: Case study in Finnish Industries,
Industri-al Management & Data Systems, 107 (3), 326–344, 2007.
[33] Mintzberg H., Ahlstrand B., Lampel J., Strategy
safari: a guided tour through the wilds of strate-gic management, Free Press, New York, NY, 10020,
1998.
[34] Van Bommel H., A conceptual framework for
an-alyzing sustainability strategies in industrial supply networks from an innovation perspective, Journal of
Cleaner Production, 19 (8), 895–904, 2011. [35] Seuring S., M¨uller M., From a literature review to
a conceptual framework for sustainable supply chain management, Journal of cleaner production, 16 (15),
1699–1710, 2008.
[36] Kleindorfer P.R., Singhal K., Wassenhove L.N.,
Sus-tainable operations management, Production and
Operations Management, 14 (4), 482–492, 2005. [37] Liu Y., Takala J., Modelling and evaluation of
opera-tional competitiveness of manufacturing enterprises,
Quality Innovation Prosperity, 13 (2), 1–19, 2009. [38] Liu Y., Liang L., Evaluating and developing
resource-based operations strategy for competitive advantage: an exploratory study of Finnish high-tech manufacturing industries, International Journal of
Production Research, 53 (4), 1019–1037, 2015. [39] Haeckel S.H., From “make and sell” to “sense and
respond”, Management Review, 81 (10), 3–9, 1992.
[40] Bradley S.P., Nolan R.L., Sense and Respond:
Cap-turing Value in the Network Era, Harvard Business
School Press, 1998.
[41] Markides C., All the right moves: a guide to
craft-ing breakthrough strategy, Harvard Business Press,
2000.
[42] Liu Y., Takala J., Operations strategy optimization
based on developed sense and respond methodology,
Journal on Innovation and Sustainability, RISUS ISSN 2179–3565, 3 (1), 2012.
[43] Ranta J.M., Takala J., A holistic method for
find-ing out critical features of industry maintenance ser-vices, International Journal of Services and
Stan-dards, 3 (3), 312–325, 2007.
[44] Nadler D., Takala J., The development of the CFI
method to measure the performance of business processes based on real life expectations and experi-ences, International Conference on Innovation and
Management, ICIM2010, December, pp. 4–5, 2010. [45] Porter M.E., Competitive strategy: Techniques for
analyzing industries and competitors, New York,
Free Press, 1980.
[46] Porter M.E., Competitive advantage: creating and
sustaining superior performance, The Free Press,
NY, 1985.
[47] Peters T.J., Waterman R.H., In Search of
Excel-lence: Lessons from America’s Best-Run Compa-nies, New York: Harper & Row, 1982.
[48] Peters T.J., The Little Big Things: 163 Ways to
Pursue Excellence, New York: HarperCollins, 2010.
[49] Hayes R.H., Wheelwright S.C., Restoring Our
Com-petitive Edge: Competing Through Manufacturing,
New York: John Wiley & Sons, 1984.
[50] Hayes R.H., Wheelwright S.C., Clark K.B.,
Dynam-ic Manufacturing: Creating the Learning Organiza-tion, New York: Free Press, 1988.
[51] Avella L., Fernandez E., Vazquez C.J., Analysis of
manufacturing strategy as an explanatory factor of competitiveness in the large Spanish industrial firm,
International Journal of Production Economics, 72 (2), 139–157, 2001.
[52] Barney J., Wright M., Ketchen D.J., The
resource-based view of the firm: Ten years after 1991, Journal
of Management, 27 (6), 625–641, 2001.
[53] Liu Y., Implementing Sustainable Competitive
Ad-vantage for Proactive Operations in Global Turbu-lent Business Environments, University of Vaasa,
Department of Production, 2010.
[54] Day G.S., Wensley R., Assessing advantage: a
framework for diagnosing competitive superiority,
The Journal of Marketing, 52 (2), 1–20, 1988. [55] Grant R.M., Analyzing resources and capabilities, In
R.M. Grant [Ed.], Contemporary Strategy Analysis: Concepts, Techniques, Applications, Malden: Black-well, pp. 93–122, 1991.
[56] Hall R., A framework linking intangible resources
and capabilities to sustainable competitive advan-tage, Strategic Management Journal, 14 (8), 607–
618, 1993.
[57] Fiol C.M., Revisiting an identity-based view of
sus-tainable competitive advantage, Journal of
Manage-ment, 27 (6), 691–699, 2001.
[58] Fahy J., A resource-based analysis of sustainable
competitive advantage in a global environment,
In-ternational Business Review, 11 (1), 57–77, 2002. [59] Lubit R., The keys to sustainable competitive
advan-tage: Tacit knowledge and knowledge management,
Organizational Dynamics, 29 (3), 164–178, 2002. [60] Johannessen J.A., Olsen B., Knowledge
manage-ment and sustainable competitive advantages: The impact of dynamic contextual training,
Internation-al JournInternation-al of Information Management, 23 (4), 277– 289, 2003.
[61] Ren L., Xie G., Krabbendam K., Sustainable
com-petitive advantage and marketing innovation with-in firms: A pragmatic approach for Chwith-inese firms,
Management Research Review, 33 (1), 79–89, 2009. [62] Toor S.U.R., Ofori G., Positive psychological capital
as a source of sustainable competitive advantage for
organizations, Journal of Construction Engineering
and Management, 136 (3), 341–352, 2009.
[63] Hosnar J., Kovaˇc-Kralj A., Mathematical modelling
and MINLP programming of a hydro system for power generation, Journal of Cleaner Production,
65, 194–201, 2014.
[64] Kasanen E., Lukka K., The constructive approach in
management accounting research, Journal of
Man-agement Accounting Research, (5), 243–264, 1993. [65] Piirainen K.A., Gonzalez R.A., Constructive
Syn-ergy in Design Science Research: A Compara-tive Analysis of Design Science Research and the Constructive Research Approach, Liiketaloudellinen
Aikakauskirja, (3–4), 206–234, 2014.
[66] Vuoti V.P., Takala J., M¨antyl¨a A., Liu Y., Yang W., Malek N.A.B.A., Zafar A., Validating performance
based critical actions in a high tech start-up,
Pro-ceedings of 2013 International Conference on Tech-nology Innovation and Industrial Management (pp. 109–124), Phuket, Thailand: Technology Innovation and Industrial Management 2014.
[67] Maylor H., Turner N., Murray-Webster R., It
worked for manufacturing. . . !: Operations strategy in project-based operations, International Journal of