Data imputing using genetic algorithms (GA)
A case study of cost data for tunnel fans
Yamur K. Al-Douri
Division of Operation and Maintenance Engineering, Luleå University of Technology, Luleå, Sweden
Hussan Hamodi
Division of Operation and Maintenance Engineering, Luleå University of Technology, Luleå, Sweden
Abstract— Data imputing uses to posit missing data
values, as missing data have a negative effect on the computation validity of models. This study develops a genetic algorithm (GA) to optimize imputing for missing cost data of fans used in road tunnels by the Swedish Transport Administration (Trafikverket). GA uses to impute the missing cost data using an optimized valid data period. The results show highly correlated data (R-squared 0.99) after imputing the missing data. Therefore, GA provides a wide search space to optimize imputing and create complete data. The complete data can be used for forecasting and life cycle cost analysis. Keywords: data imputing, genetic algorithms (GA), R-Squared.
1. Introduction
Data imputing uses to posit the existence of missing values to decrease the computational process, estimate model variables and derive the results that would have been seen if the complete data were used. The common practice is to impute the missing data using the average of the observed values. With imputing, no values are sacrificed, thus precluding the loss of analytic results [1].
Genetic algorithm (GA) is a widely used evaluation technique to optimize and predict missing data by finding an approximate solution interval that minimizes the error prediction function [2]. Several studies of imputing data have used GAs to understand and improve data to avoid bias in decision-making.
Ibrahim Berkan Aydilek et al. [3] proposed a hybrid approach that utilizes fuzz c-means clustering with combination between support vector regression and a genetic algorithm. This approach used to optimize cluster size and weight factor and estimating missing values. The proposed lustering technique used to estimate the missing values based on the similarity and Root Mean Standard Errors (RMSE) used to estimate the imputing accuracy. The authors found that clustering makes missing value a member of more than one cluster centroids, which yields more sensible imputation results.
Mussa Abdella et al. [4] introduced a new method by combing genetic algorithm (GA) and neural networks to approximate the missing data in database. The authors use GA to minimize an error function derived from an auto-association neural network. They used a standard method (Se)
to estimate the imputing accuracy of the missing data that investigated using the proposed method. The authors found that the model approximates the missing values with higher accuracy.
Daiheng Ni et al. [5] developed multiple imputation scheme that provides multiple estimates for a missing value, simulating multiple draws from a population to estimate the unknown parameter. This scheme develops a multiple imputation procedure and as a framework. The procedure consists of estimate multiple values for each missing value in time, quantify the variability of the multiply imputed data, then combing the imputed data values by taking the average. The authors found that scheme has high imputation quality and merits many advantages such as yielding unbiased estimates for the missing values, preserving the natural variability of the observed data, and providing a measure of the uncertainty introduced by missing data
The aim of this study is to develop a GA to optimize imputing the missing cost data of tunnel fans. GA imputes the missing cost data to derive complete data for forecasting or life cost analysis. We argue that a multi-objective GA decreases the complexity, increases the flexibility, and is very effective when selecting an approximate solution interval for imputing.
2. Methods 2.1. Data collection
The cost data are for Swedish tunnel fans in Stockholm. The data were collected over ten years from the Swedish Transport Administration (Trafikverket) and stored in the MAXIMO computerized maintenance management system (CMMS). In CMMS, the cost data are recorded based on work orders of tunnel fans and contain labour cost. It is important to mention that labour cost data used in this study are real costs without inflation. Due to company regulations, labour cost data are encoded and expressed as currency units (cu) for this study.
2.2. Genetic algorithm (GA)
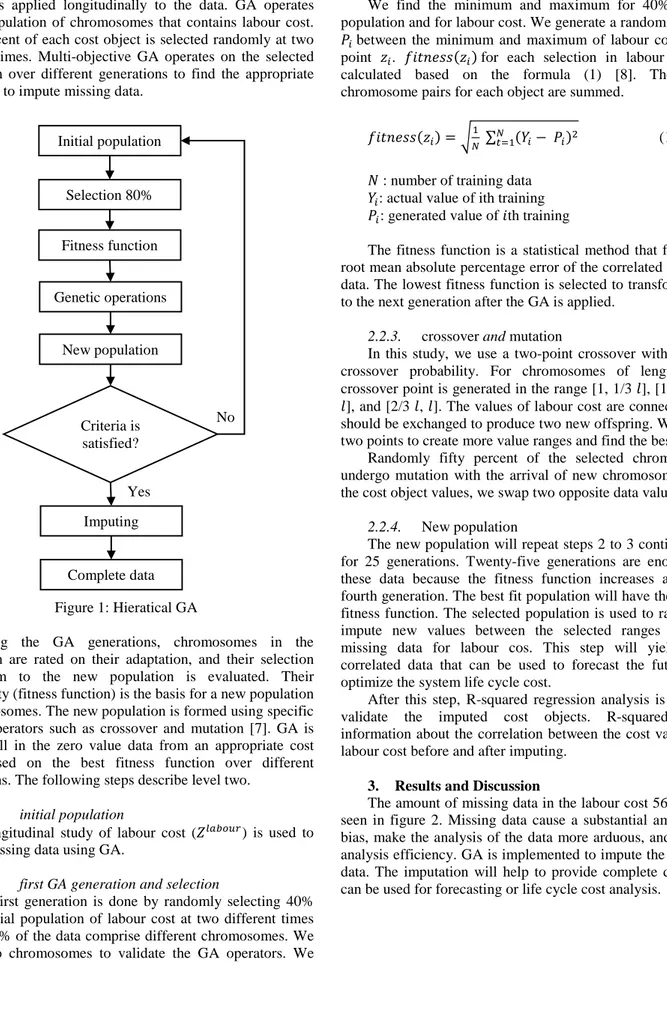
GA is widely applied in imputing because of its ability to optimize valid imputing period in a large space of random populations [6]. The GA operates with a population of chromosomes containing data of work orders. The
chromosomes are proportional to the case and problem statement [7] as seen in figure 1.
GA is applied longitudinally to the data. GA operates with a population of chromosomes that contains labour cost. Forty percent of each cost object is selected randomly at two different times. Multi-objective GA operates on the selected population over different generations to find the appropriate cost range to impute missing data.
Figure 1: Hieratical GA
During the GA generations, chromosomes in the population are rated on their adaptation, and their selection mechanism to the new population is evaluated. Their adaptability (fitness function) is the basis for a new population of chromosomes. The new population is formed using specific genetic operators such as crossover and mutation [7]. GA is used to fill in the zero value data from an appropriate cost range based on the best fitness function over different generations. The following steps describe level two.
2.2.1. initial population
A longitudinal study of labour cost (𝑍𝑍𝑙𝑙𝑙𝑙𝑙𝑙𝑙𝑙𝑙𝑙𝑙𝑙) is used to impute missing data using GA.
2.2.2. first GA generation and selection
The first generation is done by randomly selecting 40% of the initial population of labour cost at two different times so that 80% of the data comprise different chromosomes. We select two chromosomes to validate the GA operators. We
select 80% because a high range of missing data requires us to find an appropriate range of values to impute missing data.
We find the minimum and maximum for 40% of the population and for labour cost. We generate a random number 𝑃𝑃𝑖𝑖 between the minimum and maximum of labour cost. Data
point 𝑧𝑧𝑖𝑖. 𝑓𝑓𝑓𝑓𝑡𝑡𝑛𝑛𝑛𝑛𝑛𝑛𝑛𝑛(𝑧𝑧𝑖𝑖) for each selection in labour cost is calculated based on the formula (1) [8]. Then, the chromosome pairs for each object are summed.
𝑓𝑓𝑓𝑓𝑡𝑡𝑛𝑛𝑛𝑛𝑛𝑛𝑛𝑛(𝑧𝑧𝑖𝑖) = �𝑁𝑁1 ∑ (𝑌𝑌𝑁𝑁𝑡𝑡=1 𝑖𝑖− 𝑃𝑃𝑖𝑖)2 (1)
𝑁𝑁 : number of training data 𝑌𝑌𝑖𝑖: actual value of ith training
𝑃𝑃𝑖𝑖: generated value of 𝑓𝑓th training
The fitness function is a statistical method that finds the root mean absolute percentage error of the correlated imputed data. The lowest fitness function is selected to transform data to the next generation after the GA is applied.
2.2.3. crossover and mutation
In this study, we use a two-point crossover with a fixed crossover probability. For chromosomes of length 𝑙𝑙, a crossover point is generated in the range [1, 1/3 𝑙𝑙], [1/3 𝑙𝑙, 2/3 𝑙𝑙], and [2/3 𝑙𝑙, 𝑙𝑙]. The values of labour cost are connected and should be exchanged to produce two new offspring. We select two points to create more value ranges and find the best fit.
Randomly fifty percent of the selected chromosomes undergo mutation with the arrival of new chromosomes. For the cost object values, we swap two opposite data values.
2.2.4. New population
The new population will repeat steps 2 to 3 continuously for 25 generations. Twenty-five generations are enough for these data because the fitness function increases after the fourth generation. The best fit population will have the lowest fitness function. The selected population is used to randomly impute new values between the selected ranges for the missing data for labour cos. This step will yield fully correlated data that can be used to forecast the future and optimize the system life cycle cost.
After this step, R-squared regression analysis is used to validate the imputed cost objects. R-squared gives information about the correlation between the cost values for labour cost before and after imputing.
3. Results and Discussion
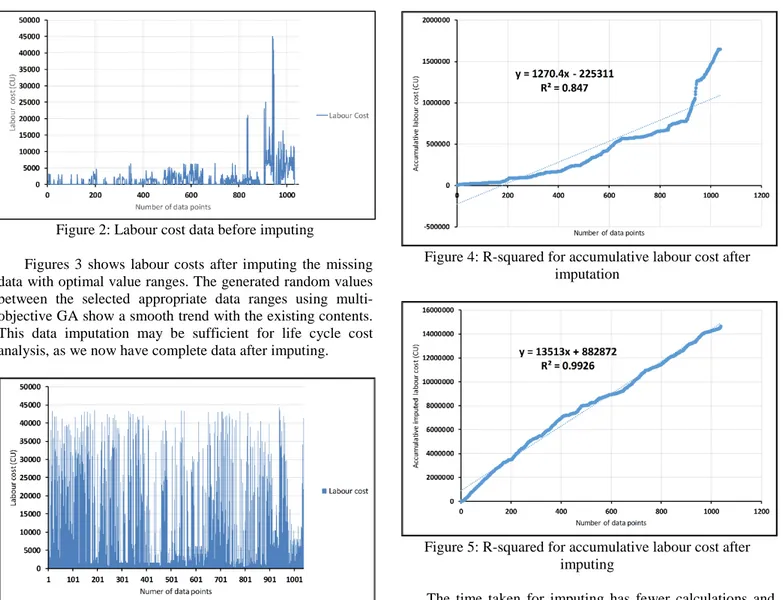
The amount of missing data in the labour cost 56.84% as seen in figure 2. Missing data cause a substantial amount of bias, make the analysis of the data more arduous, and reduce analysis efficiency. GA is implemented to impute the missing data. The imputation will help to provide complete data that can be used for forecasting or life cycle cost analysis.
Initial population Complete data Selection 80% Genetic operations New population Criteria is satisfied? Imputing Fitness function No Yes
Figure 2: Labour cost data before imputing
Figures 3 shows labour costs after imputing the missing data with optimal value ranges. The generated random values between the selected appropriate data ranges using multi-objective GA show a smooth trend with the existing contents. This data imputation may be sufficient for life cycle cost analysis, as we now have complete data after imputing.
Figure 3: Labour cost data after imputing
R-squared regression analysis is used to validate the imputation process using multi-objective GA and to determine the differences before and after imputation for each cost object. Figure 4 shows R-squared is 0.847 for the redacted accumulated labour cost data, and Figure 5 shows a better R-squared value, 0.9926, after imputing the missing labour cost data. This means imputing increases the correlation of the labour cost values.
Figure 4: R-squared for accumulative labour cost after imputation
Figure 5: R-squared for accumulative labour cost after imputing
The time taken for imputing has fewer calculations and requires almost the same amount of time for each population 16 to 17 seconds, as the population size is always 80% of the cost data for each cost object.
4. Conclusions
This study develops GA that shows an optimal range of values to impute missing data. It can provide appropriate data ranges that accommodate data variations, and it shows minimum imputing errors. The correlation between cost data values after the missing data are imputed is high and relevant. The resulting complete data can be used for forecasting and life cycle cost analysis.
5. Future works
The future research possibilities are broad. Prospects can be drawn towards investigating a multi-objective GA to different domains such as clustering, imputing, forecasting and time-series analysis. Multi-objective GA uses in these domains based on different objectives and provides a efficient analysis over the tunnel fan turbine life cycle. Extracting the optimal knowledge aims to provide comprehensible data analysis model.
References
[1] Schafer JL, Graham JW (2002) Missing data: our view of the state of the art. Psychol Methods 7(2):147 [2] Lobato F, Sales C, Araujo I et al (2015)
Multi-objective genetic algorithm for missing data imputation. Pattern Recog Lett 68:126-131
[3] Aydilek IB, Arslan A (2013) A hybrid method for imputation of missing values using optimized fuzzy c-means with support vector regression and a genetic algorithm. Inf Sci 233:25-35
[4] Abdella M, Marwala T (2005) The use of genetic algorithms and neural networks to approximate missing data in database. In: Anonymous Computational Cybernetics, 2005. ICCC 2005. IEEE 3rd International Conference on. IEEE, p 207
[5] Ni D, Leonard JD, Guin A et al (2005) Multiple imputation scheme for overcoming the missing values and variability issues in ITS data. J Transp Eng 131(12):931-938
[6] Deb K, Pratap A, Agarwal S et al (2002) A fast and elitist multiobjective genetic algorithm: NSGA-II. IEEE transactions on evolutionary computation 6(2):182-197 [7] Cordón O, Herrera F, Gomide F et al (2001) Ten
years of genetic fuzzy systems: current framework and new trends. In: Anonymous IFSA World Congress and 20th NAFIPS International Conference, 2001. Joint 9th, 3 vol. IEEE, p 1241
[8] Hadavandi E, Shavandi H, Ghanbari A (2011) An improved sales forecasting approach by the integration of genetic fuzzy systems and data clustering: Case study of printed circuit board. Expert Syst Appl 38(8):9392-9399