DOCTORA L T H E S I S
Department of Engineering Sciences and Mathematics Division of Wood Science and Engineering
Sawing Strategies for
Tropical Hardwood Species
Pedro Ah Shenga
ISSN 1402-1544 ISBN 978-91-7583-717-8 (print)
ISBN 978-91-7583-718-5 (pdf) Luleå University of Technology 2016
Pe
dr
o A
h S
hen
ga
Sa
wing Strateg
ies for
T
ropical Har
dw
ood Species
Doctoral Thesis
Sawing Strategies for Tropical
Hardwood Species
Simulation Studies Based on Industrial
Conditions in Mozambique
Pedro Ant´
onio Ah Shenga
Wood Science and Engineering
Department of Engineering Sciences and Mathematics
Lule˚
a University of Technology,
Skellefte˚
a, Sweden
Supervisors:
Printed by Luleå University of Technology, Graphic Production 2016 ISSN 1402-1544 ISBN 978-91-7583-717-8 (print) ISBN 978-91-7583-718-5 (pdf) Luleå 2016 www.ltu.se
Lule˚
a University of Technology,
Skellefte˚
a, Sweden
This thesis has been prepared using L
ATEX
Copyright c
Pedro Ant´onio Ah Shenga, 2016.
All rights reserved
Wood Science and Engineering
Department of Engineering Sciences and Mathematics
Lule˚
a University of Technology,
Skellefte˚
a, Sweden
SE-931 87 Skellefte˚
a, Sweden
Phone: +46(0)910 58 5300, +258 82 5573670
In memory of my father
Abstract
The harvesting of tropical hardwood species in Mozambique is much greater
than the natural regrowth in the forest and the stock is decreasing
drasti-cally. It is therefore important to improve the material recovery when the
wood is refined (i.e. in sawing and further refinement to products such as
joinery, furniture etc.) to reduce the waste and to re-utilize efficiently the
by-products and increase their added value. The wood-processing
indus-try is an important means to boost the industries in the rural areas and
also to generate income for the local communities by creating jobs and
business opportunities.
The majority of the logs that could be used for sawmilling in
Mozam-bique are exported as roundwood due to the inability of wood-processing
companies to meet the product standards set for export and to generate
profit. The inability of the local sawmills to generate profit also fosters
il-legal logging because of the higher price of roundwood for export, and this
contributes to an increase in the number of unlicensed individuals in
har-vesting. This threatens law enforcement and thus the degradation of the
local wood industry. An alternative, to increase the profit and empower
the local community, could be to export more refined wood products such
as sawn timber, parquet, and veneer instead of roundwood.
The objective of this work was to investigate alternative strategies for
sawing tropical hardwood species that could increase the profitability of
the Mozambique wood industry in general and of the sawmills in
particu-lar. The subject was approached using a database of virtual logs together
with a sawing simulator. The thesis considers two main areas: (1) creating
the log database with the corresponding algorithms for sawing simulation,
and (2) investigations of alternative sawing strategies.
The first task was to build the database of surface-scanned logs and
develop the algorithm for the saw simulation. The results are a database
of 15 log models describing the log’s outer shape containing 10 Jambirre
force”, i.e. it determines the volume yields of sawn timber from
combi-nations of all the settings of the log-positioning parameters (offset, skew
and rotation) and selects the maximum volume yield. The simulation,
us-ing three sawus-ing patterns (cant-sawus-ing, through-and-through sawus-ing and
square-sawing) combined with two positioning parameters (offset and
ro-tation), showed that the choice of sawing pattern has a great impact on
the volume yield and that square-sawing gave the higher yield than
cant-sawing and through-and-through cant-sawing.
The second focus was on alternative sawing strategies; bearing in mind
that the highest volume yield is achieved with computerized production
systems and that these resources are not yet available in Mozambique.
Hence, the objective was to find the positioning methods and parameters
that improve the volume yield and that can be set manually. The result
have shown that the rotation has the greatest effect followed by offset
and skew, and that the volume yield can decrease by between 7.7% and
12.5% from that obtained with the optimal positioning when the logs are
manually positioned with a knowledge of the optimal log position. In a
horns-down and log bucking study, it was shown that horns-down results in
systematic lower yield than optimal positioning. Nevertheless, the results
emphasize that horns-down methodology could be of interest in practice
if no scanning of logs is available. Bucking of logs to half-length at the
sawmill prior sawing showed to be one good way to increase the volume
yield, especially for the more crooked logs tested.
It is concluded that there is an unexploited value potential in the wood
chain which can be reached using alternative positioning and modern
mea-surement techniques and that the grading of wood will facilitate and
im-prove the sawing process.
Keywords: sawing strategies, tropical hardwood species, simulation,
volume yield, log grading, Umbila, Jambirre.
Preface
The work within this thesis has been performed at Division of Wood
Sci-ence and Engineering at Lule˚
a University of Technology in Skellefte˚
a. The
project was funded by the Swedish International Development Agency
(SIDA) through the Technology Processing of Natural Resources for
Sus-tainable Development programme. The financial support is acknowledged
and deeply appreciated.
I would also like to acknowledge and extend my gratitude to the
Eduardo Mondlane University and the International Science Programme
(ISP).
My deepest thanks to my supervisors Dick Sandberg, Olof Broman and
Anders Gr¨onlund for your support, guidance, advice and encouragement.
I also extend my thanks to Rui Sitoe for all support and to invite me to
be part of this project.
Many thanks to all staff of Lule˚
a University of Technology in Skellefte˚
a,
for the help and friendship I have received. Special thanks to Peter Bomark
who travelled to Mozambique and helped me with the scanning and with
the simulation code, and to Magnus Fredriksson who provided the last
part of the simulation code.
Most especially to my parents, to my brothers and sisters; thanks for
your moral and economic support.
Last but not least, to you Rosa and to our son Nathan.
”I’m coming home
I’m coming home
Tell the world I’m coming home
Let the rain wash away all the pain of yesterday...”
Thank you for your support and forgive me for not being present in
vii
Skellefte˚
a, December 2, 2016
Pedro Shenga
List of publications
This thesis is based on the following publications:
Paper I
Ah Shenga, P., Crist´ov˜ao, L., & Broman, O. (2013). A Review of
Mozam-bican Wood Exploitation: Map of the Processing Chain. In: Proceedings
of the 21
stInternational Wood Machining Seminar, Nobuaki Hattori (Ed.),
August 4
th- 7
th, Tsukuba International Congress Center, Japan. (pp.
293-301)
Paper II
Ah Shenga, P., Bomark, P., Broman, O., & Hagman, O. (2014). 3D
Phase-Shift Laser Scanning of Log Shape. BioResources, 9 (4), 7593-7605.
Paper III
Ah Shenga, P., Bomark, P., Broman, O., & Sandberg, D. (2015).
Simula-tion of Tropical Hardwood Processing: Sawing Methods, Log PosiSimula-tioning,
and Outer Shape. BioResources, 10 (4), 7640-7652.
Paper IV
Ah Shenga, P., Bomark, P., Broman, O., & Sandberg, D. (2016). The
Effect of Log Position Accuracy on the Volume Yield in Sawmilling of
Tropical Hardwood. BioResources, 11 (4), 9560-9571.
Paper V
Ah Shenga, P., Bomark, P., Broman, O., & Sandberg, D. (2016). Log
Sawing Positioning Optimization and Log Bucking of Tropical Hardwood
Species to Increase the Volume Yield. (Accepted for publication in Wood
Material and Science Engineering)
writing. Guidance and feedback was provided by the co-authors.
In Paper II, Ah Shenga had the main responsibility in data analysis and
writing. The data collection was performed together with Bomark.
Guid-ance and feedback was provided by the co-authors.
In Paper III, Ah Shenga had the main responsibility to perform the
sim-ulations, analyze the data and writing. Bomark helped in data collection
and to develop the algorithm for the sawing simulation. Guidance and
feedback was provided by the co-authors.
In Paper IV, Ah Shenga had the main responsibility to perform the
sim-ulations, analyze the data and writing. Bomark helped to develop the
algorithm for sawing simulation. Guidance and feedback was provided by
the co-authors.
In Paper V, Ah Shenga had the main responsibility to perform the
sim-ulations, analyze the data and writing. Bomark helped to develop the
algorithm for sawing simulation and writing. Guidance and feedback was
provided by the co-authors.
Other related publications not included in the thesis
Fredriksson, M., Broman, O., Persson, F., Axelsson, A., & Ah Shenga, P.
(2014). Rotational Position of Curved Saw Logs and Warp of the Sawn
Timber. Wood Material Science and Engineering, 9 (1), 31-39.
doi: 10.1080/17480272.2013.853691
Ah Shenga, P., Bomark, P., & Broman, O. (2015). Simulated
Break-down of Two Tropical Hardwood Species. Pro Ligno, 11 (4), 450-456.
Ah Shenga, P., Bomark, P., & Broman, O. (2015). External Log Scanning
for Optimizing Primary Breakdown of Tropical Hardwood Species. In:
Poster proceedings of the 22
ndInternational Wood Machining Seminar,
Roger Hern´andez and Claudia C´aceres (Eds.), June 14
th- 17
th, Quebec
City, Canada., (pp. 65-72).
Contents
Part I
1
Chapter 1 – Introduction
3
1.1
Aim and objective . . . .
6
1.2
Research questions . . . .
6
1.3
Limitations . . . .
7
1.4
Presentation of appended papers . . . .
7
Chapter 2 – Background
11
2.1
The forest industry in Mozambique . . . .
11
Chapter 3 – Methodology Approach
19
3.1
Log selection . . . .
20
3.2
Log scanning and the database . . . .
21
3.3
Saw optimization . . . .
23
3.4
Simulations . . . .
24
Chapter 4 – Materials and methods
27
4.1
Log selection . . . .
27
4.2
Log scanning method . . . .
28
4.3
Database . . . .
29
4.4
Sawing simulations . . . .
30
Chapter 5 – Results and Discussion
37
5.1
Log shape measurement (Paper II) . . . .
37
5.2
Database, saw simulation algorithm and preliminary results
(Paper III) . . . .
39
5.3
Effect of deviations in log positioning on volume yield
(Pa-per IV) . . . .
40
5.4
Positioning optimization and log bucking (Paper V) . . . .
43
Chapter 6 – Conclusions
47
Part II
55
Part III
63
Paper I
65
Paper II
77
Paper III
93
Paper IV
109
Paper V
123
xiv
Part I
Chapter 1
Introduction
The forest is one of the major source of livelihood for the majority of
Mozambicans, but its management is in general not sustainable, and this
endangers its existence due to the uncontrolled and illegal harvesting of
timber and also because it is used for the domestic production of charcoal
and firewood. Around 62% of the population of Mozambique live in rural
areas (Anon., 2016) and most of them use charcoal and firewood as the
main energy source for cooking. The uncontrolled logging endangers not
only the ecosystem and the fauna but also the wood industry based on
forest resources.
Mozambique has about 118 species (Fath, 2002) and of these only 52
species have well documented physical and mechanical properties
(Bun-ster, 2006). Today, around 10 species are commercially exploited (Fath,
2002). The most commercially exploited species vary according to the
de-mand of the international market, but three species, Umbila (Pterocarpus
angolensis DC.), Jambirre or Panga-panga (Millettia stuhlmannii Taub.)
and Chanfuta (Afzelia quanzensis Welw.), are always in the group of the
most exploited species and this increases the risk that their regrowth is
hampered. The species most sought after for export are also those that
are most used on the domestic market. The demand for tropical hardwood
species is greater than the natural regrowth in the Mozambique forests,
and the stock is decreasing drastically. It is therefore important to find
alternative species for industrial use, to decrease the pressure on the most
harvested and naturally grown species, and it is also important to improve
the material recovery when the wood is refined (i.e. in sawing and further
refinement to products such as joinery, furniture etc.).
The use of alternative species or lesser-known species can play an
im-portant role in reducing the high rate of deforestation. The common
wis-dom transmitted since early days is that the locally most used species
provide better mechanical properties, and this may hamper the
introduc-tion of new species to replace those being most used. Studies made to
in-vestigate and to document the lesser-known species in Mozambique have
reported that many of these species have properties similar to those of
the most commonly exploited species and can be used as a replacement
(Bunster, 2006; Ali et al., 2008; Uetimane et al., 2008; Lhate et al., 2010;
Cristovao et al., 2011). Efforts should however be made to publish these
findings to the community, to the sawmill industry, and to the wood
ex-ploiters.
To reduce the deforestation and the illegal logging, the government
passed new legislation in 2015 for the use of the Mozambique forest. Some
of the measures were to prohibit the harvesting of ironwood (Swartzia
madagascariensis Desv.) over a five-year period to prevent its
endanger-ment and to stop issuing new forest licenses for logging for a period of two
years starting from 2016. Other measures such as increasing the amount
of checkpoints and resources to control the harvesting process have also
been adopted.
The wood sector contribution is around 4.8% of the Gross Domestic
Product (GDP), where 3.3% is roundwood, 1.1% is sawn timber and the
remainder as other products such as charcoal and firewood (OEC, 2014).
Most of the logs that could be used for sawmilling in Mozambique are
exported, mainly to China. China is currently the only viable market for
Mozambique wood (roundwood as well as sawn timber) due to the inability
of companies in Mozambique to meet the product standards set for export
to e.g. the Western markets (Ekman et al., 2013). The log prices in
China are also relative high compared to the Mozambique market, which
complicates the domestic refinement. The inabilities of the local sawmills
to generate profit also tends to promote illegal logging because of the
higher price of roundwood for export, and this contributes to an increase
in the number of unlicensed individuals in harvesting. This threatens law
enforcement and thus a degradation of the local wood industry. The wood
processing industry is an important factor which can boost the industries
in the rural areas and also generate income for the local communities by
5
creating jobs and business opportunities. An alternative way to increase
the profits and empower the local community could be to export more
refined wood products such as sawn timber, parquet, and veneer to the
EU markets instead of roundwood to China.
The wood industry is mostly located close to the main cities (e.g.
Pemba, Nampula, Quelimane, Beira and Maputo) and this increases the
transportation costs because the forests are far from the the cities.
An-other factor that increases the costs is the handling of heavy and large
diameter logs instead of sawn timber. The wood processing industry uses
simple machinery that generates large volumes of waste material. The
volume losses are also caused by a lack of knowledge of wood properties,
sawing strategies and the commercial value of different species. Maybe the
most important factor for losses in Mozambique sawmills are the shape of
the sawlogs, often having multiple crook which complicates how each log
should be sawn to get high yield (see logs studied in Appendix II). This
contributes to the under-utilization and also to the indiscriminate
harvest-ing of the forest resource in Mozambique.
The sawmill industry is an early and very important link in the
Mozam-bique forest products value chain. To reverse the current trend of
unde-veloped processing and the high-volume export of unrefined logs, sawmills
must increase their profits by producing products that fulfil the
require-ments of the international market, and through a sustainable forest
man-agement to acquire e.g. the Forest Stewardship Council (FSC) certification
in order to access the EU market and to be able to deal directly with these
markets. To reach that goal the Mozambique sawmill industry must invest
in equipment and education to improve the sawing process, and also to
utilize efficiently the by-products from the sawing process. As a part of
this overall goal for the Mozambique sawmill industry, the work described
in this thesis has been focused on a specific area of the sawmill process,
namely the optimization of the sawing process to increase the volume yield
of sawn timber.
1.1
Aim and objective
The aim of the work has been to increase knowledge of sawing tropical
hardwood species, and to improve the preconditions for the Mozambique
sawmill industry to develop and increase its competitiveness.
The objective was to develop methods to increase the volume yield of
sawn timber, based on industrial conditions of Mozambique.
1.2
Research questions
The thesis presents some issues relating to the way in which the
combina-tion of log posicombina-tioning and sawing patterns can increase the volume yield
of sawn timber in Mozambique sawmills. The guiding question was:
Is it possible to increase the volume yield of tropical hardwood species
by combining the sawing pattern and log positioning parameters and, if
possible, how should it be done?
The objective was to identify, present and analyse a number of
param-eters that affect the volume yield, and following questions were posed:
• What are the common practices used in Mozambique sawmills, which
species are frequently used, and how is the wood sector in Mozambique
organized?
• What methods can be used in practice to measure the log shape in
Mozambique sawmills in order to create log models that could be used
to investigate different sawing strategies?
• With respect to the conditions in Mozambique sawmill industry, how
should sawing patterns and log-positioning parameters be evaluated?
• Which positioning parameter have the strongest effects on the volume
yield of sawn timber and how the choice of sawing pattern influence
the yield?
• How does bucking influence the crook of the logs and does bucking
increase the volume yield of sawn timber?
1.3.
Limitations
7
1.3
Limitations
The studies presented here were based on simulations using a limited set
of virtual logs (scanned real logs), comprising only their external features.
No industrial measurements were performed for validation. The only
prop-erties of the virtual logs and of the sawn timber from simulation studies
were their geometry. Only two species were used. Other species may differ
in shape, which may lead to different conclusions.
1.4
Presentation of appended papers
This section gives a short summary of the appended papers. The links
between the papers are shown in Figure 1.1.
Paper I Paper II Paper III Paper IV Paper V Saw simulation
Data collection, database
Saw pattern (CS, TT, SS) Log positioning
(Skew, Offset, Rotation)
1
Figure 1.1: The relationship between the work presented in the different papers. For Paper III three sawing patterns (CS, TT and SS) and two log positionings (skew, rotation) were used, while for Papers IV and V two sawing patterns (CS and TT) and three log positionings (skew, offset and rotation) were studied. CS – cant-sawing, TT – through-and-through sawing and SS – square-sawing
Paper I provided the main input for the further studies, and the results
were a good help in choosing the sawmill in which to perform the data
collection for further studies. In Paper II, a method for data collection
was chosen taking into account the findings from Paper I. In Paper III,
the data collection was performed and a database was built, the algorithm
for simulation of the sawing was developed and a preliminary simulation
was performed. In Paper IV, the effect of deviations on volume yield of
sawn timber was investigated, and in Paper V, the effect of bucking the
logs into two and positioning the log according to the main crook were
evaluated.
Paper I: Is a survey to identify the production chain of sawmills in
Mozambique and the species that are commonly used. This information
was used to identify two species that could represent the majority of logs
used for industrial production in Mozambique. The two species were
cho-sen taking into account the most common log features, crookedness and
straightness, i.e. one species had to be one of the most straight and the
other one of the most crooked. During the survey information was also
collected regarding the amounts and species in the country as well as their
variability, sawing patterns and log positioning practices, grading system
and log pricing. The survey was carried out by interviews and site visits
in three provinces chosen because of their importance as forest resources.
Paper II: The objective of this study was to choose the method for data
collection. From findings in the first study, a 3D-laser scanner was
se-lected. This camera uses the phase-shift principle for measurement. Two
logs, Birch (Betula pendula Roth.) and Scots pine (Pinus sylvestris L.),
were used to validate the method. In addition, computer tomography
(CT) scanning was used to measure the same logs to validate the 3D-laser
scanner measurements. The accuracy of this method was determined by
comparing the cross-section areas from 3D-scan data with the
correspond-ing cross section from the CT data. The result of this study shows that the
method developed was appropriate for further studies within this project,
and that was also a method on a technological level that can be used
on-site at sawmills in Mozambique.
Paper III: A database of 15 logs, Jambirre (Millettia stuhlmannii Taub.)
and Umbila (Pterocarpus angolensis DC.), was built up using the
3D-laser scanner, and a saw simulation algorithm was developed in Matlab
software. In addition, the variation in volume yield of sawn timber from
the logs was investigated using the simulation algorithm. Three sawing
patterns (cant-sawing, through-and-through saw and square-sawing) and
two positioning parameters (skew and rotation) were used in the study.
The simulation showed a good potential for increasing the volume yield of
sawn timber, but the study also led to new ideas about how to further
in-1.4.
Presentation of appended papers
9
crease the volume yield by a refined positioning. This was studied further
in Papers IV and V.
Paper IV: Alternative solutions for log positioning that combine data
from the saw-simulation algorithm and from common practices at
Mozam-bique sawmills were investigated. The objective was to evaluate the effects
of the error positioning and of the crook on volume yield. The idea was to
evaluate, using the mark that shows the optimal position given by the saw
simulation, how much a sawyer deviates from the optimal position when
positioning the log manually. The effect of crook on volume yield was
also evaluated by grading the logs on the basis of crook. The results show
that rotation is the parameter that most affects the volume yield followed
by offset and rotation. The volume yield can decrease by between 7.7%
and 12.5% compared with optimal positioning parameters when the log is
manually positioned.
Paper V: The objective of this study was to investigate alternative ways
of positioning the logs prior sawing. The optimal position method was
compared with a traditional horns-down method often used in practice.
The importance of log length for sawing yield was also investigated by
simply bucking the tested logs into half-length and thereby reduce the
crookedness of each log. In comparison with optimal position, sawing
according to horns-down, the volume yield decreased by between 5 and
10-percentage points. This stresses the need of having full information of
the outer shape of logs (measured with some scanning technique) prior
sawing.
Chapter 2
Background
2.1
The forest industry in Mozambique
2.1.1
Forest and forestry
Mozambique has approximately 26.9 million hectares of productive
for-est for industrial logging, corresponding to 67% of the total forfor-est area
(Marzoli, 2008). The commercial species with a high volume are Mopane
(Colophospermum mopane), Umbila (Pterocarpus angolensis DC.),
Jam-birre or Panga-panga (Millettia stuhlmannii Taub.) and Chanfuta (Afzelia
quanzensis Welw.).
The wood exploitation is performed under government rules, and the
exploiters are divided in two groups: the simple license exploiters and the
concessions. A simple license is issued only for Mozambicans as individuals
or as groups and 500 cubic meters of roundwood are allowed to be
har-vested annually (today the simple license exploiters are obliged to provide
an annual management plan), while a concessions is issued for any
Mozam-bican or foreign individual or companies, and can be exploited for up to 50
years (renewable). A major requirement is that the concession must own
a sawmill, and the volume of roundwood to harvest is defined through the
management plan that has to be approved yearly by the provincial forest
entities.
The forestry law also defines specifications for log harvesting and for
11
logging; for example, the minimum diameter (at breast height) for
harvest-ing varies from 20 cm to 50 cm dependharvest-ing on the log species. In addition,
to control the harvesting, the logs are graded as: ”Precious”, first, second,
third, and fourth grade. The Precious grade represents 4% of the total
annual logging volume, the first grade 21%, the second grade 44%, the
third grade 14% and the fourth grade 17% (Marzoli, 2008). The Precious
grade is, of course, the most expensive, and can be exported as roundwood
as second, third and fourth grades. The first grade is the most sought
af-ter species and their export is allowed only afaf-ter processing. The other
grades (second, third and fourth grades) are used domestically, mostly in
the countryside, for the construction of small houses, bridges, canoes, etc.
Some concessions have started using some of these species in their sawmill
production.
Another example of legal specification is the roundwood processing.
The degree of processing is specified by law (Anon., 2007), but sawmills
perform only the primary breakdown, which results in un-edged cants or
planks with a relative low added value.
2.1.2
The forest products industry
After independence from the colonial regime in 1975, the sawmill industry
began to decline due to the lack of skilled labour and the limited
mar-ket, because sawmills owners and their employees fled the country, and
the connection with the international market deteriorated. The situation
worsened with the civil war that lasted 16 years (1976-1992). It
com-pletely destroyed the sawmill industry because the raw material was not
being transported to the sawmills and because the power supply, main
roads and railways were disrupted. After the peace agreements in 1992,
the sawmill industry started to be revitalized and new forest legislation
has been passed and implemented according to the market needs.
With the increase in demand for tropical species on the Chinese
mar-ket, the export of roundwood also increased, and as a result in 2007, the
government introduced rules for wood processing to increase the added
value and also to control the deforestation and regulate the logging by
grading the roundwood into species, based on the demand. The Chinese
market demands roundwood and offers competitive prices for roundwood
compared to the sawn timber. As consequence, the sawmill industry has
2.1.
The forest industry in Mozambique
13
been marginalized due to the prices offered for the roundwood and their
inability to generate profit on the domestic market and to fulfil the
re-quirements of the European market regarding forest management, quality
of sawn timber and so on. In 2015, the government reinforced the export
rules to decrease the deforestation and also to increase added value.
Most of sawmills has reconditioned equipment used before
indepen-dence, and the majority of sawmill operators are self-taught from the
ex-perience of older operators. Education in wood processing is only provided
in professional training centres (mostly for carpenters). There are forestry
courses at the higher education level, but they are mostly dedicated to
forest management.
In 2008, under the SIDA-TechPro program, the Eduardo Mondlane
University (UEM) together with the Department of Forest Products at
the Swedish University of Agricultural Sciences (SLU) in Uppsala and the
Division of Wood Science and Engineering at Lule˚
a University of
Tech-nology (LTU) in Skelleft˚
a, started training Mozambicans in the field of
wood technology. As a result, four PhD-programs were concluded in four
different areas related to wood:
• Ernesto Uetimane Junior (2010). Anatomy, drying behaviour and
mechanical properties of lesser used wood species from Mozambique.
(http://pub.epsilon.slu.se/2356/)
• Alexandre Charifo Ali (2011). Physical-mechanical properties and
natural durability of lesser used wood species from Mozambique.
(http://pub.epsilon.slu.se/8079/)
• In´acio Arnaldo Lhate (2011). Chemical composition and
machinability of selected species from Mozambique.
(http://pub.epsilon.slu.se/8207/)
• Lu´ıs Crist´ov˜ao (2013). Machining properties of wood: Tool wear,
cutting force and tensioning of blades.
(http://pure.ltu.se/portal/en/publications/machining-properties-of-wood(c98ad54d-9908-4da2-b762-0c0aaad0c240).html)
In 2013, a Master’s degree course in wood technology was started at
UEM in collaboration with the two universities.
2.1.3
Production chain
Wood trading in Mozambique has special characteristics: the sale is made
as roundwood and the buyers choose where to process for further
refine-ments. A schematic representation of the trade and the production chain
is shown in Figure 2.1.
Main log yard or sawmill yard Concessions - 20000 - 50000 ha - 25 - 50 years - Sawmill Simple license - 500 m3/year - 1 year Local industries - Sawmill - Carpentries Concession sawmill Other provinces - Sawmill - Carpentries Export
- 1stgrade (only after
processing) - Precious grade
Domestic market - all species grades Harvesting Log market Processing/production Market
1
Figure 2.1: Schematic representation of value chain from forest to sawn timber market in Mozambique
There are three main actors in forestry: (1) Mozambicans: simple
li-cense exploiters or concession holders whose production is sold internally
as roundwood; the forest management is poor (e.g. harvesting above the
allowable annual cut issued in the licenses, no re-afforestation, etc.); the
concession holders have sawmills but do not process the roundwood for
export. (2) Chinese: Traders or concessions holders; the concessions are
mostly shared with Mozambicans. This group is the main exporter of
roundwood and sawn timber. They buy most of the production from the
first group and process all the purchased logs and also the logs from their
concessions. They also support the simple license exploiters (in exchange
they buy most of the harvested logs, at low price) with chain saws, pay
the exploitation licenses, transportation, food and so on; the forest
man-agement is also poor; (3) Others: These are Europeans, South Africans,
Zimbabweans, etc. to some extent shared with Mozambicans (concessions
2.1.
The forest industry in Mozambique
15
holders). They produce end-user products for the domestic market and
ex-port sawn timber to the European market; most of these exploiters comply
with the forest management plans.
Around 80% of the harvested timber in Mozambique is exported to
China (Ekman et al., 2013). However, the exported wood data are
con-tradictory. For example, OEC (2014) reports that about 69% of the
tim-ber exported in 2014 was roundwood, while the annual activities reports
(Anon., 2014) reported that the amount of sawn timber exported in 2013
and 2014 was higher than the volume of roundwood. On the other hand,
Ekman et al. (2013) reported that the amount of sawn timber exported
and registered in Mozambique statistics was lower than the amount of
sawn timber imported to China from Mozambique and registered by the
Chinese authorities.
Nevertheless, the added value is low since the processing only produces
a square or rectangular shape from the roundwood, without observing any
standard of quality or dimensions.
2.1.4
Sawmill Industry
Tete Manica Niassa Gaza Zambézia Inhambane Cabo Delgado Sofala Nampula Maputo -20 000 -10 000 0 10 000 20 000 30 000 40 000 50 000 60 000 70 000 80 000 0 2 4 6 8 10 12 14 16 18 20 Loggi n g c a pa city (m 3)Number of sawmills per province
< 5000 >= 5000 < 10000 >= 10000 < 15000 >= 15000 < 20000 >= 20000 Sawmill capacity (m3)
Figure 2.2: Sawmill annual capacity per province (Fath, 2002). The size of the circles indicates the sawmill capacity per province
Most of the sawn timber is produced in small-scale enterprises with
an annual production capacity below 2,500 m
3of sawn timber, and these
sawmills are considered to be a driving force for industrialization in rural
areas (Fath, 2002).
The production capacity and the logging capacity per province are
shown in Figure 2.2. The provinces of Sofala and Cabo Delgado have the
highest logging capacity while Maputo has the lowest. Maputo has the
highest production capacity.
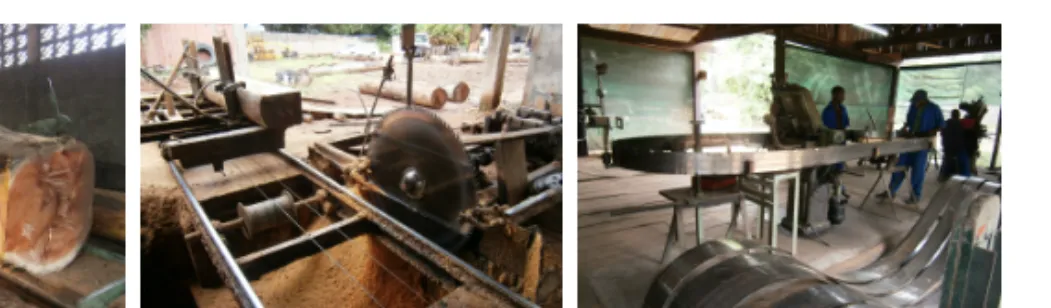
Sawmills have generally one sawing unit and the equipment commonly
used are bandsaws and circular-saw headrigs, as shown in Figure 2.3(a)
and 2.3(b). Circular saws are less used due to the large diameter of the
logs and also because of the thickness of the sawblade. Sawmills are also
equipped with sharpening tools and in some cases with machines or
guil-lotines to produce teeth of the bandsaw blades. A typical sharpener section
is shown in Figure 2.3(c). The teeth of circular saw blades are commonly
sharpened using hand grinders. The majority of sawmill machines are
second-hand and reconditioned and few sawmills have adequate
sharpen-ing tool installations.
(a) (b) (c)
Figure 2.3: Examples of common sawmill equipment in Mozambique: a) a headrig with a bandsaw (Cabrussica sawmill, Sofala), b) a circular saw sawmill (David sawmill, Nam-pula), and c) a sharpener section (Catapu sawmill, Sofala)
The saw strategies are defined by the sawyer or by the person in charge
of the sawmill or sometimes by the owner of the logs (sawmills also process
logs from simple license exploiters or others). This practice greatly affects
the volume yield of sawn-timber since the decision depends entirely on the
operator’s judgement and abilities, and in many cases it is made with a
2.1.
The forest industry in Mozambique
17
lack of knowledge of wood species and of the sawing process. The sawing
is frequently performed when the logs are green, and air or water is used
as lubricant to reduce friction between the wood and the sawblade.
For export, the sawn timber is transported from the sawmills to the
harbour and packed in containers for shipment. The sawn timber for
the domestic market is often sold directly at sawmills or at the informal
markets, 2.4(a) without being dried due to a lack of knowledge both of
the drying process and of its importance. If they are available, the drying
process uses kilns, but in some cases air drying is also used. Sawmills with
drying facilities mostly produce end-consumer products and occasionally
export sawn timber or roundwood.
The sawn-timber is further processed for the domestic market at
tra-ditional joineries without electricity and using hand tools, Figure 2.4(b).
In addition, small sawmills and joineries, Figure 2.4(c), provide services
to the traditional carpentries such as sawing, resizing the board thickness,
profiling, turning, etc.
(a) (b) (c)
Figure 2.4: The domestic sawn-timber market: a) typical domestic sawn-timber market, b) the traditional an the most common carpentry, and c) typical carpentry that execute works for the traditional carpentries
Chapter 3
Methodology approach
The mission of this project was to study the effect of sawing patterns
and of the log positioning on the volume yield of sawn timber from tropical
hardwood species, with a special focus on the special industrial conditions
which are applicable in Mozambique.
To build up a competitive wood industry in Mozambique, there is a
great need for change and development in both the sawmilling and the
forestry sectors. If logs of lower grade (crooked and irregular shaped logs)
could be processed to a greater extent than today with less waste, that
could increase profits, modernize sawmills, and put an emphasis on the
secondary processing of the sawn timber. If the present study shows that
the Mozambique sawmills would benefit from using log shape measurement
prior to sawing, it may provide an incentive for small sawmills to invest
in log-scanning techniques and log-positioning devices.
Since the technological level of the Mozambique sawmills (simple
saw-ing equipment, manual log positionsaw-ing, no data record for sawn timber,
no volume measurement devices, etc.) is low, simulation was chosen to
investigate the variation in the volume yield of sawn timber because it
means that the ”virtual” logs can be sawn an unlimited amount of times
in a ”saw simulator” if compared to the trial sawing in reality.
The strategy was:
1. to select some typical logs for use in investigating the sawing strategies,
2. to scan logs and build a database that describes the outer shape of
the scanned logs,
3. to develop the algorithm for simulation of the sawing process, and
4. to execute simulations to investigate the effects of sawing strategies
to on the volume yield of sawn timber, and to identify a strategy for
maximizing the volume yield.
3.1
Log selection
The features of tropical hardwood logs vary according to species, but there
are similarities such as the amount of sapwood and heartwood, the density,
the absence of knots in the trunk, crookedness, taper and so on. The most
visible feature is the crook, and in most cases it is oriented in more than
one direction (see appendix II). The crook varies among the species but it
is in general greater than in coniferous species. Although the harvesting is
selective, some species are particularly crooked even if the log is bucked to
one meter lengths. Thus, the crook was found to be the main parameter to
consider when investigating the different sawing strategies. The log length
was also used for the log selection.
The species were selected among the most exploited species for the
do-mestic market and for export. Chanfuta (Afzelia quazensis Welw.),
Um-bila (Pterocarpus angolensis DC.), Jambirre (Millettia stuhlmanni Taub.)
and Messassa (Brachystegia speciformis Benth.) are the most
predomi-nant. The Messassa specie is exported particularly as railway sleepers to
Zimbabwe and it also used on the domestic market. The selection was
based preliminarily on data from the Atlas of Wood Species in Cabo
Del-gado (Bunster, 2011). The atlas contains data for about 300,000 trees in
the Cabo Delgado province during the elaboration of management plan
inventories. The data presented in the atlas show the quantity of species
per number of trees per hectare, the quantity of stems per height and the
quantity of stems per quality. Of these parameters, the stem quality was
the parameter used in this work. The atlas classifies the stems in three
3.2.
Log scanning and the database
21
grades: grade 1 is straight logs, grade 2 is one crook, and grade 3 is two
crooks or more.
The quantity of stems in terms of quality is shown in Figure 3.1.
Jam-bire was found to be the most crooked species, where only 52% of the
species is grade 1 logs, grades 2 and 3 of Jambirre has the highest
pro-portions, which also means that the abundance of crooked logs is higher
than in other species. Chanfuta is the species that has the straightest logs
followed by Umbila and Messassa. However, these proportions may be
dif-ferent in other parts of the country due to the soil composition, vegetation
type and differences in the amount of rain. However, 35% of the logs have
some crook, an it is therefore of interest to improve the sawing for these
logs.
Chanfuta Messassa Umbila Jambirre 0 10 20 30 40 50 60 70 80 Share of stems (%) Grade 1 Grade 2 Grade 3
Figure 3.1: Share of stems per grade (Bunster, 2011)
3.2
Log scanning and the database
The project was set so that the scanning had to be performed in
Mozam-bique. To take the logs and perform the scanning in Sweden was not
possible because of the costs and the bureaucracy in exporting
round-wood. Another reason was the desire to investigate scanning methods for
small-scale sawmills for potential use in Mozambique. Thus, a portable
method to determine the log outer shape suitable for the Mozambique
sawmills had to be used.
The practical limitation was that the log had to be fixed during the
scanning because no (or very few) Mozambican sawmills are equipped with
conveyors to transport the logs, which is the requirement for traditional
scanning techniques such as laser triangulation, X-ray scanning, shadow
scanners, etc.
Portable devices have previously been used to measure the log shape
and for the data processing. For instance, Keane (2007) described the
AutoStemTM software, which imports the data from a laser scanner and
processes it automatically for each scan in 3 to 5 minutes. The result
from this scanner can be exported to different saw-optimization software
packages. Antikainen and Verkassalo (2013) described the acquisition of
log shape using structured light analysis (Kinect Sensor from Microsoft) in
which the 3D modelling and calculations were performed with a specially
developed graphics processing unit. Pinto et al. (2003) used a WoodCim
inspector scanning system to reconstruct Maritime pine logs. However, all
these methods require controlled, horizontal transport and/or rotation of
logs during scanning, a requirement that can be problematic under typical
Mozambican conditions.
Within the realm of portable scanners for potential use in structural
geometric measurements of stationary objects, three primary ranging
tech-nologies are being used in commercial laser scanners: (1) time-of-flight
discrete-return scanners, (2) continuous wave phase-shift scanners, and
(3) time-of-flight waveform scanners. However, these methods have some
drawbacks compared to the methods used to measure the log shape in the
saw line. They require more than one scan position to obtain a full
de-scription of the object, which results in low acquisition speed. Moreover,
the registration of scans is time-consuming and is not sufficiently
auto-mated and requires manual operations. Despite these disadvantages, the
structural geometric measurement of stationary objects was found to be
suitable method for data collection in a Mozambique sawmill environment
to build up the database. Although the method used by Antikainen and
Verkassalo (2013) has the potential to be used in a Mozambique sawmill
environment, it was not used in the present case because it requires
rota-tion of the log during the scan, which was the main limitarota-tion.
3.3.
Saw optimization
23
different angles from different positions.
3.3
Saw optimization
Optimization has been largely used to analyse sawmill performance
world-wide. The optimization methods used in the sawmill industry can be
cate-gorized as: (1) Empirical, i.e. the recovery is calculated using real sawing.
The same amounts of real logs are sawn with different sawing patterns and
the results are compared. Such results are the most accurate, but are
dif-ficult to compare because each log can only be sawn once. (2) Theoretical,
i.e. the recovery is calculated using mathematical log models. The yield
maximization issue is addressed as the packing problem, i.e. the problem
is the determination of the maximum amount of sawn timber that can be
fitted into a log of a certain cross section diameter. (3) Simulation, i.e.
the recovery is calculated using scanned log models and different input
variables (offset, skew, rotation, curve sawing, saw kerf width etc.). In
contrast to the mathematical optimization, the simulation uses the real
representation of the log (in some studies inner features were also used to
describe the log). The main advantage of simulation studies is that the
logs can be sawn an unlimited number of times. In the present work, the
main focus was on the simulation method.
Simulations have shown great potential to saw logs efficiently,
Todor-oki and R¨onnqvist (1999) used dynamic programming to describe some
procedures to determine the optimal cutting of flitches into graded
dimen-sional boards. Lin et al. (2011) concluded that the log grade, log diameter,
species, log crook, and log length affect the value and volume yield of sawn
timber. Lin and Wang (2012) studied the choice of the best opening face
in the sawing, edging, and trimming of sawn timber, and found that an
optimization system for the process stages could significantly improve the
value recovery and could also assist mill managers and operators in the
daily operation of the sawing process. In an optimization study, Lundahl
and Gr¨onlund (2010) showed that an optimal combination of rotation and
parallel positioning of the log in the first and second saw-machines of a
typ-ical Swedish sawmill could, on average, increase the volume yield by 8.6%.
Fredriksson (2014) complemented this study using computed-tomography
(CT) data to optimize the positioning of the logs before sawing according
to the knot structure in the log, and he reported that it was possible to
achieve a gain in sawn timber of up to 21%.
To perform the simulations, many computer algorithms have been
de-veloped and used to support and improve the sawing process. For
in-stance, Steele et al. (1987) used the best opening face (BOF) method,
where the model first determines the opening face that will produce the
smallest acceptable piece of timber and successive cuts are then made and
the resultant recovery determined. This process is repeated incrementing
the opening faces moving towards the center of the log. When all the
reasonable possibilities are examined, the Best Opening Face is chosen.
Dogan et al. (1997) developed the simulation or animation model of the
sawmill and sorting areas to investigate the replacement of the trimmer
in sawmill, to determine the availability of the forklift in sorting area and
so on. Gibson and Pulapaka (1999) developed an algorithm for log
ro-tation in sawmills where the arbitrary position was determined through
data scanning and the necessary angle of rotation was then calculated to
position the logs at horns up or horns down. Nordmark (2005) used
simu-lations to investigate the effect of measurement techniques in bucking and
log sorting on value recovery and production control.
In the work described in this thesis, the sawing principle used was
similar to that used in BOF.
3.4
Simulations
Simulations were executed to investigate the effect of different sawing
strategies involving different sawing patterns and positioning parameters.
The sawing patterns were defined as the result of combinations of
prac-tices seen in the field (Paper I), and three sawing patterns were identified
as being interesting to study: (1) cant-sawing – commonly used to process
sawn timber for export, the main products being cants and sideboards, (2)
through-and-through sawing – used to process sawn timber for domestic
market, the main products being un-edged centreboards and sideboards,
and (3) square-sawing – used in sawmills that produce end-user products.
For positing parameters, offset, skew and rotation were used and
follow-ing combinations of parameters were set for the studies: Paper III – saw
patterns (cant-sawing, through-and-through sawing and square-sawing)
3.4.
Simulations
25
and log positioning (skew and rotation); Papers IV and V – saw patterns
(cant-sawing, through-and-through sawing) and positioning parameters
(offset, skew and rotation).
Chapter 4
Materials and Methods
The studies presented in this thesis are divided as follows: (1) log
selection, (2) log scanning method, (3) the database, (4) algorithm for
simulation. The steps are described briefly below with more detail in the
appended papers.
4.1
Log selection
From a literature study (Paper I), Jambirre (Millettia stuhlmannii Taub.)
was found to be the most crooked, while Umbila (Pterocarpus
angolen-sis DC.) and Chanfuta (Afzelia quanzenangolen-sis Welw.) gave the straightest
logs. These species were found to be suitable for investigating the
saw-ing strategies. Thus, to select the species, the findsaw-ings from a desk study
were compared with the results from a visual inspection during the survey
made in the Cabo Delgado, Nampula and Sofala provinces. The visual
inspection validated the results from the literature, and Jambirre was the
species selected to represent the crooked logs and Umbila the straight logs,
because Chanfuta was not available in the sawmill were the data
collec-tion was performed. The data colleccollec-tion was performed in Pemba, Cabo
Delgado Province, this place being chosen because other sawmills were not
available.
4.2
Log scanning method
A 3D phase-shift laser scanner was chosen to measure the log shape
be-cause of the Mozambican sawmill layout and the log dimensions (Paper
II). The experiment was performed in Skellfte˚
a, Sweden. To validate the
measurements from the 3D laser scanner, a computer tomography
scan-ner (CT) was used to determine the log shape. Two species were used in
this study Birch (Betula pendula Roth.) and Scots pine (Pinus sylvestris
L.) and three measurements were made from different scan positions and
heights around the log to obtain the full shape of the log.
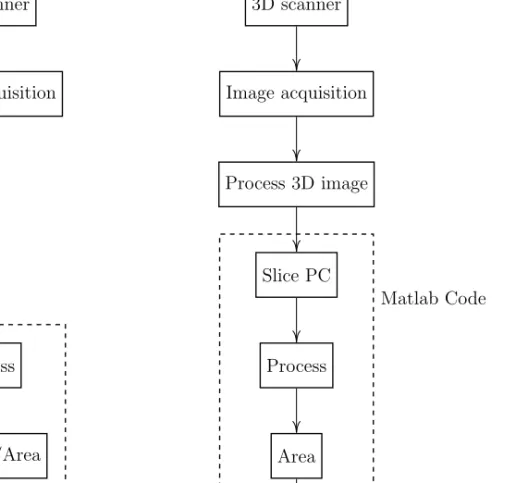
Analyze/Area Area Compare Cross-section areas Process Slice PC Process 3D image Image acquisition 3D scanner Process Image acquisition CT scanner
Matlab Code Matlab Code
1
Figure 4.1: Process flow chart of acquisition and processing slices areas from computer tomography (CT) and 3D scanner data
4.3.
Database
29
The 3D scanner generated point cloud data, and the CT scanner
gen-erated grey-scale slice images (taken every 10 mm along the log length).
The point cloud data were processed similarly to the CT-data, sliced 10
mm, and the areas that corresponded to each slice were compared. The
sequence of processing is shown in Figure 4.1.
4.3
Database
The scanning of logs for the database was performed in Pemba, Cabo
Delgado in Mozambique. The 3D laser phase-shift scanner (Faro Focus 3D
S-120) was used and five scans were taken around the log to obtain a full
description of the log (Paper III). Fifteen logs were scanned, 10 Jambirre
(Millettia stuhlmannii Taub.) and 5 Umbila (Pterocarpus angolensis DC.).
The outer shape of each log was described as a point cloud (with XYZ
coordinates and RGB colour). Examples of the log models are shown in
Figure 4.2. The logs were between 1.8 m and 3.8 m long and had top
diameters of between 23 cm and 39 cm.
(a) Log No. 6 - Grade 1
(b) Log No. 15 - Grade 2
(c) Log No. 14 - Grade 3
Figure 4.2: Three examples of reconstructed log models from the 3D-laser scanner. The examples shows the log shape and their grades according to Bunster (2012)
4.4
Sawing simulations
An algorithm was written in Matlab (MathWorks, USA) to simulate the
sawing process (see the pseudo-code of the algorithm in Appendix I),
con-sisting of placing pre-defined planes (board thickness from the sawing
pat-tern) and calculating the maximum sharp edged board volumes from each
sawing combination. The sawing patterns used for the simulation were
cant-sawing, through-and-through sawing and square-sawing (Figure 4.3).
In the first step, the top-end of the log was determined by comparing the
log-end diameters and then matched to the predefined log-diameter class
(Table 4.1). When the sawing pattern had been selected, the log was sawn
using different combinations of skew, rotation and offset (Figure 4.4).
In addition, the set-up parameters of the band-saw mill commonly
used in Mozambique were used. For cant-sawing and through-and-through
sawing, the kerf width was set to 3 mm, and for square-sawing a kerf
width of 3 mm was set for the bandsaw (first saw) and of 4 mm for the
rip-saw (second saw). To compensate for the shrinkage during drying, 4%
was added to the target cross-sectional dimensions regardless of the main
direction of the wood.
Table 4.1: Sawing patterns for cant-sawing, through-and-through sawing, and square-sawing, showing the thickness of sideboards and centreboards for each log-diameter class. These sawing simulations have been used in all studies
Log-diameter
class (mm) Sawing patterns
No. Min. Max. Cant-sawing (CS) Through-and-through (TT) Square-sawing (SS)* 1 0 249 25 25 50 50 25 25 25 25 25 25 25 25 25 25 CS+25 (rip-sawing) 2 250 289 25 25 75 75 25 25 25 25 25 50 50 25 25 25 CS+25 3 290 329 25 25 100 100 25 25 25 25 50 50 50 50 25 25 CS+25 4 330 369 30 30 100 100 30 30 30 30 50 50 50 50 30 30 CS+25 or 50 5 370 409 30 50 100 100 50 30 25 50 50 50 50 50 50 25 CS+50 6 410 449 30 75 100 100 75 30 25 50 50 75 75 50 50 25 CS+50 7 450 489 50 75 100 100 75 30 25 75 75 75 75 75 75 25 CS+50 *SS was a combination of cant-sawing (same sawn-timber thickness) and a second sawing stage where the cant was rip-sawn into boards of equal thickness. The board thickness of 25 mm was used when the cant-width≤ 339 mm, and for a cant-height of 50 or 75 mm, but the board thickness was set to 50 mm for a cant-width≥ 340 mm and a cant-height of 100 mm.
4.4.
Sawing simulations
31
(a) (b)
(c)
Figure 4.3: Cross-sectional views (top-end of the log) of the sawing-patterns used in the simulation: a) cant-sawing (CS), b) through-and-through sawing (TT), and c) square-sawing (SS). SB and CB are respectively sideboards and centreboards
4.4.1
Log positioning parameters and sawing
pat-terns
The simulation algorithm positions the log before the first cut by skewing,
offsetting and rotating the log (Figure 4.4). In each study, the following
sawing parameters were used:
Figure 4.4: Definition of the positioning parameters offset, skew and rotation
In Paper III, the simulations were performed to investigate which
ing pattern gives the highest volume yield of the sawn timber. Three
saw-ing patterns (cant-sawsaw-ing, through-and-through and square-sawsaw-ing) were
used and two positioning parameters (skew and rotation). The skew was
varied from -1
◦to +1
◦mm with steps of 0.5
◦and the rotation from 0
◦to
180
◦in steps of 2
◦.
In Paper IV, two simulations were performed to investigate the most
effective positioning parameter and the reduction of volume yield when
positioning the log manually, knowing the optimal positioning of the log
that gives the highest volume yield of sawn timber.
The optimal positioning was determined using the following sets: two
sawing patterns (cant-sawing and through-an-through) and three
position-ing parameters: offset (-100 mm to +100 mm, steps of 10 mm), skew (-1
◦to +1
◦, steps of 0.5
◦) and rotation (0
◦to 360
◦, steps of 5
◦).
4.4.
Sawing simulations
33
• To investigate the parameter having the greatest effect, the following
parameters where used: offset (-30 mm to +30 mm, steps of 1 mm),
skew (-0.7
◦to +0.7
◦, steps of 0.1
◦) and rotation (-30
◦to +30
◦, steps
of 1
◦). The parameters were varied one at time, i.e. fix two and vary
one.
• To investigate the reduction in volume decrease, the following
param-eters were used: offset (
± 15 mm), skew (± 0.35
◦) and rotation (
±
15
◦), the parameters were randomly and simultaneous varied.
In Paper V, the simulations were performed to evaluate the possibility
of using crook as a means of positioning, and the possibility of increasing
the volume yield of sawn timber using bucked logs. The logs were bucked
in half length. The following sawing parameters were used:
• To determine the optimal positioning. Offset (-100 mm to +100 mm,
steps of 10 mm), skew (-1
◦to +1
◦, steps of 0.5
◦) and rotation (0
◦to
360
◦, steps of 5
◦).
• Crook-up sawing. Offset (-100 mm to +100 mm, steps of 10 mm),
skew (-1
◦to +1
◦, steps of 0.5
◦) and rotation (0
◦);
Thus, the only difference in settings was in rotation because 0
◦is
horns-down position.
The sawing was performed using cant-sawing and through-and-through
sawing for all logs (full-length and bucked logs).
4.4.2
Log crook, grading and bucking
The crook for each scanned log was determined as follows (Figure 4.5):
(1) at 10 mm intervals along the length of the log, the geometric centre of
the cross section (disc) was determined, i.e. the arithmetic mean position
of all points that define the outer shape of the log at that position. (2)
a straight line was drawn between the geometric centres of the outermost
two cross sections of the log (the top and butt ends of the log). (3) the
crook of each log was then defined as the maximum distance between the
line defined in (2) and the geometric centres of the cross sections.
Straight line Maximum distance
Geometric centre
Figure 4.5: Two lateral views of the same log showing the log crook. The curved line (dotted line) represents the geometric centres of cross-sections at 10 mm intervals along the length of the log. The straight horizontal line is the connection of the geometric centres of the two outermost cross-sections. The log crook is defined as the maximum distance between these lines (the highlighted circle)
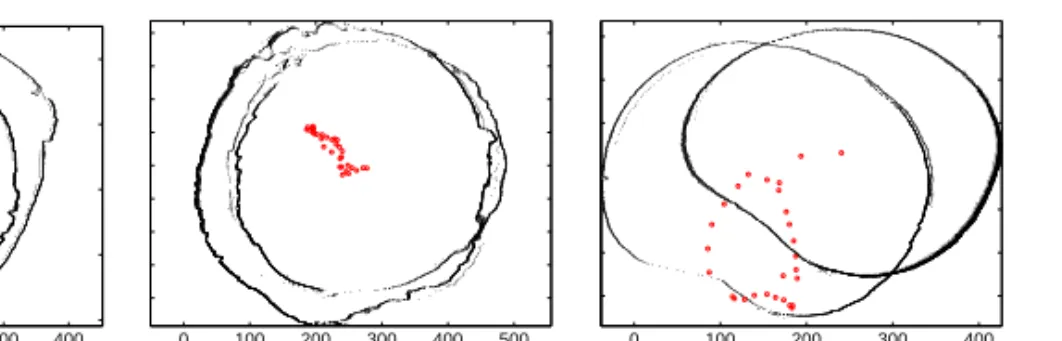
Examples of the different levels of crookedness are shown in Figure
4.6. The geometric centres of the cross sections along the log are seen
as group of dots in the central regions. A fairly straight log has all the
geometric centres well centralized, while a crooked log has the geometric
centres scattered over the cross section.
−100 0 100 200 300 400 (mm) (a) 0 100 200 300 400 500 (mm) (b) 0 100 200 300 400 (mm) (c)
Figure 4.6: The cross-section view of the log periphery at the top-end and butt-end of three logs from the database, and the geometric centres calculated at each 10 mm of the log length (the circles in the central region of the cross sections). The degree of log crookedness is illustrated as the scatter of the geometric centres: a) a fairly straight log, b) a single crooked log, and c) a double crooked or tortuous log
The crooks of the 15 logs in the database were computed and a crook
of 60 mm was chosen as the limit, in order to enable the logs to be grouped
into two grades, where Grade 1 consisted of those with a crook less than
60 mm and Grade 2 greater than or equal to 60 mm.
4.4.
Sawing simulations
35
Butt-disc
Top-disc
The disc representing the maximum distance Horns-down position
Rotation angle α
Maximum distance
Line connecting the two outermost discs
Sawblade
Figure 4.7: Principal procedure used to position the logs in horns-down position. The saw-blade has a vertical position and the log is rotated an angle α so the maximum crook of the log is parallel to the sawblade. Maximum distance is between the ”two line” in Figure 4.5
Knowing the size and the position of the crook, each log was rotated
to horns-down position using the procedure shown in Figure 4.7. The
procedure is similar to that used by Gjerdrum et al. (2001). Examples of
the un-rotated and rotated logs are shown in Figure 4.8. For bucking, the
logs were divided in half.
Figure 4.8: Three examples of log models showing the outer shape of the logs, and the geometric centres of the cross-sections at 10 mm intervals along the length of the log (the dots close to the centre). In the first row, the logs are positioned according to the scanning position (random selected positions); while in the second row the same logs are positioned at the horns-down position
4.4.3
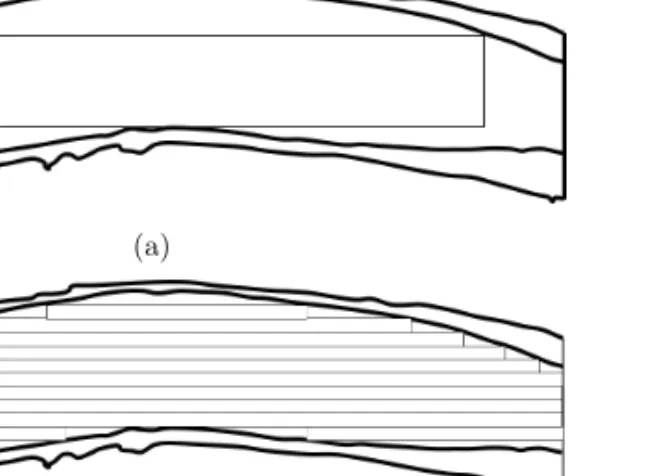
Edging and calculation of the board volume
For a given sawing pattern, the volume yields of all the boards or
compo-nents at each position (offset, skew and rotation) were calculated and all
the sawn timber volumes of each log were recorded. The simulator
dis-played the volumes with the respective offset, skew and rotation positions.
During the edging of the sawn timber in the CS and TT sawing
pat-terns, the board volume was maximized (Figure 4.9). The minimum width
accepted was 50 mm, a width module of 5 mm was used, but no length
module was used.
The minimum length of a component during square-sawing was set to
200 mm (which is the minimum length of raw material to produce one
component of flooring parquet).
(a)
(b)
Figure 4.9: a) Flat view of simulated cant from cant-sawing (CS) or board from through-and-through sawing (TT). The rectangle represents the maximum fitted size of a sharp edged board or cant. b) Flat view of simulated board from the second saw in square-sawing (SS). Each rectangle represents a ready-to-use sharp-edged component