UI design for PAIN-OUT Online System
UI design specification for online access of the PAIN-OUT databaseXiaojie Yang (890807-p585) (xyg12001@student.mdh.se)
August 15, 2014 Västerås, Sweden Course Code: DVA 503
A thesis in partial fulllment of the requirements for the degrees: Master Science in Embedded System
Thesis supervisor: Mattias Olausson (mattias.olausson@mdh.se) Thesis Examiner: Peter Funk
(peter.funk@mdh.se)
Mälardalen University PAIN-OUT School of Innovation, Design and Engineer
2
Abstract
How to achieve a quality improvement for individual post-operative pain treatment is an important issue. PAIN-OUT is a multinational research project and its aim is to build functional software for clinicians with post-operative pain management. This paper presents a specification for a UI that is intended for physicians to intuitively access the database and to help them in decision making for the postoperative pain treatment. The interface design is tailored for PAIN-OUT data and combines the UI design knowledge and the physicians’ need. In order to meet the needs, and to implement the design into current PAIN-OUT computer aided system, the mockup design is developed as a HTML’s prototype. To verify the design’s performance, we connect the case library and the interface design in Matlab to see the work out. We also made a small demonstration video for the design and asked the expert from PAIN-OUT to offer some professional opinions.
Acknowledgement
This paper is my master thesis in the Mälardalen University in Sweden. This thesis’s work lasting five months; throughout this challenging journey I had the untiring and patient support from many friends.
I cannot finish this paper without the encouragement and guide from Prof. Peter Funk and my supervisor Mattias Olausson. Thanks to both of them give me suggestion and help me through all five months. Thanks for Ragnar, your advice is a critical part in this thesis and is very helpful in planning the future work. I would like to thank Dr. Mobyen Ahmed, his work the foundation and precondition for this thesis; without the case library and current online system from him, I cannot finish this paper.
4
Content
UI design for PAIN-OUT Online System ... 1
Abstract ... 2
Acknowledgement ... 3
List of figures ... 6
List of Tables ... 7
1 Introduction ... 8
1.1 Significance of the Pain-out database ... 8
1.2 Object ... 9 1.3 Outline ... 9 2 Background ... 10 2.1 CDSS ... 10 2.1.1 Definition ... 10 2.1.2 History ... 11 2.2 Success CDSS Cases ... 12 3 PAIN-OUT System ... 13 3.1 PAIN-OUT ... 13 3.2 Purpose ... 13 3.3 Data collection ... 14 3.4 Structure ... 15
3.4.1 Case types and case representation ... 15
3.4.2 Feature abstraction ... 17
3.4.3 Case matching and case retrieval ... 17
3.4.4 System verification ... 17 3.5 Questionnaire paper ... 18 3.6 UI design ... 19 4 Method... 22 4.1 PAIN-OUT study ... 22 4.2 Case filtering ... 22 4.3 Data analysis... 23
4.4 Use cases design ... 23
4.5 Interface design ... 24
4.6 Implementation ... 25
4.7 Interview ... 26
5 Data analysis ... 27
5.1 Data format in Matlab ... 27
5.2 Data distribution ... 28
5.3 The correlation coefficient ... 32
6 Result... 35
6.1 Use case design ... 35
6.2 Interface design ... 36
6.2.2 ICD9 Surgical procedures code search engine... 40
6.2.3 Outcomes report page ... 41
6.2.4 Outcomes report comparison page ... 42
6.2.5 Medication report page ... 43
6.2.6 Case details information page ... 44
6.3 Interview and feedback ... 45
7 Conclusion ... 47
8 Future work ... 47
6
List of figures
Fig 1 PAIN OUT architecture, copy with permission from PAIN OUT [57][29][58]. ... 14
Fig 2 Cases clustering algorithm [38] ... 16
Fig 3 PAIN-OUT Case library structure ... 19
Fig 4 PAIN-OUT online interface [28] ... 20
Fig 5 PAIN-OUT online outcomes report [29] ... 20
Fig 6 Thesis working flow chart ... 22
Fig 7 Sequence diagram for use case two ... 24
Fig 8 Interface design with Balsamiq ... 25
Fig 9 Implementation by Matlab GUI ... 26
Fig 10 Date structure example ... 28
Fig 11 Worst postoperative pain distribution difference in co-morbidities ... 29
Fig 12 Worst postoperative pain distribution difference in gender ... 30
Fig 12 correlation coefficient [41] ... 32
Fig 13 Correlation coefficient result for feature M6... 33
Fig 14 correlation diagram ... 34
Fig 13 structure of the CDSS interface ... 37
Fig 14 start page ... 38
Fig 15 start page with co-morbidities sub window ... 39
Fig 16 Start page with warming message ... 39
Fig 17 ICD9 search engine ... 40
Fig 18 ICD9 search engine with warming message ... 40
Fig 19 Outcomes report page ... 41
Fig 20 Outcomes report page (details) ... 42
Fig 21 Outcomes comparison page ... 42
Fig 22 questionnaire form in M9 ... 43
Fig 23 Medications report page (radio button group) ... 43
Fig 24 Medications report page ... 44
Fig 25 Single case page ... 45
List of Tables
Table 1 Pain level ... 19
Table 2 Pain distribution ... 28
Table 3 Co-morbidities distribution ... 29
Table 4 gender distribution ... 29
Table 5 age distribution ... 30
Table 6 height distribution ... 30
Table 7 Anesthesia distribution ... 31
Table 8 General anesthesia distribution ... 31
Table 9 Regional anesthesia distribution ... 31
8
1 Introduction
Introduction chapter presents this paper’s organization and relative knowledge which should be under studied. Moreover, thesis’s context, motivation and the organization of this thesis will also be presented in this section.
1.1 Significance of the Pain-out database
We live in a world where the evolution of technology occurs rapidly. People are expecting new technologies can create more convenient for their daily life, to improve their life quality in various aspects. They even hope that the AI can replace some professional human-made jobs. In the medical field, doctors’ reliance on the modern technology is more than ever, machines like MRI, PET, X-ray scan machine and a lot more are playing a vital role in the diagnostic process.
As a multinational research project, PAIN-OUT’s ultimate goal is to improve the clinical decision in the treatment of patients who are suffering from post-operative pain. There are over 40 million patients take surgeries in the European Union [25]. Patients’ feeling after the operations may differ from various reasons, e.g. patient’s age, operation site or drug ingestion. Inappropriate medical approach may leads to the pain suffering and overload of the health care resources.
In practice, the clinicians make a pain treatment plan based on guidelines, standard protocols and evidence-based approaches before the operation. They monitor the recovery and pain levels afterwards and adjust treatments when necessary. However, around 30% of the population does not conform within recommended procedures due to some individual factors, unusual or exceptional clinical situations [16].
Senior doctors might have experience with unusual or exceptional situations but may not be able to clearly remember them at the point of care due to large amounts of regular situations. That’s why a quality improvement of individual postoperative pain management has become an important issue.
In recent years, with the rapidly developing of case based reasoning system, and CDSS (Clinical decision support system), there are lots of well designed systems to enhance the quality of clinical treatment. But up till now, not so much of them are focus on the relation between postoperative out comes and clinical treatment, and facing to the surgeons at the same time. PAIN OUT is insisting on cooperating with professional societies. So they want a system which can use an offer a strong decision
support CDSS system with a clear friendly interface.
1.2 Object
Base on the understanding of preview’s PAIN-OUT research work and PAIN-OUT’s data structure. This thesis should extra those patterns hiding behind the huge data. To prove that case query can help surgeons to access the data batter. This paper’s object is to present a user interface for a PAIN-OUT computer-aid system, make the output of the system can be easily digested by doctors. Help doctors make a painless treatment for their patients and help them to have a better overview of general situation.
The UI design will be send to several experts who had close cooperation with PAIN-OUT before. Let them judge the design and send the user report back, in order to improve the design to fit doctors’ need. After the design is become mature and be recognized by the experts, put the UI design online and connect with the SQL database. Merge the UI design with current PAIN-OUT computer aid system to make it more like a product facing to the medical staff.
1.3 Outline
This thesis’s work can be divided into three phrases:
Reference study: The first phrase is the references study for theory knowledge about Clinical decision support system (CDSS). And study the common algorithms in CDSS. Those references include successful and famous examples during the past several years in clinical area are also on the list. Also the studying about UI design principles and web site design guidelines.
PAIN OUT: The second phrase study is about understanding the PAIN OUT data base. Study other people’s work on PAIN OUT; understand the PAIN OUT case library and the questionnaire form. Talk to the former developers on this project, get useful tips and experience from them. Based on a fully comprehending of the case library, analyzing those cases in it in different way and trying to find out the hidden data pattern.
UI design: Last phrase is to design an interface to help doctors in making a painless treatment plan. Talk to PAIN-OUT experts about the design and implement it.
10
2 Background
2.1 CDSS
2.1.1
Definition
Clinical decision support system (CDSS) is an interactive Expert of Computer Software, which is designed to help physicians and other health professionals with decision making tasks, such as determining diagnosis of patient data[18].
“Clinical Decision Support systems link health observations with health knowledge to influence health choices by clinicians for improved health care”---- Robert Hayward [18]
Early CDSSs were derived from expert systems researches, with the developers striving to program the computer with rules that would allow it to “think” like an expert clinician when “talking” to a patient. Among those early researches there was growing recognition that these systems might be helpful beyond researches, that they could be used to assist clinicians in decision making by replace some routine tasks, warning clinicians of some potential problems, or providing suggestions in clinician consideration [20].
Latterly, the CDSS becomes one of the major topics in the artificial intelligence (AI) application in medicine area. The main purpose of most CDSS is to offer a better care to patients.Traditional ideals of CDSS using in the systems were to literally make decisions for the clinician. CDSSs (Clinical decision support system) usually are designed to [20]:
Remind clinicians of things they intend to do, but should not have to remember; Provide information when clinicians are unsure what to do;
Correct errors clinicians have made;
Recommend that the clinicians change their plans. Conceiving in this way, it should be obvious that the users’ reactions to CDSS may differ with these diverse intents.
The most common use of CDSS is for addressing clinical needs, such as ensuring accurate diagnoses, screening in a timely manner for preventable diseases, or averting adverse drug events. Common features of CDSSs that are designed to provide patient-specific guidance include the knowledge base (e.g., compiled clinical information on diagnoses, drug interactions, and guidelines), a program for combining that knowledge with patient-specific information, and a communication
mechanism—in other words, a way of entering patient data (or importing it from the EMR(Electronic health record)) into the CDS application and providing relevant information (e.g., lists of possible diagnoses, drug interaction alerts, or preventive care reminders) back to the clinician [20].
2.1.2
History
In 1950s, with the seeds of integrated circuits and operating systems, the developing of clinical decision support systems started. Then, a group from Massachusetts General Hospital started working on a diagnosis support system. After a long time hard research and developing, they finally released their works in 1986, which include a 500 diseases data base [30]. This system still can be seen in some places, but with a bigger data base with 2400 kinds of diseases and 5000 clinical findings, and more advance system performance. This system can realize two main functions: Outputting several diagnoses for one patient and the reasons why the system
proposed them, and working as a comprehensive,
Completing medical textbook, offering updated references for each disease stated.
Later a more sophisticated CDSS emerged in the 1970s: CADUCEUS. This system was also created to find diagnosis; its search engine was based on a scale. Generally, the physician needs to give 2 rating: one for evoking strength and another for frequency weight [31], when he wants to input some specific features of a disease. For a particular symptom – disease relationship, value 0 in frequency weight is for the symptom is almost appeared in this disease, value 5 equal to this symptom is always relate to this disease; and for evoking strength, 0 means a disease would never be diagnosed using that finding alone, value 5 meant that all the patients had the specific symptom; while for additional scale, is to measure if a certain symptom should be considered as a critical part for the diagnosis. This system is a mail stone because it introduced the similarity between diagnosis in to calculation; with this new scaled model, the system can tell more slightly difference among disorders [32]. One of the most prominent CDSS should be Isabel, which is also created to return a diagnosis [31][33]. Isabel has been so popular since it was born: it has already been tested 23 times in different studies and clinical experiments. And in 2009, the American Medical Association started to use Isabel in its online heath information solutions platform. Isabel has 3 sub-systems inside: one for pediatrics, one system for grown up and another one for bioterrorism diagnosis reminder. It is also easy to use, doctors needs to enter the information about patient, which include patient’ symptoms, then Isabel returns a set of suggestions from data base, which includes alerts when the system think this case needs special attention.
12
2.2 Success CDSS Cases
CDSS software can run like a search engine, looking for similar patients to the one that physician has. The searching can be done automatically by using advanced techniques of machine learning and data mining. Since CBR (case based reasoning) tries to reproduce the reasoning of the human mind, it is natural that such a theory might be applicable in CDSS. While on the other side, CDSS usually is precise and sensitive, some features may be characteristic to a certain diagnosis, while others might appear only occasionally. Because of the complexity of the medical knowledge, some of the adaptation change must be performed manually by an expert [34]. The PAIN-OUT computer-aid system by Mobyen [16] can be treated as a CDSS using the CBR technique.
Early cases for using CBR for a CDSS like [8]:
CASEY: Researches in medical domains have used CBR since CASEY [11]. CASEY comes from the Heart Failure program, it uses integrates case-based and causal reasoning techniques with a model-based expert system to manage cardiac disease patients. CASEY contains a self-organizing memory system to store the history cases. A typical patient description in the data base should include around 40 features. In the Heart Failure program, there were a set of 45 patients with symptoms of heart failure covering about 15 different diseases been tested.
MEDIC: a schema-based diagnostic reasoner whose domain is pulmonology. [47];
PROTOS, which diagnosed audio logical disorders [12]. One of PRotos' most appealing characteristics is its flexible interaction with a domain expert. The language used by PRoros admits only nominal properties. The interactive nature of PROTOS' operation and the desire to avoid restricting the expert allows the expert to alias existing terms. A case may be described by properties having multiple values. For example history can take the values vomiting and dizziness for the same case.
But diagnosis is not the only application in medical domain that has been supported by CBR technology. The Auguste Project [8] invented a CBR system to natural to provide decision support for planning the ongoing care of Alzheimer’s disease (AD) patients. And CBR systems have also been built to:
Educate the user about sickle cell disease [48]; Support the design of radiation therapy plans [49];
Support the selection of diagnostic imaging procedures [50]; Assist in the interpretation of radiological images [13]; Support nursing diagnosis, prognosis and prescription [14]; Plan daily menus to meet special nutrition [15].
3 PAIN-OUT System
3.1 PAIN-OUT
Since the establishment of PAIN-OUT project, the research around it has never stopped. This paper’s work cannot be successfully completed without those previous studies’ help. Now the PAIN-OUT data base has more than 37,000 cases which come from PAIN-OUT’s 11 pasterns all around the Europe; and meanwhile the size of the data base is keep increasing. One PAIN-OUT CDSS system available now is developed by Peter Funk and Mobyen Uddin Ahmed from Mälardalen University in Sweden [16] PAIN-OUT was started in 2011 which is a very ambitious European multi-national research project and aims to building a functional software for clinicians with postoperative pain management [54] [25] [55]. PAIN OUT is a large project, including 19 partners from the whole Europe, which compose by universities from United Kingdom (UK), Germany, Sweden, Italy and others; as well as centers, such as Luzerner Kantonsspital from Switzerland, Centre Hospitalier Universities Raymond -Pointcare from Paris, and Tel-Aviv Sourasky Medical Center from Israel, etc.
This project's leaders aim to help an existing project from PAIN-OUT, European observational study of chronic post-surgical pain, euCPSP. The key part of this project is the keep growing statistics showing how many people suffer from chronic pain after a surgical procedure.
3.2 Purpose
Up till now, it has been estimated that every year approximately 40 million European patients have a surgery. From these people, about 30% suffer from chronic post surgical pain (CPSP). And around 5 to 10% patients suffer from severe CPSP with functional impairment, which is already became a big concern for the European medical world. For CPSP, there have been plenty of national studies about it, but so far there wasn’t any chance to get enough data from all around the Europe to analyze “the incidence of CPSP, differences in CPSP patterns in Europe, incidence in rare types of surgeries and specific populations”; this is exactly the objective of PainOut [25].
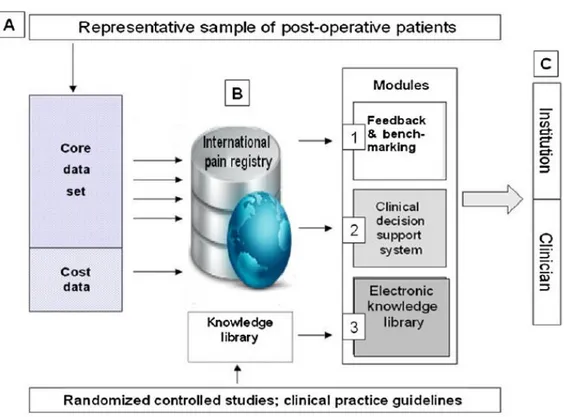
PAIN OUT aims at improving postoperative pain outcomes by use of:
PAIN OUT will work as feedback and benchmarking system that can provide the clinicians with the latest update about the “best clinical practice”. The system will also work as a Knowledge Library that can help clinicians by providing
14 updated information and comments on various postoperative situations [25]. It is a clinical decision support system that helps the doctors to reduce the
postoperative pain of the patients [25].
It is case based system which uses two structures, returns as output both a solution and outcome: physician completes a questionnaire with the data of his patient, and the system returns the most similar past cases, presenting for each the treatment, the severity of the pain and the evolution of the recovery [16].
3.3 Data collection
Fig 1 comes from PAIN OUT official web site, to describe precisely how the PAIN OUT can realize those functions:
Fig 1 PAIN OUT architecture, copy with permission from PAIN OUT [54][26][55].
The Electronic Knowledge Library (EKL) includes the summaries of different aspects of pain management information and knowledge about the latest practices and guidelines in an electronic, easy-to-handle format, accessible to anyone interested [54][55] [25].
The reasons why there are so many people are experiencing extra postoperative might because of an unsuited treatment, the dosage of the medication, or the combination of drugs, etc. Research shows that around 75% of the patients have got a general postoperative and the rest 25% are the rare case, which means they got
special treatment [16].
A desirable CDSS would use both regular cases and rare cases. Because those rare cases might be a crucial part in deciding the treatment for a patient in a special circumstances, and those regular cases can offer a good observation about the proper dosage of medication needed, depending on the age, gander, weight, height and etc. The diversity of the information from data base is one of the most important standards to judge if the PAIN OUT data base is good or not. A system like this should combine by 90% regular cases, 4% unusually severe outcomes cases and 6% cases with extra ordinary good recovery [16].
3.4 Structure
3.4.1
Case types and case representation
Whether the data of the patient is complete and written in a universal language is very important, so that the information can be applied to various situations [16]. That’s why there are so many cases in the data base, but not every of them can be accepted by the CBR system.
There are two kinds of cases in the data base, rare cases and regular cases. The regular cases “are those based on standard medical care procedures and protocols devised in medical or clinical practice guidelines and repositories” [16]. Most of the regular cases are point of care scenarios and assessments produced by an expert working for PAIN-OUT who takes guidelines and local practices into consideration. Those cases occupy 60~70 percentage of the data base. The rest of the regular cases are real cases, where physicians applied one of the standard procedures when deciding the postoperative treatment; these are different from the scenarios because they include only one procedure, and not all the options, as the scenarios.
The rare cases are all the ones which “do not follow any standard protocol”, and they can be real patient cases, research cases or statistical cases. The real patient cases are considered rare based on the symptoms, actions taken and outcome of the patient; for example, cases with uncommon severe outcomes might help physicians to prevent these rare episodes of happening again. The research cases are drawn from the current relative research for PAIN-OUT; from publications, or some diagnosis treatment or other medical research, and might be critical by indicating. The statistical cases are from medical databases and benchmarks for pain treatment; these cases might help if a patient doesn't find matching from the guideline cases, and might include newly introduced treatments.
The computer aid system by Moyben [34] uses a second order clustering algorithm [17] to identify rare case, which is combined of the fuzzy c-means algorithm [6] and
16 the hierarchical algorithm [35]. Under this design, the system can remind of the user to take care about those similar cases with the query one which have some abnormal outcomes. Since there are 10~30% patients in the actual course of treatment represents rare cases, the percentage is too high to be ignored, so a good decision support system should with an advance accuracy and precise in identifying these unusual cases.
FCM (fuzzy c-means algorithm) and Hierarchical methods were applied in a 2nd order clustering manner since they have shown (according to this study and experimental work) to be well suited for the domain in order to mining the rare cases. FCM, which can be applied to analysis or clustering, can place one piece of data in more than one cluster, “it associates each element a membership level” [17]. FCM, also referred to as soft clustering, is an unsupervised clustering algorithm that has been applied to a wide range of problems involving feature analysis, clustering and classifier design. It is similar in structure to the K-means algorithm and also behaves in a similar way except that the fuzzy behavior is also considered.
The Hierarchical algorithm clusters data over a variety of scales by creating a hierarchical structure (tree). The tree is not a single set of clusters, but rather a multilevel hierarchy, where clusters at one level are joined as clusters at the next level [35].
First of all, every pair of the objects in the data set should be analyzed and classify as similar or dissimilar.
Objects should be clustered into binary hierarchical cluster trees and those similar should be linked. Now that all those objects have already paired into the binary cluster, the new clusters are grouped to larger clusters until a hierarchical tree is formed.
The third step is that, determining the cutting position of the hierarchical tree into clusters. It moves the branches off at the bottom level of the hierarchical tree, and makes all the projects below the cutting point to a single cluster.
More specifically, Fig 2 shows how the algorithms really work on a test of 1572 cases:
3.4.2
Feature abstraction
Every case from the data base has hundreds of attributes; they can be roughly divided into three groups:
Problem description (278 attributes) Treatment as solution ( 685 attributes) Outcome (19 attributes)
Those attributes are collected through a questionnaire form, and abstract in a specific from into the data base: “has been done only considering the problem description and outcome information, which further mapped the solution” [16].
3.4.3
Case matching and case retrieval
The quality and completeness of the data from the case base and the performance of the retrieval algorithm can make a directly impact on the performance of the retrieval component. To find out the most similar cases to the current one from the case base, Mobyen [16] uses the standard nearest-neighbor method as a global algorithm, and modified distance function, similarity matching and fuzzy similarity matching as the locally stratagem. To enhance the matching algorithm, the system also can introduce local weight to every attributes. The similarity for a feature is defined by “a numeric matrix quantifying the degrees of similarity for every pair of symbolic values associated with that feature” [16].
3.4.4
System verification
The verification of the solution consists of four parts [16]:
Accuracy: take a known query case from the case base and try to find similar cases. The most similar option the system return should be the case itself, with 100% similarity.
Consistency: input the same case in to the system for several times, every time it should return the same result, then the algorithm is consistent.
Case duplication: The consistency test procedure is also used for testing the case duplication.
Global test: The global test should assess if the solution is good enough to be used as a treatment. Even if the cases returned present different outcomes, the physician can look at the 5 most similar cases and draw relevant conclusions from them.
18
3.5 Questionnaire paper
All those cases in the PAIN-OUT cases library are collected from questionnaire forms, and then format in a setting way into the SQL data base. Both the data base and the questionnaire forms is designed and implemented by Mobyen [27]; Mobyen used the PHP and MySQL to build his system.
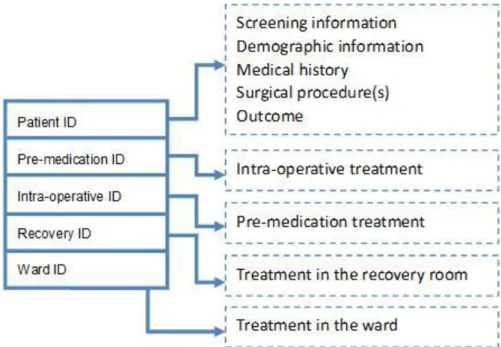
The questionnaire form has been updated once, the data format between two versions are slightly different. The data base includes both the previous cases from old questionnaire form and the present cases from the new one. The questionnaire form can be divided as follow:
Screening information Demographic information Medical history Pre-medication treatment Surgical procedure(s) Intra-operative treatment Treatment in the recovery room Treatment in the ward
Outcome
Screening information contains three questions about the patient’s situation during the interview. Demographic information records the patient’s personal information, which including age, gender, nationality etc. Medical history records if patient has any co-morbidities or history of chronic diseases; if the patient is pregnant or did the patient take any medicine in the history. Pre-medication treatment is about the sedatives and other medicine the patient take before the operation. Surgical procedure(s) part writes down the name of operations. Intra-operative treatment is about the medicine that is taken during the operation and the patient’s wound infiltration. Treatment in the recovery room and in the ward shows the analgesia, opioids and non-opioids medicine the patient take.
The outcomes part of the PAIN-OUT is the information about the patients’ postoperative situation after the surgery. There are 13 questions in the questionnaire around the outcomes part. The pain is classified by the Numeric Rating Scale (NRS-11) [36], which is an 11–point scale for patient self-reporting of pain. For each patient, his (or her) postoperative pain is rated from 0 to 10. 10 stands for the most severe pain and 0 means no pain at all. Each patient records how long the maximum pain and the minimum pain he (or she) felt. Each patient also rated for how long he/she felt the maximum pain and the minimum pain. Also the side affection and emotion affection caused by the surgery is also recorded. According to the documentation from the National Institutes of Health [36] pain level can also be divided as following table. In the later chapter, it will be used into data analysis.
Table 1 Pain level
Rating Pain Level
0 No Pain
1 – 3 Mild Pain (nagging, annoying, interfering little with ADLs) 4 – 6 Moderate Pain (interferes significantly with ADLs)
7 – 10 Severe Pain (disabling; unable to perform ADLs)
There are 37,000 cases in the case library, and for each of them there are close to 1,000 attributes. Be able to implement a fast searching tactics, there are 5 SQL case base saving different parts of those cases; like in the Fig 3. Every case has 5 IDs related to every case base, depends on what user can find out the case details for one specified case. One additional attention should be paid is that; sometimes one ID from case A for case base B may coincidentally the same to Case C’s another ID for case base D. So if the system calling the wrong case ID, the wrong information will be return.
Fig 3 PAIN-OUT Case library structure
3.6 UI design
Pain out is trying to developed a system which can help a surgeon in decision making through a reasonable case searching and searching result analysis. What we need for this CBR system is: a huge case base with complete information (e.g., inclusion criteria, demographic information, medical history, pre-medication, surgical procedure, intra-operative, recovery room and ward); a fast good searching strategy (e.g. n–nearest neighbor algorithm, fuzzy search) and a suitable way to produce the statistical report.
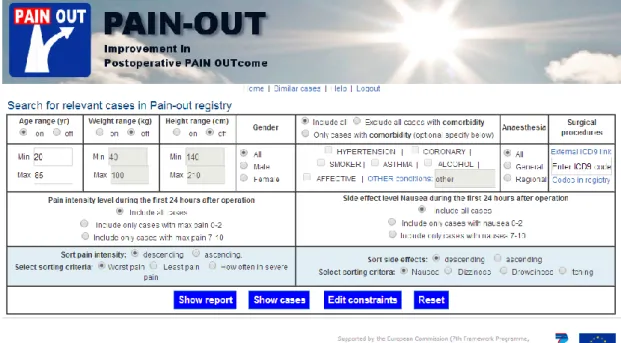
20 Fig 4 PAIN-OUT online interface [25]
Mobyen has already developed an online analysis system for PAIN-OUT [25], which can offer a PAIN-OUT data base analysis report base on the input search criteria (See
Fig 4 and Fig 5). This design can help professional scholars in this field to quick access and understand the case library. Since the main users of this Pain out system are mostly doctors from hospital but not statistical experts. So how to build a friendly, efficient and easy-to-understand user interface become very important. The quality of those interfaces are one of the most decisive factors determining the effect of CDSS on care and patient safety by influencing the adoption rate and routine used by clinicians [21].
Fig 5 PAIN-OUT online outcomes report [26]
Before to design a CDSS system, there are several things should be cleared first [20]: The primary need, the problem or the target area of care for which the CDSS is
being considered. (What kind of problem this CDSS is going to solve? Which specific clinic area is the target area?)
How much control the user can have in the information accessing and responding? CDSS systems can be very different in how much control the user has over the decision to use CDSS. These decisions involve whether the CDSS is set up to be displayed on demand, so that users have full control over whether they choose to access it. Also it needs to be cleared under which circumstances users can, after viewing the CDSS information, choose whether to accept it.
The key question in designing and selecting CDSS systems are whose decisions are being supported, what information is presented, when it is presented, and how it is presented to the user.
22
4 Method
This chapter is going to depict the methodology for this thesis, and estimate the risk and mistake may happen in the later work. Also this chapter needs to clear the scope of the work, declare where the limitation is.
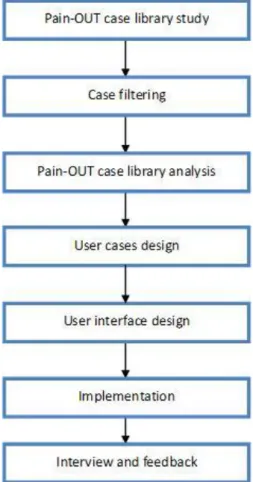
Fig 6 Thesis working flow chart
4.1 PAIN-OUT study
Before the design, the first thing to do is familiar with the PAIN-OUT current system, to learn how the system work and what is the system structure looks like. It can offer a big help in the design work. The current online interface is mainly facing to the researchers; combine it with the different need between researcher and surgeons, the design requirements for this thesis can be found.
4.2 Case filtering
mounting. Not all of them need to be included into the next step. Filtering the cases can more than saving the calculation time, it can avoid unnecessary problem caused by the format or different case version. There are two versions of the questionnaire form. There some cases using the old version questionnaire’s format and others are in the new format. Some attributes are newly added into the case library, so they only exist in the new questionnaire. To avoid some problems that may happen by the different format and attributes not found, are those data using in the later chapter are all belong to the new questionnaire form. Another preparation before study the case base is to remove some incomplete cases. In some cases, the doctor leaves some places blank because of some reasons, e.g. didn’t record the information. To enhance the quality of data studying, we pick out some cases, which contain the whole information. After the case filtering, there are around 4,000 cases will be used in the further work.
4.3 Data analysis
Next step is to observe those cases from the PAIN-OUT cases library. To find out how they saving every case in the case library, is there any pattern hiding behind the huge data. The statistics and analysis on those data can be helpful in deciding the input and output of the system. Here most of the researching work about PAIN-OUT case library is done by Matlab.
One thing has to be declared first is that, all the data analyzing is only base on those samples, the error between the sample group and the cases library exists. So those results can be treated as a reference while we talk about this thesis, but their reliability remains to be verified. The meaning of the existence of this part is to understand the case library better and offer proper support for further work for this thesis, but this cannot be used as medical evidence. Because the data distribution result may change with the method for filtering the samples from case library.
4.4 Use cases design
The meaning of design the use case is to define the functionality of the system, to locate user’s need and preferences. Use case design is based on two basic criteria: what the doctor cares about and what the PAIN-OUT is available to offer. Physicians have patients’ information and medical history, and what surgical procedures patients would take. They want to have a user friendly and easily handle online system, to give them a simple and clear report about what others do under the similar situation, and how the outcomes may look like. PAIN-OUT can offer a huge case library with a wide range of features inside, and the size of the case library is keeping increasing.
24 The use cases should be able to show answers of following questions:
Which features are needed in this system? And which of those features can be control by the users, which of them can only be touched by the system.
The limitation of system’s functionality. Which functions are too complicated for those people don’t have the computer science knowledge background? They should hiding behind the interface.
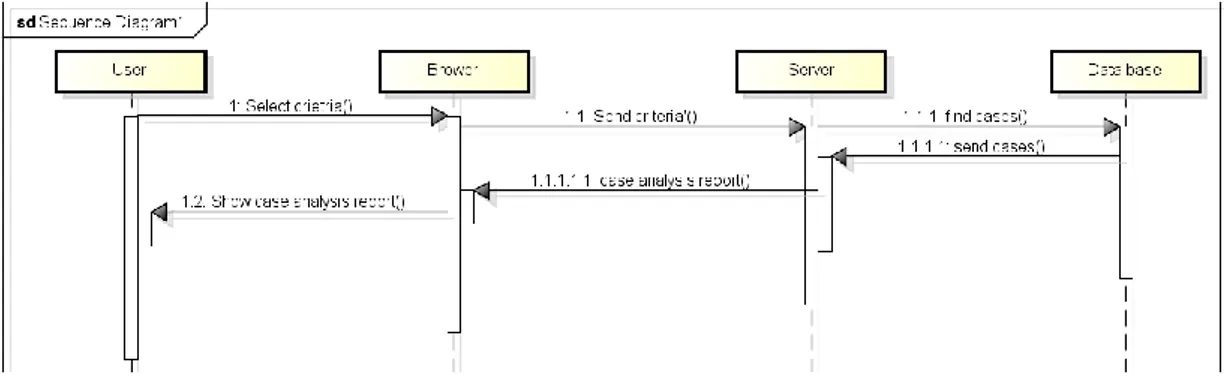
How many interfaces this system needs, and how them link to each other. The Unified Modeling Language (UML)[53] is a general-purpose modeling language in the field of software engineering, which is designed to provide a standard way to visualize the design of a system. The Unified Modeling Language (UML) offers a way to visualize a system's architectural blueprints in a diagram. Here the sequence diagram from UML (Fig 7) is used to build the use case diagrams.
Fig 7 Sequence diagram for use case two
4.5 Interface design
Base on the understanding of PAIN-OUT system and the requirements from the user, the interface design can be triggered. The ultimate goal for this thesis is to implement the design into PAIN-OUT current online system in the future, so the interface design is developed as webpage prototypes. Balsamiq Mockups [40] is a rapid wire framing tool which can build a rapid prototype in the software engineer. It can be used to draw an interface sketch for user interaction. Once the costumers like the design, it can be treated as the HTML’s prototype.
Interface design is the most critical part in this paper. It should follow the UI design n rules and meets user’s need at the same time. To achieve a good design, it requires a combination of the all those conclusions from the previous chapters. The final design of this thesis should meet following requirements:
The UI should provide a support for user to understand the surgery outcomes' distribution. So the physicians and patients can be ready before the operation.
The UI should help the user to check the medication's common arrangements for less pain treatment and their effect for one specific patient group.
The UI should help young inexperienced surgeons to quickly familiar with their job.
The UI should allow the physician to see patterns in different pain levels and other measures of response to treatment between different patient groups.
Fig 8 Interface design with Balsamiq
4.6 Implementation
At the present stage, the design implementation is achieved by Matlab GUI. A graphical user interface (GUI) is a graphical display in one or more windows containing controls, called components that enable a user to perform interactive tasks. GUIs created using MATLAB tools can also perform any type of computation, read and write data files, communicate with other GUIs, and display data as tables or as plots [41].
26 Fig 9 Implementation by Matlab GUI
4.7 Interview
Only the users know what they really need and want, so their feedback is the mostly directly suggestions for the interface design. A video will tell them how the interface runs and explain what very section means in the design. Then they will answer the question on the questionnaire form (Appendix B), to help us improve thesis work.
5 Data analysis
After the reference study and PAIN-OUT project learning. Next step is to decide which attributes can be used as the input of the Pain–OUT interface. This should be considered in two ways: first is what information a doctor will have before design the treatments program? The second question is which groups have difference in the outcomes? To find out the answer for the second question, an in-depth study into the data base is necessary.
A decision support system should find relevant information for physicians based on the available data. This chapter just reasons and gives some non-validated examples indication that there is relevant information in the data that are of interest to show physicians. The data used here is not validated and not the online data in Pain Out so from a clinical point of few this chapter has any relevant. But it is an indication that there is relevant information enabling improved individualized patient care with such a tool. Which information to find in the data also needs to be discussed more with physicians (see future work chapter).
5.1 Data format in Matlab
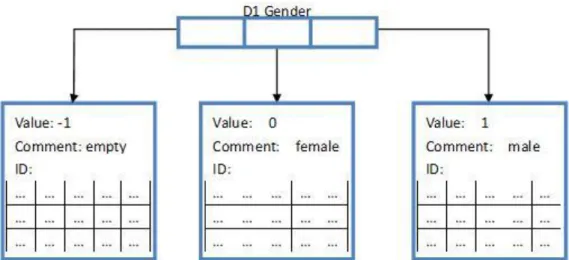
To go through every case in a fast way, and be ready for the forward data processing, the cases library from My SQL was be downloaded and transferred into Matlab. SQL cases library can be directly downloaded as excl tables, then Matlab can input them as several huge matrixes. A quickly method to get the details for every attributes can be very helpful in later working. So here every attributes are save as a row of structures. The length of one structure row depends on how many different values this attributes may get. Every structure has three elements: the value, all the case IDs meets this value and a comment if it is necessary. Here using the feature “D1 Gender” in Fig 10 as an example. From the questionnaire form, there are three possible input, the patient is a male, the patient is a female or doctor left with item blank. And there also 3 different value (1, 0 and -1) corresponding to the questionnaire form.
28 Fig 10 Date structure example
5.2 Data distribution
A big part of the outcomes is the pain record during postoperative. Here using the attribute “Maximum pain” as an example, to show how the PAIN-OUT income impacts on the outcomes on the statistics level. The severe pain is the pain between 7 and 10; mild pain is between 3 and 6; and almost no pain between 0 and 2.
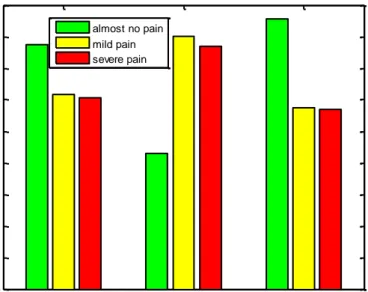
Among the samples (in Fig 11 and Table 2), most of them almost get no pain after the surgery (38.79%), one third of the samples experience severe pain and rest of them experiences the moderate pain. For those samples with co-morbidities (such as hypertension, affective illnesses, problems with alcohol or smoking, etc) are more prone to experience severe pain than the ones with no co-morbidities. The difference in percentages is as high as 10%:
Table 2 Pain distribution
No. of cases Almost no pain mild pain severe pain
All 4718 38.79% 30.87% 30.39% with co-morbidities 2645 21.54% 40.04% 38.45% with no co-morbidities 2073 42.89% 28.69% 28.43%
Fig 11 Worst postoperative pain distribution difference in co-morbidities
When go inside to check how the co-morbidities affect the effectiveness of post- operative treatment, the statistical data is in the next table. Asthma sample group has a higher severe pain percentage than smoking sample group. Actually those two groups own the highest severe pain percentage in the table. Compare with other item in the table, the “No co-morbidity” group has lower percentage in experiencing the severe postoperative pain.
Table 3 Co-morbidities distribution
Comorbidity No. of cases severe pain mild pain almost no pain
No comorbidity 2073 28.43% 28.69% 42.89% Hypertension 1348 38.50% 41.03% 23.18% Coronary 299 34.99% 42.06% 22.94% Smoker 497 41.85% 38.11% 20.04% Asthma 143 52.16% 35.66% 12.17% Alcohol 57 29.82% 49.13% 21.06% Affective 199 48.02% 35.68% 16.29%
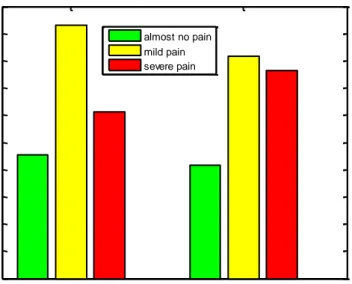
There are 191 male samples and 2798 female samples here. From Table 4and Fig 12, we can find out that female samples suffer more in severe pain and male samples got more record on mild pain.
Table 4 gender distribution
No. of cases almost no pain mild pain severe pain
Male 1919 22.75% 46.53% 30.7%
Female 2798 20.9% 40.81% 38.26%
All Co-morbisities No Co-morbidities 0 0.05 0.1 0.15 0.2 0.25 0.3 0.35 0.4 0.45 Co-morbidities vs No Co-morbidities almost no pain mild pain severe pain
30 Fig 12 Worst postoperative pain distribution difference in gender
Weight is an important index to the anesthetist, which can be helpful in calculating the amount of anesthetic. Most of the patients in the case library are among 50kg ~ 110kg. If only talk about the samples, it seems like samples have heavier weight are exposed to slight more pain than others.
Table 5 age distribution
Weight (kg) No. of cases almost no pain mild pain severe pain
40~54 493 21.1% 44.96% 33.93% 55~68 128 21.65% 43.22% 34.67% 69~82 1590 23.05% 43.95% 33% 83~96 923 22.25% 42.27% 35.44% 97~110 358 19.1% 43.82% 37.07% 111~124 114 14.8% 41.44% 43.76% 125~138 52 17.79% 34.62% 47.6% 139~152 23 16.48% 48.35% 35.16% 153~166 144 24.39% 34.15% 41.46% 167~180 7 22.22% 33.33% 22.22%
The height sample group one “133 cm ~ 137 cm” only get 1 case, it is not enough to be analyzed. The percentage of pain level 0~2 is increasing smoothly with samples groups’ height value. The changing curves of moderate pain and severe pain with the height are the opposite.
Table 6 height distribution
Height No. of cases almost no pain mild pain severe pain
133~137 1 0% 0% 100% 138~144 12 21.43% 45.23% 33.33% 145~151 145 25.17% 38.65% 36.18% 152~158 569 21.3% 40.3% 38.4% Male Female 0 0.05 0.1 0.15 0.2 0.25 0.3 0.35 0.4 0.45 0.5 Gender almost no pain mild pain severe pain
159~165 1321 22.16% 41.56% 36.27% 166~172 1202 22.58% 43.35% 34.07% 173~179 790 21.48% 45.7% 32.82% 180~186 539 19.81% 47.52% 32.67% 187~193 107 19.23% 42.71% 38.06% 194~200 29 19.05% 41.9% 39.05%
Here the anesthesia is only about the anesthesia during the operation. Next three tables show the samples’ anesthesia distribution. The difference outcome between two anesthesia ways is slightly. Exclude three kinds of regional anesthesia (femoral, par vertebral, and sciatic) which don’t get enough samples to analyzed. General anesthesia sample group gets higher percentage with moderate pain, while samples from regional anesthesia group are more exposed to severe pain.
Table 7 Anesthesia distribution
Anesthesia No. of cases almost no pain mild pain severe pain
General 4259 21.88% 43.95% 34.17%
Regional 431 22.25% 42.13% 35.61%
Table 8 General anesthesia distribution
GA No. of cases almost no pain mild pain severe pain
General 4259 21.88% 43.95% 34.17%
Inhalational 3315 22.34% 43.53% 34.14%
IV 2703 21.84% 44.2% 33.96%
Table 9 Regional anesthesia distribution
RA No. of cases almost no pain mild pain severe pain
Regional 431 22.25% 42.13% 35.61% Brachial plexus 35 25.34% 42.71% 31.94% Epidural 40 20.25% 44.42% 35.33% Femoral 9 22.22% 55.55% 22.22% Paravertebral 4 50% 50% 0% Sciatic 4 25% 75% 0% Spinal 293 22.31% 40.47% 38.05%
After the analysis for the data distribution and the study from other relative reference about postoperative, the input and output of the CDSS system can be decided.
Input: age, gender, weight, height, anesthesia method, surgical procedures’ name, co-morbidities.
32
5.3 The correlation coefficient
Pearson product-moment correlation coefficient[38] is a measure of the linear correlation (dependence) between two variables a and b, giving a value x (x∈{-1,1}). If x’s value is 1, then is total positive correlation; 0 stands for no correlation and −1 is total negative correlation. It is widely used in the sciences as a measure of the degree of linear dependence between two variables. It was developed by Karl Pearson from a related idea introduced by Francis Galton in the 1880s.
Pearson's correlation coefficient between two variables is defined as the covariance of the two variables divided by the product of their standard deviations. The following function defines the population correlation coefficient:
Where, cov is the covariance, is the standard deviation of x, is the mean of x, and E is the expectation.
The sample correlation coefficient, which usually represented by the letter r, can be obtained by substituting estimates of the covariance and variances based on a sample into the formula above. That formula for r is:
Where and is the sample mean. Fig 13 shows the Examples of scatter diagrams with different values of correlation coefficient (p).
Fig 13 correlation coefficient [38]
each measurement point and adjustment point. {R, P} = corrcoef(X, Y)
R is an upper triangular matrix of correlation coefficients calculated from two vectors X and Y. P is also a matrix returning p values, is for testing the hypothesis of no correlation.
Correlation coefficient is often used in some CBR system, to find out the relationship between two different features. For this thesis, correlation coefficient algorithm is also includes in the preparations for interface design. It not only can calculate correlation between inputs and outcomes, but also can calculate the correlation between two different operations, co-morbidities, medicine or postoperative side effect. Correlation coefficients can help to setting a better stagey in case retrieving, to make the system designer find a better case matching algorithm.
Like in the data distribution chapter, this is only for offer temporary support for the interface developing; all those data here is collecting from some samples in the case library. For an advanced CDSS system, Pearson's correlation coefficient is not able
to meet the requirements. Because for PAIN-OUT, the reason how a change of one
attributes may change the outcomes is extremely rigorous. In the future work, all those correlations should be defined by senior experts from PAIN–OUT.
Fig 14 Correlation coefficient result for feature M6
After calling the corrcoef function, Matlab can output the result to excel; and excel will mark out those elements with pretty high or pretty low. Fig 14 shows one result for the non-opioids medicine patients take during the operation. Next table picks some attributes in the medication data base, which have high correlation with each other.
Table 10 Attributes with high correlation coefficient
Attributes one Attributes two correlation coefficient
PRE_NOPIO_GBPNTN_PO PRE_NOPIO_CELCXB_PO 0.779342625809437 PRE_NOPIO_PRCTML_PO PRE_NOPIO_PRCTML_IV -0.508193142623904
'PRE_NOPIO_PRCTML_IV PRE_NOPIO_METMZL_IV 0.626700594865646
34 PRE_OPIO_MRPHN_SC PRE_OPIO_FNTNYL_CR 0.848871180108155 IO_NOPIO_PRCTML_IM IO_NOPIO_KETPRFN_IM 0.706602964392132 IO_NOPIO_PRCTML_IM IO_NOPIO_METMZL_IM 0.706602964392134 IO_NOPIO_KETPRFN_IM IO_NOPIO_PRCTML_IM 0.706602964392132 RR_OPIOLANAE_TILDN_IR RR_OPIOLANAE_OXYCOD_WN_IR 0.999999999999993 W_OPIOLANAE_HYDRMRPH_IR W_OPIOLANAE_HYDRMRPH_CR 0.612346501025057
Furthermore, for some attributes have variety of value, e.g. features about pain level and side effect, they usually have 12 different values (from -1 to 10). In-depth study can be achieved by plot out the details for correlation. Fig 15 shows the correlation between the maximum postoperative pain and the minimum postoperative pain a patient experienced. From high frequency to low frequency from the data base, the color on the chart will change following black - red - blue – cyan – green – magenta – yellow – white. The point (x,y) shows how many times maximum pain level equal to x and minimum pain level 2 equal to y appear in the same case. More times it happens, a higher frequency the point (x,y) has.
Fig 15 correlation diagram 0 1 2 3 4 5 6 7 8 9 10 11 0 1 2 3 4 5 6 7 8 9 10 11 O MAXPAIN O M IN P A IN
6 Result
6.1 Use case design
Use case is a good method to find out what functions a product should carry out when it finally facing the customer. Depending on the previous studies about the PAIN-OUT project and CBR system, several use cases are built to clear the design details for the PAIN-OUT interface in this thesis.
Here 8 basic use cases:
1) A doctor has one patient, who is a smoker, and this patient is going to take a total hip replacement. Doctor wants to know, while other conditions remain unchanged, the outcomes different between smoker and non-smoker. System should find out the n most similar cases and produce the analysis report to the doctor.
2) A doctor has a patient:
Age: 42 Gender: Male
Weight: 70 kg Height: 185 cm
This patient is going to take a total hip replacement. Doctor wants to know the outcomes from those most similar cases in the case library. The system should find out n case nearest to this patient, and show doctor the outcomes analysis. 3) A young inexperienced doctor has one patient; he wants to know what other
senior surgeons usually would do. He put the patient’s information into system, system will find out nearest n cases and analysis the outcomes and medication. 4) A doctor wants to check the outcomes of patients have the total hip
replacement, but he doesn’t remember the ICD9 code for this surgery. System should open an ICD9 search engine to help him.
5) Doctor already got an outcomes analysis and medication analysis. Doctor wants to go into the case list, choose one or two cases and have a closer look. System should open a page to show the case list, ranking by the similarity. And another page to show on specific page.
6) Doctor has one patient who is going to take a revision of joint replacement of upper extremity. Doctor wants to know the outcomes. Find out n case nearest to this patient, and show doctor the outcomes analysis. But there are only 3 cases can be found from the case library. System should still give the analysis report, but at the same time, it should warm the user there is not enough to produce a good report.
36 7) Doctor has one patient who is going to take a replacement or repair of other implantable component of (total) replacement heart system. (This surgery procedure code is in the ICD9 standard, but not in the PAIN-OUT database.) Doctor wants to know the outcomes. There are no case meets the criteria, so the browser should still stay in the search page, and tell the user that he should try to change the search criteria.
8) Doctor already got an outcomes reports base on 50 cases from the case library, but he thinks 50 may not enough to get a good statistical report. He wants to get more cases. System should expend the currently search criteria and return a new report base on more cases.
6.2 Interface design
Use cases’ setting decides the structure of the CDSS interface (Fig 16); at least seven parts should be designed:
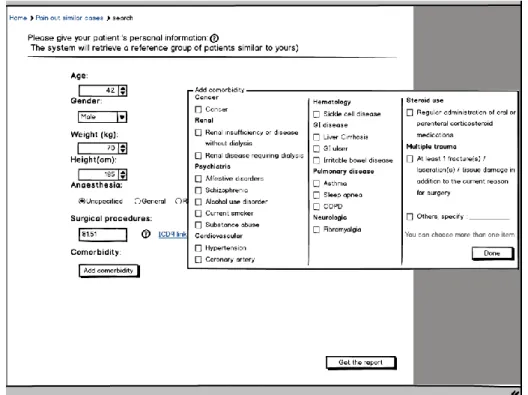
Start page (as shown in Fig 17): in this page surgeon input the patient’s information (age, gender, weight, height, anesthesia method, surgical procedures name and co-morbidities.) into the system.
Surgical procedures code search engine (as shown in Fig 20): in the PAIN-OUT case library, using icd9 code instead of operations’ name to record the surgical procedures. A search engine is needed to help some users who are not so familiar with the ICD 9 code. The International Statistical Classification of Diseases and Related Health Problems, usually called by the short-form name International Classification of Diseases (ICD), is the international "standard diagnostic tool for epidemiology, health management and clinical purposes" [39]. The ICD is designed as a health care classification system, providing a system of diagnostic codes for classifying diseases, including nuanced classifications of a wide variety of signs, symptoms, abnormal findings, complaints, social circumstances, and external causes of injury or disease. This system is designed to map health conditions to corresponding generic categories together with specific variations, assigning for these a designated code, up to six characters long. Thus, major categories are designed to include a set of similar diseases. ICD9 is the Ninth Revision of the International Classification of Diseases, convened by World Health Organization (WHO), in Geneva from 30 September to 6 October 1975.
Generate the Statistical Report: combine with the input, system should find out the n nearest cases from the case library, and generate a statistical report. User will not know how this process works; the report will be shown in several pages. Outcomes report page (as shown in Fig 22 and Fig 23): show the postoperative
pain and side effect report.
Medication report page (as shown in Fig 27): show the medication report before and during surgical procedure, in the recovery room and in the ward.
current report, the list should be sorted by similarity. And the questionnaire form for every single case.
Outcomes comparison (as shown in Fig 24): compare the current report with bigger group. For example, while other conditions keep remain, comparing a report from a smoker with a report from a patient without smoking habit.
Fig 16 structure of the CDSS interface
PAIN-OUT is an online system; the statistical system in [16] is also implemented into webpage. The interface design in the thesis is also for the purpose of the implemented into webpage in the future. In the present stage, the UI is designed in Balsamiq and implemented by Matlab GUI.
6.2.1
Start page
The start page, which is shown in Fig 17, is to input the patient’s information. User will read question one by one on the web page, but their patience is not endless. So only necessary question should be asked and provide sensible defaults for every question.
The page is using top-aligned Labels, so the user will fill in the form from the top and will not be disturbed. Of the three label alignment options (top aligned, left aligned and right aligned), top aligned labels tend to reduce form completion times the most. Because labels and input fields are in close proximity, processing them requires little effort. Getting through the entire form is also quick and easy because people generally only need to move in one direction: down. That makes a very clear path to completion [24]. Another advantage of top-aligned labels is that they provide a lot of horizontal space for grouping related input fields in a variety of ways.
38 Fig 17 start page
In order to ensure the unity and neat of the page, the first four entries are all represented by pull-down menu [23]. To ensure user know where they are and where they can go. Eliminate unnecessary fields and minimize the number of pages and steps. Help icons and navigation can be seen in every page. The link next to the surgical procedures edit text is lead to the ICD 9 code search engine, to help the user find the corresponding surgery code.
Under the consideration of conciseness, co-morbidity sub window (as shown in Fig 18) is invisible by default. And the multi check boxes from in the sub page are arranged into three columns. The sub titles in the co-morbidity sub window can help the user to locate the item he wants faster.
Fig 18 start page with co-morbidities sub window
User’s choice in the co-morbidity sub window will synchronous show in the empty space in the bottom of the page. Even user close the sub window, he would not confuse. If the patient’s situation is too rare to find some similar cases from the case library, system will suggest user to remove some input (right bottom corner in the page), like delete the co-morbidities or the height.
40
6.2.2
ICD9 Surgical procedures code search engine
ICD9 search engine is to help the doctors find the correct icd9 code for one surgical procedure. Doctor type in the operation’s name in the search box, the result will be represented in tabular form (as shown in Fig 20). Move the mouse on one item in the table, more details about this surgical procedure can be seen at the bottom of the page.
Fig 20 ICD9 search engine
If the searching engine cannot find any relative ICD9 procedure name, it should return a warming message to let the use try another key word to search.
6.2.3
Outcomes report page
Avoid overwhelming the user with information, there will not be too many elements on the same page. While the window is first open, user’s attention will be paid in the middle part of the page. So the outcomes report diagram is arranged in the middle. The color of the bar chart is connected to the pain and side effect level (can be seen in Fig 22). Here it uses the trichromatic [40] (red, yellow and green) to color the diagram. Green stands for almost no pain or side effect (level 0~2), green is the symbol of vitality and has a calming effect. Yellow is the color for moderate pain and side effect (level 3~6), which is considered as the most energizing color, usually being associated with the sun, with happiness and warmth. Bright yellow is the easiest color to get other’s attention. Severe outcomes are marked by red color. Red is traditionally associated with passion, being a stimulating and exciting color. It is used for showing danger or warning, and it could also suggest determination, boldness, and strength.
Sub title of the diagram tells the user there are how many cases in the report. User can increase or decrease the number of the cases by clicking the last two buttons next to the diagram. First two buttons “Check case details” and “Show medication” can lead the user to other part of the report. Button “Refine searching” bring the user back to the start page.
Fig 22 Outcomes report page
There are two panels on the left side of the window: “Criteria Range” (Fig 23.a) and “Outcomes Filtering” (Fig 23.b). The former one is to show the criteria range, it is centered at the patient’s personal situation, expanding until the system find enough cases from the case library. “Comparison Group” panel (Fig 23.c) is a radio buttons group, it can let user only focus on one specific group of outcomes, and filter out the distracters. For example, physician wants to check the painless outcomes, he choose the “Only the Worst Pain 0~2” radio button, then report will find out all those cases
42 with almost no postoperative pain while all other conditions remain unchanged.
(a) Criteria Range (b) Outcomes filtering (c) Comparison group Fig 23 Outcomes report page (details)
6.2.4
Outcomes report comparison page
On the right side of the page, is the radio buttons panel for the report comparison. It offer another outcomes report base on a bigger case group; to allow the user to observe the difference of outcomes under different criteria range. This function is exactly the use case No. 1. After user chooses one item in the radio buttons group panel, the window layout in the middle part of the window will show corresponding change, like Fig 24.
In use case No.1, the user already hold a report about a smoking patient, he want to know what non-smokers may feel after the same surgery. So he click the “No co-morbidity group” radio button from the panel, one more diagram will appear, the new one is a bar chart from no co-morbidity cases while other conditions remain unchanged (the criteria range about age, gender, weight and others are unchanged).
6.2.5
Medication report page
Medication report shows the drug usage statistics, it shows which medicine is more frequently used under given situation, like in Fig 25. In the PAIN-OUT questionnaire from, there are five part include medicine relative question, they are: medical history, pre-medication, intra-operative, recovery room and ward. To limit the information on the window at the same time, a tabs bar is used to divide the medication report into five different tabs (Fig 27).
In the questionnaire form, because of different intake method of drug, every medicine has more than one attributes in the data base (part of questionnaire form can be seen in Fig 25). To make the data easier to understand, at the first window every table in the tab only shows only the frequency of every medicine (Fig 27). Move the cursor on the medicine’s name, sub window will appear and offer more information (at the bottom of the page Fig 27). Medicine in each table should be sorted by the frequency.
Fig 25 questionnaire form in M9
44
Fig 27 Medications report page
6.2.6
Case details information page
To step further, single case report page is to help the user to check those cases have the highest similarity. Every part of the questionnaire form is arranged in one tab, so the user would not feel confusion by receiving too much information at the same time, see the Fig 28. There are two rows on every page, left row shows the name of every feature and right row writes the value. Both of them are left-aligned. Left-aligning field labels make scanning the information required by a form easier. People can simply inspect the left column of labels up and down without being interrupted by input fields [24]. Left-aligned labels also have the advantage of requiring less vertical screen space than top aligned forms.
Fig 28 Single case page
6.3 Interview and feedback
Fig 29 Interview video screenshot
![Fig 2 Cases clustering algorithm [35]](https://thumb-eu.123doks.com/thumbv2/5dokorg/4928903.135677/16.892.137.759.873.1088/fig-cases-clustering-algorithm.webp)