J
Ö N K Ö P I N GI
N T E R N A T I O N A LB
U S I N E S SS
C H O O L JÖNKÖPING UNIVERSITYS t o c k S c r e e n i n g a n d S u p e r i o r R e t u r n s
An Assessment of the Presence of Financial Market Anomalies on the
Stockholm Stock Exchange
Bachelor Thesis in Finance Authors: Karabelas, Nikolaos
Moshovitis, Alexander Tutor: Österlund, Urban Jönköping December 2009
Author’s Acknowledgements
First and foremost we would like to thank our tutor Urban Österlund for his con-structive criticism and feedback. Moreover, we feel great gratitude towards our fellow students for their aid and support throughout the course of this semester. Finally, we would like to mention our parents for all their love and support.
Bachelor Thesis within Business Administration
Title: Stock Screening and Superior Returns: An Assessment of the Presence of Financial Market Anomalies on the Stock-holm Stock Exchange.
Authors: Karabelas, Nikolaos
Moshovitis, Alexander
Tutor: Österlund, Urban
Subject terms: Stock screening, market anomalies, efficient market hy-pothesis, abnormal returns.
Abstract
Problem: Given the findings of anomalistic behavior presented to date, mainly on the large American stock exchanges, it is in the authors‟ interest to study whether similar patterns can be identified on the Stockholm Stock Ex-change. In order to arrive at this understanding, we first intend to assess whether the market can be outperformed on an absolute basis and subse-quently on a risk adjusted basis, over some longer time period. It is of further interest to assess the degree of market efficiency on the Stock-holm Stock Exchange by accounting for transaction costs and taxes.
Purpose: The purpose of this thesis is to assess whether abnormal returns, net of transaction costs and taxes, could have been earned on the Stockholm Stock Exchange during the first nine-year period of the 21st century, us-ing a screenus-ing method in portfolio construction based on market capi-talizations and P/E ratios.
Method: For the purpose of this thesis, quantitative data is used in order to reach the desired level of concreteness in the results. Firstly, all stocks on the Stockholm Stock Exchange are ranked on the basis of firm size and P/E ratio. Subsequently, the list of firms and their corresponding scores for the specific year is re-sorted with respect to total score and the 20 highest ranked firms are selected for inclusion in the portfolio. Annual returns between 2000 and 2009 are then calculated and compared against the AFGX and OMXSB Index. Thereafter, the portfolio returns are risk ad-justed using three performance metrics and lastly transaction costs and taxes are accounted for in order to answer the purpose.
Conclusion: On the basis of the study presented in this thesis, we can conclude that,
over the period 2000-2009, it would have been possible to fairly consis-tently generate returns in excess of the market. Moreover, these returns
plain the entire difference in them. Finally, by adjusting the returns for transaction costs and taxes, we still found that the portfolio performed better than the market. In other words, we reach the conclusion that it would have been possible to earn abnormal returns, net of transaction costs and taxes, on the Stockholm Stock Exchange during the first nine-year period of the 21st century, using a screening model in portfolio con-struction based on market capitalizations and P/E ratios.
Definitions
Below follows a list of definitions of terms as they are interpreted within the scope of this thesis. If a definition of a term has been given as the term appears in subsequent parts of this thesis, it has not been included in this list.
Abnormal return = The component of the return that is not due to systematic influences (market-wide influences). In other words, ab-normal returns are above those predicted by the market movement alone (Harvey, Campbell R., 2003).
CAPM = An economic theory that describes the relationship be-tween risk and expected return, and serves as a model for the pricing of risky securities. The CAPM asserts that the only risk that is priced by rational investors is systematic risk, because that risk cannot be eliminated by diversifica-tion. The CAPM says that the expected return of a securi-ty or a portfolio is equal to the rate on a risk-free securisecuri-ty plus a risk premium multiplied by the assets systematic risk (Harvey, Campbell R., 2003).
Excess return = An Excess Return is defined as the return in excess of a comparable benchmark. The benchmark can be a single associated index series or a composite of a group of port-folio index series based on security and time-dependent portfolio assignments (CRSP, n.d.).
Transaction costs = The sum of the bid/ask spread and the commission fee le-vied when buying and selling a security (Stoll & Whaley, 1983).
Bid/Ask spread = The difference between the bid and the asked prices (Har-vey, Campbell R., 2003).
Market capitalization = Computed as shares times current market price. Capitali-zation is a measure of corporate size (Harvey, Campbell R., 2003).
Table of Contents
1 Introduction ... 1
1.1 Background ... 1 1.2 Problem ... 2 1.3 Purpose ... 3 1.4 Delimitations ... 3 1.5 Methodological Approach ... 4 1.6 Disposition ... 52 Theoretical Framework ... 6
2.1 The Random Walk Hypothesis ... 6
2.2 The Efficient Market Hypothesis ... 7
2.2.1 Criticism against the EMH ... 8
2.2.2 Misconceptions surrounding the EMH ... 10
2.2.3 Common Pitfalls with EMH studies ... 11
2.3 Market Anomalies ... 11
2.3.1 Alternative Theory 1 - Investor Irrationality ... 12
2.3.2 Alternative Theory 2 - Incomplete Information ... 13
2.4 Previous Findings ... 14
2.4.1 Price/Earnings Effect ... 14
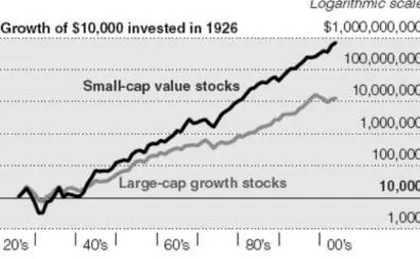
2.4.2 Small-Firm Effect ... 15
2.4.3 Combining and Comparing the Two ... 16
2.5 Risk-Adjusted Performance Metrics ... 19
2.5.1 The Sharpe Ratio ... 19
2.5.2 Jensen's Alpha ... 20
2.5.3 The Treynor Ratio... 21
2.5.4 Drawbacks ... 21
2.6 Stockholm Stock Exchange ... 23
2.6.1 Market Indices ... 24
2.6.2 AFGX ... 24
2.6.3 OMXSB GI ... 24
2.7 Risk and Diversification ... 24
2.8 Transaction Costs and Taxes ... 25
3 Method ... 26
3.1 Data Collection ... 26
3.2 Portfolio Construction ... 27
3.3 Specific Events and Dividends ... 28
3.4 Measuring Performance ... 29
3.5 Transaction Costs and Taxes ... 30
4 Empirical Findings and Analysis ... 32
4.3 Risk-Adjusted Returns ... 36
4.4 Raw Returns Adjusted for Transaction Costs and Taxes ... 39
4.5 Risk-Adjusted Returns Net of Transaction Costs and Taxes ... 40
5 Conclusions ... 42
6 Authors Reflections & Further Research... 44
6.1 Investment Horizon ... 44 6.2 Screening Model... 44
References ... 45
Appendices ... 51
Appendix I ... 51 Appendix II ... 601 Introduction
1.1 Background
As stock markets around the world have emerged and developed, so has the interest in them. Investors in stock markets have been increasingly interested in trying to under-stand the future that lies ahead, and how this uncertainty can be controlled through vari-ous ways of structuring, processing and interpreting the information available. Of inter-est is therefore consequently if the possibility of earning excessive returns in reality ex-ists, or if the examples of this achievement shall be assigned to pure luck. Findings strengthening the case of those supporting the belief that the market can be beaten on a consistent basis are those suggesting the recurring phenomenon of anomalies in finan-cial markets. For instance, studies based on certain stock characteristics such as market capitalization and the price earnings ratio have found that stocks with a certain set of characteristics generate larger returns than the average stock.
In 2005, an article regarding the performance of small cap stocks in relation to large cap stocks was posted in The New York Times (Hulbert, 2005).
Findings such as this, presented by Eugene S. Fama and Kenneth R. French, make it dif-ficult to argue for market efficiency. But since researchers do not completely agree on the cause, there are some who argue that the outperformance is justified and conse-quently conclude that capital markets are efficient.
Further strengthening the case of market inefficiency is the performance of several well known investors, who, on a consistent basis, have outperformed the market. One such example is Berkshire Hathaway owner Warren Buffett who generated an annual average return of 20.3% between 1965 and 2008 (Berkshire Hathaway, 2009).
Market anomalies and real life examples like the one above, have for a long time fuelled an intense debate regarding the possibility to consistently earn abnormal returns. Since generating abnormal returns is the goal of any investor it is no wonder that this debate lies at the core of the financial society and attracts huge interest.
1.2 Problem
Given the findings of anomalistic behavior presented to date, mainly on the large Amer-ican stock exchanges, it is in the authors‟ interest to study whether similar patterns can be identified on the Stockholm Stock Exchange. In order to arrive at this understanding, we first intend to assess whether the market can be outperformed on an absolute basis over some longer time period.
Can a screening model based on previously identified market anomalies be
applied on the Swedish stock market to earn returns in excess of those gen-erated by the market?
Given that evidence of excess returns is found, it is of interest to assess whether they are of an anomalistic nature:
Do these persist when returns are adjusted for risk? What is the effect of
Given that evidence of excess returns is found, it is of further interest to the authors to assess whether actually investing in a portfolio based on such a screening model would result in profits being made:
Is it possible to capitalize on them? What is the effect of transaction costs
and taxes on raw returns?
The ultimate insight sought after is whether it is possible to capitalize on market ineffi-ciencies when risk is accounted for. If this is found, one can infer the degree to which the market is efficient.
Given the possibility of capitalizing on excess returns: can this be explained
by accounting for risk?
1.3 Purpose
The purpose of this thesis is to assess whether abnormal returns, net of transaction costs and taxes, could have been earned on the Stockholm Stock Exchange during the first nine-year period of the 21st century, using a screening method in portfolio construction based on market capitalizations and P/E ratios.
1.4 Delimitations
For the sake of clarification, we would like to emphasize that the study will take the perspective of a small trading firm, thus the tax regulations used will be those applying to firms, and not to private investors. This will primarily affect the treatment of losses.
An asset with a high degree of liquidity is one that can be sold quickly without a signifi-cant price concession (Jordan, Miller & Yüce, 2000). The portfolios constructed will in-clude stocks with small market capitalization and as a result will be less liquid than the average stock on the Stockholm Stock Exchange (Datar, Naik & Radcliffe, 1998). Thus, the investment strategy proposed in this thesis might not be fully executable in practice.
et al. 2000). However the effects of liquidity will not be accounted for in this thesis.
The study will be conducted upon all stocks listed on the Stockholm stock exchange, as emphasized in section 1.3 of this thesis. However, an alternative market, called First North, is a part of the Stockholm stock exchange but is not an EU-regulated market and, consequently, not subject to the same legal requirements (Nasdaq OMX, 2009a). All stocks listed on First North are therefore excluded from the study.
1.5 Methodological Approach
Two main approaches in conducting research exist. The first being the deductive ap-proach, a method of creating a hypothesis based on theory, and ultimately testing the hypothesis according to a predetermined strategy. The approach thus starts by stating a hypothesis based on theory and consequently making observations in order to accept or reject the hypothesis. The inductive approach however, begins with observations that ul-timately lead to the formation of theory. In other words, the inductive approach is a method for reaching broad generalizations and theories from specific observations. The two approaches are not mutually exclusive since a combination of the two, the abduc-tive approach, is possible. This thesis will be conducted using a deducabduc-tive approach, as theories regarding market efficiency and market anomalies will be tested against the empirical findings of the study (Saunders, Lewis & Thornhill, 2003).
The main sources from which academic articles are retrieved are JSTOR and Science Direct, two databases containing large amounts of articles from widely used journals within the fields of finance, economics and statistics.
2 Theoretical Framework
The following section will introduce the reader to topics of special importance to the purpose of this report. In order to assist the reader in following the subsequent study presented, an introduction of the fundamental areas of interest is provided, as well as a review of some of the most important findings presented within these areas.
2.1 The Random Walk Hypothesis
A topic yet to enjoy consensus among investors and academics is the question of predic-tability of future stock movements. The randomness in these movements has been dis-cussed in length by numerous prominent economists, who can be divided into two groups: the proponents of the random walk hypothesis in stock price movements, and the proponents of the non-random walk hypothesis in the movement of these prices. The term random walk, introduced by mathematician and statistician Karl Pearson (1905), was firstly applied to finance by Maurice Kendall, who he argues that “In the series of
prices that are observed at fairly close intervals the random changes from one term to the next are so large as to swamp any systematic effect which may be present”
(Ken-dall, 1953, p. 11). Thus he found no serial correlation over weekly time intervals and suggested that prices seem to follow a random walk. This finding was since its publica-tion by many been followed as a fact, and was subsequently also used as the basis for argumentation in the issue, as well as further supported by later studies conducted by other academics.
However, the opposing group countered this belief by presenting findings pointing to the contrary. Although some earlier papers had rejected the random walk hypothesis, it was not until Andrew W. Lo and A. Craig MacKinlay (1999) published the book “A
non-random walk down Wall Street”, that the non-random walk hypothesis started to
gain credibility. In the book they argue that stock price movements are not completely random, as proven by findings showing the existence of predictability in stock markets.
2.2 The Efficient Market Hypothesis
The efficient market hypothesis (EMH) is a theory developed in 1970 by Professor Eu-gene Fama, stating that all available information is reflected in current share prices. Thus, according to the theory, investors are not able to outperform the market on a con-sistent basis. In addition, he argues that three conditions must be fulfilled for the market to be considered efficient;
There are no transaction costs in trading securities.
All information is available to all market participants at no cost. All investors agree on the implications of current information for the
current price and distribution of future prices of each security.
In such a market, all available information is fully reflected in current security prices. This is however a theoretical concept and does not reflect the markets present in prac-tice.
Simultaneously, Fama (1970) argues that these conditions are not necessarily vital for markets to be efficient in practice. Although seemingly contradictive, he is referring to the degree to which the above stated conditions need to be satisfied. For instance trans-action costs, which limit transtrans-action flows, need not imply that security prices do not fully reflect all available information. Furthermore, markets may still be efficient even though all information is not available to all investors, as long as it is available to a suf-ficient number. Fama (1970) continues to argue that investors need not interpret a given set of information homogenously for the market to be efficient.
The efficient market hypothesis emerged from the findings of French Mathematician Bachelier. In his 1900 disquisition, “The Theory of Speculation”, he argued that the ex-pected profits of a speculator should be zero. However, Bachelier`s research on the be-havior of security prices was ignored for more than fifty years. It was not until 1953, when Maurice Kendall published his above mentioned paper on the random walk hypo-thesis, that Bachelier`s findings started to attract attention. Although previous studies had reached the same conclusion, Kendall had empirical results to support his argu-ments.
Fama (1970) elaborated further on the efficient market hypothesis, arguing that there are three forms of market efficiency: weak form, semi-strong form and strong form effi-ciency.
In weak form efficiency, prices reflect all historical price information. Thus, it is im-possible to constantly earn excess returns by analyzing past price information. Fama (1991) studied daily returns and found positive autocorrelations, however, he argues that they are small and provide no usefulness in predicting future stock movements. Semi-strong form efficiency implies that all public information is reflected in current prices and that the adjustment to news is incorporated rapidly. In a semi-strong efficient capital market, neither technical nor fundamental analysis can be used to produce excess returns on a consistent basis. Fama tested the semi-strong efficiency by studying the ad-justment of security prices to news of stock splits. The idea behind it is to analyze stock prices around split dates to see if any abnormal patterns can be detected. He reached the conclusion that the market is semi-strong form efficient with respect to its ability to ad-just to information implicit in a split.
In a strong-form efficient market, public as well as private information is reflected in current share prices. No one can therefore continuously earn excess returns. Thus, in-vestors do not have access to relevant monopolistic information and, in case they do, it cannot be used to earn excess returns. Michael C. Jensen (1968) studied mutual fund managers‟ performances to determine whether they have access to private information that would generate abnormal returns. He concluded that mutual fund managers are not able to produce returns above the norm, thus presenting important findings backing the three forms of market efficiency put forth two years later by Fama.
2.2.1 Criticism against the EMH
The EMH has received much criticism however, and is by no means a widespread be-lief. A substantial body of research has refuted the EMH, emphasizing the effect of psy-chological and behavioral factors on valuation. Moreover, several economists have chal-lenged the EMH with studies showing that future prices are, to some extent, predictable
phenomena of market anomalies, discussed in a separate section below. Some econo-mists have a more controversial conviction, arguing that the inefficiencies and patterns detected can be exploited to earn risk adjusted abnormal returns. This academically con-troversial belief has laid the foundation for technical analysis, a forecasting technique drawing upon past information to predict future stock prices.
______________________________________________________________________ The more the theory of efficient markets is believed, the less efficient the markets be-come. - George Soros (The Alchemy of Finance, 2003)
______________________________________________________________________
Recent research by Lo and MacKinlay (1999) suggests that serial correlations deviate from zero, especially in the short run, and thus reject the hypothesis that stock price movements are random. Lo, Mamaysky and Wang (2000) arrived at similar findings, using complex non-parametric statistical techniques to identify patterns. They argue that several techniques used in technical analysis, such as head-and-shoulders and double-bottom formations, are helpful in predicting future stock price movements. Those find-ings are in fact consistent with psychological factors that influence investor behavior. As stock prices start rising, individuals not wanting to miss out on profits are drawn in to the market. Shiller (2000) considers the stock market bubble in the late 1990‟s to be a result of cognitive and emotional biases, and consequently rejects the EMH. Moreover, Shleifer and Summers (1990) use the stock market crash of 1987 as evidence of market inefficiency and argue that investors face difficulties in detecting deviations from fun-damental values. In addition, they argue that investors might hold on to stocks they be-lieve are overvalued, waiting for “greater fools” to buy the stocks at higher prices. There is also the effect of investors following positive feedback strategies, that is, each incremental rise in the stock price feed the buying of more investors and subsequently push the prices away from the fundamental value.
Although positive serial correlations are often followed by a mean reversion, investors drive prices away from their fundamental values in the short run (Shleifer & Summers, 1990).
Studies such as Eugene Fama (1998) have shown that even though the stock prices might not respond efficiently to new information, under-reaction occurs as frequently as over-reaction, thus no consistent abnormal returns can be realized. Malkiel (2003) ar-gues that the market anomalies that have been discovered tend to disappear once publi-cized and that no pattern is sufficiently robust so as to generate excessive returns. Moreover, Malkiel does not consider the stock market bubble in early 2000 to be a sign of market inefficiency, as he argues that no arbitrage opportunities existed since there was no way of telling when the bubble would burst.
There is no clear-cut line between an efficient and an inefficient market, and few inves-tors believe that the market is efficient at all times. Indeed, the market has made mis-takes, as have been documented in the past, and investors have not been consistently ra-tional. Grossman and Stieglitz (1980) stressed the point that the market cannot be per-fectly efficient because, if it were, there would be no incentive for professional investors to dedicate their entire lives to search for profitable investments.
2.2.2 Misconceptions surrounding the EMH
It is worth noting that some of the criticism and controversy surrounding the EMH is due to misconceptions about what the EMH really implies. A common misconception is that stock prices cannot deviate from their true value in an efficient market. Rather, what the EMH states, is that deviations from true value are random. Moreover, the EMH does not imply that investors cannot beat the market in any given period. In fact, the EMH states that approximately half of all investors will beat the market in any pe-riod. Another misconception is that no group of investors will be able to beat the market on a consistent basis. The point to stress is that no group of investors will outperform the market in the long run due to superior investment strategies and analysis but rather because of pure luck (Damodaran, 2002).
2.2.3 Common Pitfalls with EMH studies
A reason for the controversy regarding the EMH is the number of pitfalls present in several studies. Probably of most importance is that investment strategies are tested on data other than that used to derive the strategy. Using a small or biased sample is anoth-er major pitfall that might distort the results. Furthanoth-ermore, all tests need to be put in re-lation to the overall market performance. Failure to control for risk poses yet another problem as accepting higher risk is associated with a risk premium, and thus will most often appear to outperform low risk investments. An example of this is investing in low P/E stocks and concluding that the P/E ratio itself causes the excess return while, in fact, the low P/E ratio-stocks might be associated with excess risk. Moreover, some invest-ment schemes might seem profitable in theory however, in practice, transaction costs can erode the excess returns and the stock might be illiquid which poses impediments to trading. Lastly, most studies are based on currently listed companies and therefore fail to account for firms that have gone bankrupt, thus biasing the sample toward surviving firms and overstating the returns (Damodaran, 2002).
Note that in conducting the study presented in this thesis, attention is consistently being paid to these pitfalls.
2.3 Market Anomalies
In accordance with the Compact Oxford English Dictionary, an anomaly is “something
that deviates from what is standard or normal” (Oxford University Press, 2009). With
this definition of the word in mind, anomalies in financial markets are viewed as beha-vioral patterns that asset valuation models, such as the Capital asset pricing model (CAPM), fail to capture. However, in order to interpret a behavior as being anomalistic, one is firstly required to specify what is considered to be normal. Put differently, in or-der to say that something deviates from regularity, we have to start by assessing what is regular, and measure our observations against this parameter. In economics, this regu-larity has to a great extent been represented by the rational expectations theory. The theory essentially explains what is rational to expect regarding future outcomes, and re-lies on two strong assumptions. Firstly, an absolute understanding of the fundamentals
of the economy is assumed by investors. This means having an accurate specification of how the economic environment, including the stock market, is structured. Secondly, in-vestors are completely rational in interpreting all the information available to them (Brav, A. & Heaton, J.B., 2002). According to John F. Muth, “…expectations, since
they are informed predictions of future events, are essentially the same as the predic-tions of the relevant economic theory” (Muth, John F., 1961, p.316), i.e. the expected
outcome of the future is the same as the predictions generated using relevant economic models. Hence, the anomalies observed are deviations from what had been predicted, through the use of economic models, to occur.
The observed characteristics said to be underlying abnormal behavior in securities mar-kets do not themselves carry explanatory power as to why it appears. This curiosity, paired with doubts surrounding the extreme nature of the assumptions carrying the ra-tional expectations theory, has spawned an interest in the field, forming two groups of alternative theories.
2.3.1 Alternative Theory 1 – Investor Irrationality
The first group of alternative theories relies on the relaxation of the second assumption, arguing that although a thorough knowledge of the fundamentals of the economy can be assumed, rationality on the part of investors is not a feasible assumption. Instead, psy-chological factors are said to impact investors‟ ability to rationally interpret informa-tion, leading to noise in the decision making process. The reason, in line with the argu-mentation put forward by Thaler (1993), is the sufferance of investors from cognitive biases leading to a way of perceiving information that is not necessarily rational. Consi-dering the fundamental principal in finance of profit maximization, evidence points out that investors are too quick in drawing conclusions when new pieces of information emerge, which is subsequently reflected through unexpected fluctuations in the stock market.
In support of this theory are many interesting papers, proposing evidence of market anomalies related to different aspects of investor psychology.
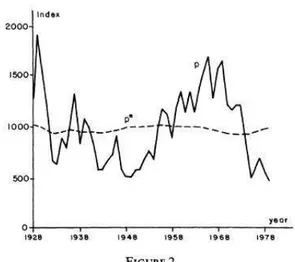
Shiller (1981) finds that real stock market volatility is remarkably higher relative to vo-latility in dividends. His study was based on detrended (adjusted, through discounting, for trends through time) data for the Standard and Poor‟s Composite price index (1871-1979) and the Dow Jones Industrial Average (1928-(1871-1979). The observation is illustrated in figure 2.1 below.
Figure 2.1 Stock market volatility relative to volatility in dividends (Shiller, 1981).
De Bondt and Thaler (1985) showed that portfolios containing looser stocks clearly outperform portfolios with winner stocks, as well as the market in general. The study was based on monthly return data for common stocks on the New York Stock Exchange (NYSE) for the period 1926-1982.
2.3.2 Alternative Theory 2 – Incomplete Information
The second alternative to the rational expectations theory keeps the assumption of in-vestor rationality, but sheds doubt on the assumption of inin-vestors‟ complete knowledge regarding the fundamentals of the economy. The underlying argument for the theory says that anomalies in securities markets arise due to scarce information, taking the blame of investors. Instead, according to B.M. Friedman (1979), rationality and rational
expectations are two separate things. The difference, he argues, is information. An in-vestor can be rational in the sense that he/she exploits all the relevant information avail-able to him/her, however, due to shortages of the information needed to make accurate predictions of future outcomes, the investor can simultaneously fail to form rational ex-pectations of these outcomes. In order for a rational investor to form rational expecta-tions, full understanding about the economic model from which the outcomes stem is required. Further, this understanding has to be paired with all the relevant information regarding the coefficients constituting the model in order to be useful.
Several findings have been presented in support of this theory as well. Lewis (1989) shows the effect on US dollar exchange rate forecasts during the early 1980‟s of an in-crease in the demand for the currency. The findings suggest a consistent undervaluation of the dollars‟ strength.
Timmermann (1993) explains how it is possible to observe unexpected movements in the prices of stocks when including a learning component into a present value model. A last example of research presented in support of this second alternative theory was presented by Lee (1998). Through his study, he attempts to show how volatility in stock prices can appear without the emergence of new information signaling the movement.
2.4 Previous Findings
The screening model used in this study is based on the P/E ratio and small firm effects. In order to properly introduce the reader to these findings, the development in the field and the main criticism weathered against them, a thorough review of the main studies presented follows below.
2.4.1 Price/Earnings Effect
Basu (1977) attributes market anomalies to investor irrationality using a dataset consist-ing of 1400 firms listed on the NYSE in the period 1956-1971. The P/E ratios were
cal-The reason for excluding negative P/E firms was that the implications with firms gene-rating negative earnings are ambiguous, and can thus not be perceived as suggesting undervaluation of the stock, which is how the P/E ratio is normally used (Basu, 1977). Repeating the selection annually yielded 14 sets of returns for each of the five portfo-lios. The results showed that the portfolio containing stocks with the lowest P/E ratios outperformed the portfolio with the highest P/E ratio stocks, earning average returns for the 14-year period of 13.55% and 9.34% respectively. Moreover, the systematic risk as-sociated with the lowest P/E portfolio was lower than that of the highest P/E portfolio, refuting the capital market theory, which assigns superior returns to a greater level of non-diversifiable risk. On the contrary, the lowest P/E portfolio earned an average re-turn of 4.5% in excess of what would be implied based on its systematic risk, versus 2.5% less than the systematic risk-based expected return for the highest P/E portfolio. Based on his findings Basu concludes that, as a consequence of irrational investor ex-pectations, P/E ratios could be used to map out groups of stocks with a better future per-formance than average. Finally he argues that: 1) the CAPM does not have descriptive validity and, 2) Price movements on the NYSE are inconsistent with the EMH.
2.4.2 Small-Firm Effect
The phenomenon of the small firm effect was first discovered by Rolf W. Banz (1981). He studied the relationship between return and market value of NYSE common stocks and concluded that small firms, on average, had far greater returns than large firms over a forty year period. His sample included all common stocks listed and the study was conducted upon monthly price and return data. Furthermore, equally- as well as value-weighted indices were used as market proxies. The portfolio construction was based on assigning the securities to one out of five portfolios according to market value. Each of those five portfolios were in turn split into five new portfolios on the basis of the stocks respective betas, resulting in a total of 25 portfolios.
In his paper, Banz argued that small firm returns were significantly larger even when adjusting for risk. Although he found evidence of the size effect, he stressed the fact that the correlation is non linear and decreases as the firm size increases. In other words, small cap firms had far greater returns than mid cap firms, whereas no significant
dif-ference was found when comparing mid cap and large cap firms. In addition, as he ana-lyzed his findings in sub-periods he discovered that the correlation was rather unstable trough time. Banz is, however, unsure of whether to attribute the findings of his study to the size factor itself or if size is a proxy for other unknown factors correlated with size. Banz offers one possible explanation for the size effect. In his paper he argues that the amount of information available might be correlated with size and that less information available about a company increases the uncertainty surrounding its stock. Consequent-ly, small firm securities would be less desirable to hold. Moreover, he argues that secur-ities sought by a limited amount of investors have higher risk adjusted returns.
The small firm effect is supposedly present in markets outside the Unites States as well. Chan, Hamao, and Lakonishok (1991) studied small firm returns of Japanese stocks and concluded that a small firm premium of around 5% existed between 1971 and 1988.12 Moreover, Dimson and Marsh (1986) analyzed stocks in the United Kingdom and re-ported that small stocks had outperformed large stocks by 6 percent annually between 1955 and 1984 (Damodaran, 2002).
Criticism against the small firm effect often comes in the form of a failure to adjust for transaction costs (Damodaran, 2002). In their study based on NYSE stocks for the pe-riod 1955 to 1979, Stoll and Whaley (1983) examined the correlation between the mar-ket value of a stock and the risk-adjusted return net of transaction costs. They found that the average spread for the smallest firms was 2.93%, while 0.69% for the largest. The difference was less substantial for the commission rates. On a turnaround transaction, the average commission fee for the smallest firms was 3.84%, while the largest firms at-tained an average commission fee of 2.02%. In total, on a turnaround transaction, the difference in transaction costs amounted to 4.06% of the capital invested.
2.4.3 Combining and Comparing the Two
In his 1981 paper, Marc R. Reinganum presented a study where both the E/P and small firm effects were tested based on annual data retrieved from the Compustat tapes for the period 1962-1975, with firms listed on both the NYSE and the AMEX and including
de-E/P ratios, stocks in the portfolios were assigned equal weights. The results showed that the highest E/P portfolio (EP10) earned an average of more than four percent more than the average return suggested using its beta. Moreover, EP10 earned an average of ten percent per year more than EP3, which had a beta value close to that of EP10. Further, Reinganum found that the majority of firms in EP10 were from the AMEX, which gen-erally accommodates smaller firms. Thus, he concluded that his findings suggest that the E/P anomaly can, to some extent, be explained by firm size.
Based on this finding and on a previous paper by Banz (1978) that suggested firm size (market value) as a good indicator for exceptional future performance, Reinganum went on to conduct a study with the purpose of assessing whether the E/P and firm effects are two anomalies working separately or if a correlation exists. Similarly to the way his previous study was conducted, firms were divided into deciles depending on their mar-ket values. Excess returns were then assessed by comparing daily returns on the NYSE-AMEX index with those of the portfolios. The results showed that the lowest value port-folios outperformed the rest of the portport-folios and the NYSE-AMEX index. However, the effect was only evident in the two lowest value portfolios. Finally, he conducted a study with the purpose of testing for a relation between the firm value and E/P effects. In order to reassure that all stocks were included in a portfolio, Reinganum divided the stocks into quintiles, forming a total of 25 portfolios. After comparing returns with the NYSE-AMEX index, he presented the results in a way that allowed him to keep E/P roughly constant at a certain level while controlling for changes in market value, and vice versa. In this way, he could determine which one of the two carried more explana-tory power with regards to the returns. He concluded that both factors are valid proxies for some unknown underlying factors missing from the CAPM, and that firm size seems to capture the effect of these factors on returns more closely than the E/P. Thus, he closes, “the test demonstrates that the value effect subsumes the E/P effect”.
In an answer to Reinganum‟s (1981) paper, Basu (1983) presented a similar study using a different methodological approach. Basu argued that Reinganum‟s failure to adjust for risk, both systematic and total, can distort results in two ways. Firstly, although the small firm-size portfolios in each of the E/P categories outperformed the large firm size portfolios, they also carried a greater systematic risk. Secondly, by not adjusting for risk, he erased the possibility of finding a significant E/P effect. The reason for this
second observation is that the estimated betas for the stocks revealed that the lowest E/P portfolios had higher betas than the high E/P portfolios.
Basu (1983) used the Compustat price-dividends-earnings tape to retrieve 12-month moving accounting earnings per share for the period 1962-1978. In addition stock quotes, returns and other key stock data were collected from the CRSP tape. On aver-age, about 900 firms passed the criteria for inclusion into the sample every year. E/P ra-tios were then calculated for all the stocks, and the sample was divided into quintiles according to their E/P. Negative E/P ratio stocks were again excluded, as in his pre-viously mentioned study. The first portfolio, EP1, contained the lowest E/P stocks and portfolio EP5 contained the highest. In a second round of sample division, the same process was undertaken, but this time based on market values. The portfolios were up-dated once a year for the entire 17-year period. A negative association between the two factors was initially spotted, which saw low market value portfolios have high median E/P ratios and vice versa. This would limit Basu‟s ability to attribute any potentially ab-normal returns specifically to one of the two factors, and led him to construct what he called “randomized portfolios”. Five such portfolios were created for the market value portfolios, and five for the E/P portfolios. All the stocks in each of the five E/P portfo-lios were ranked according to firm size, and the lowest quintile in each of them was in-cluded in randomized portfolio one, EP1*. The stocks in the second lowest quintiles of the five portfolios constituted randomized portfolio two, EP2*, etc. The same was done with the five market value portfolios. In this way, the portfolios based on the two factors were randomized according to the other factor. All the market value portfolios rando-mized with respect to E/P had similar median market values, and all the E/P portfolios randomized with respect to market value had similar median E/P ratios. Further, Basu computed the standard deviation and beta for each portfolio as a means of adjusting re-turns for risk.
The results confirmed previous findings pointing out the two anomalies, as the best per-forming portfolios were those with the lowest market value and highest E/P ratio. How-ever, the most interesting finding Basu made stemmed from an analysis of the rando-mized portfolios. He found that the returns per unit of variability for the E/P portfolios
termining returns. By contrast, he found that market value portfolios randomized with respect to E/P did differ in risk adjusted returns generated. The results showed that the randomized portfolios with high E/P earned superior risk-adjusted returns with respect to those with low E/P ratios, thus concluding that E/P seems to be a rather strong proxy for the factors determining return. In other words, Basu rejected Reinganum‟s conclu-sions which hold firm size as the best proxy for the underlying set of factors determin-ing return. However, he emphasized, firm size and E/P are not entirely independent.
2.5 Risk-Adjusted Performance Metrics
In order to determine if our investment strategy is successful we will use three measures of performance: Jensen’s alpha, the Sharpe ratio and the Treynor ratio. The three me-thods all measure performance adjusted for risk but differ slightly in the way risk is in-corporated into the respective model. Moreover, these are by far the three most widely used methods by academics. Some have chosen to use only one of them, but customary has been to use two of the three. Since all three methods are far from perfect individual-ly, we have decided to use all of them in an attempt to suffer as little as possible from the drawbacks (described in section 2.5.4 below) they carry.
2.5.1 The Sharpe Ratio
The Sharpe ratio is basically a measure of the excess return of a stock or portfolio in re-lation to its risk, and is therefore described as a risk adjusted measure. More formally, the Sharpe ratio is defined as the rate of return on a stock/portfolio in excess of the risk-free rate divided by the standard deviation of the returns on that stock/portfolio. Hence, a measure of excess return per unit of risk is provided. It is a critical measure in analyz-ing the data since the resultanalyz-ing portfolio, created usanalyz-ing the proposed screenanalyz-ing method, might carry additional risk. The sharp ratio will thus help in assessing whether excess returns are justified by additional risk. According to Sharpe (1994) the formula for the Sharp Ratio is as follows:
Where:
E[R] = Expected return of stock/portfolio Rf = Risk free rate
= Standard deviation of stock/portfolio
Important to bear in mind is that the Sharpe ratio is not an absolute measure, i.e. it has to be judged in relation to other portfolios, such as the market portfolio. As such, it is common measure used to rank portfolios.
2.5.2 Jensen’s Alpha
Jensen‟s alpha is a risk-adjusted performance measure used to determine the excess re-turn of a stock or portfolio of stocks, over the rere-turn predicted by the CAPM. As op-posed to the Sharpe Ratio, Jensen‟s alpha accounts for market risk as measured by the stock/portfolio beta. It therefore gives a good indication of the performance of a lio after accounting for market risk. The CAPM return is adjusted for risk, thus a portfo-lio or stock with higher returns than that predicted by the CAPM is producing excess re-turns and would consequently have a positive alpha. In an efficient market, therefore, a portfolio or stock should, on average, generate an alpha value of zero. Jensen‟s alpha is a widely used method for the purpose of measuring systematic risk-adjusted returns, and was also the method used by Basu (1977) in his famous study on excessive returns and P/E ratios presented in the section 2.4.1 above. The measure was introduced by Strong (2002), and the formula is:
α
J= R
i– [R
f+ β
iM* (R
M– R
f)]
Where:
J = Jensen‟s Alpha
iM = Beta of portfolioi RM = Actual Market Return
2.5.3 The Treynor Ratio
The Treynor ratio, presented by Jack L. Treynor (1965), is a risk-adjusted performance measure giving the portfolio risk premium per unit of systematic risk, represented by the portfolio beta. It can to some extent be considered a fusion of the other two meas-ures, since it relates the portfolio risk premium from the Sharpe ratio, to the market risk as represented by beta, from Jensen‟s alpha. It is a useful measure in that it assists in explaining whether excessive returns can be assigned to additional risk carried by the portfolio. Moreover, since it is a relative measure, it has to be analyzed with respect to the market. The formula is:
T = (r
i– r
f)/β
i Where: Ri = Return on portfolioi Rf = Risk-free rate βi = Beta of portfolioi 2.5.4 DrawbacksThe primary criticism towards the Sharpe ratio is the use of the standard deviation as a proxy for risk. Its sensitivity to the distribution of values is such that it often can misre-present reality. For instance, positive deviations from the mean weigh as heavily into the denominator as do negative ones. This means that two portfolios with the same re-turn and standard deviation will generate the same Sharpe ratio, although one of them
might have more negative deviations and the other a majority of positive ones. The strongest point made against this shortcoming was presented by Leland (1999), who re-jects the inherent assumption that all deviations from the mean are equally unattractive to investors. As a result of this weakness, alternative models for risk-adjusted returns have emerged, such as the Sortino ratio, which defines deviations as those values falling below a certain pre-specified target return (Sortino & Price, 1994). In this way, the port-folio is solely punished for deviations unwanted by the investor, and a fairer picture of the risk-adjusted performance is provided.
The criticism against Jensen‟s alpha is basically the one directed toward the CAPM, as this lies at the core of the measure. The CAPM was built on the ideas of portfolio selec-tion presented by Harry Markowitz (1952). In his paper, he argues that investors are risk averse, and are consequently solely concerned with the mean and variance of their in-vestments. As such, investors seek to minimize variances and maximize expected re-turns when constructing portfolios, which are always a combination of risky assets and a risk-free component, something referred to as the “mean-variance model”. In addition to this, Sharpe (1964) and Lintner (1965) added two additional assumptions in con-structing the CAPM, 1) complete agreement among investors regarding the joint distri-bution of asset returns over the period starting at t-1 and ending at t, and 2) all investors can borrow and lend freely at the risk-free rate (Fama & French 2004). Although these two assumptions are widely used in economic models, they cannot be considered to hold in reality. Investors value assets differently and so cannot be assumed to complete-ly agree on asset returns, nor does the second assumption regarding borrowing and lend-ing at the risk-free rate reflect real market conditions.
Criticism has also been shed on the Treynor ratio, most extensively on beta as a proxy for risk. In his world famous investment classic “Margin for safety” (1991), Seth Klar-man puts forward a set of arguments for why beta falls short of being an acceptable proxy for risk. Firstly, he argues that a single number reflecting a stocks‟ price sensitivi-ty to movements in the overall market is obsolete in determining the riskiness of a stock. The complete ignoring of the constantly changing economic environment as well as the failure to incorporate business fundamentals deems beta not trustworthy. Second-ly Klarman, in consensus with the criticism on the standard deviations‟ use as a proxy
treated equally by the coefficient. This, he argues, does not hold in reality. Moreover, estimates of individual stocks‟ betas are imprecise, distorting the risk-adjusted returns suggested by models incorporating beta, such as the Treynor ratio, although this error is to some extent avoided by the creation of well-diversified portfolios (Fama & French 2004).
Another dimension of the criticism against the beta as a proxy for risk was laid out by Roll (1981), who argues that the small firm effect could be the result of improper esti-mation of the beta values of small firms which, he explains, is due to infrequent trading. With the use of correct values, the effect would not have been identified. Reinganum (1982) refutes this conjecture, countering with a study showing that the downward bias does exist, however not to the extent where the difference in returns is fully deteri-orated.
2.6 Stockholm Stock Exchange
The Stockholm stock exchange is owned by the NASDAQ OMX Group and as at 2009-03-24, 259 companies were listed on the main market (Avanza, 2009:1). The companies listed are categorized into four lists based on their market capitalization, namely: Small Cap, Mid Cap, Large Cap and First North, previously known as A-listan, O-listan and Nya Marknaden (Sveriges Aktiesparares Riksförbund, 2008). In addition, stocks are al-so categorized into sectors in accordance with the Global Industry Classification Stan-dard (Nasdaq OMX, 2009b).
The Stockholm stock exchange is considered rather small, with a market capitalization of €596.3 billion during 2006 (Nasdaq OMX, 2007), as opposed to $25.0 Trillion on the NYSE (NYSE, 2007). Being relatively small in terms of market capitalization, it is fair to assume that it is less liquid and consequently less efficient (Damodaran, 2002).
2.6.1 Market Indices
Two widely used market indices in relative performance measurement in Sweden are the AFGX and the OMXSB GI. Both indices are Gross Indices (GI), meaning they ac-count for any dividends paid out. Moreover, the indices are weighted according to each shares respective market capitalization (Nasdaq OMX, 2009c; Affärsvärlden, 2009a).
2.6.2 AFGX
OMX Affärsvärldens generalindex, AFGX, is the oldest Swedish index, dating back to 1937. The index is composed of a large set of stocks from all sectors and is therefore a solid measure of the overall market performance. Furthermore, Swedish fund managers often use the AFGX as a benchmark to compare to (Affärsvärlden, 2009b).
2.6.3 OMXSB-GI
The OMX Stockholm Benchmark Index includes 80 to 100 of the largest and most traded stocks on the Stockholm stock exchange. The index is adjusted by the free float, and is thus weighted according to the share capital available for trading. The fact that it is adjusted by the free float, and consequently fully replicable by investors, makes it highly attractive for performance comparisons. In addition, it is considered a rather broad index and depicts the overall trend of the market (Nasdaq OMX, 2009c).
2.7 Risk and Diversification
For its use in the three measures of relative performance, the risk-free rate has to be de-termined. Damodaran (2002) explains that there are two conditions that have to be met in order for an investment to be truly risk free. First, no risk of default on the investment can exist, excluding all non-government issued securities. Second, there can be no
re-this thesis, however, re-this does not pose a problem since it is based on a passed period, and the specific rates for each period is thus know. According to theory, the true risk-free rate to use in investment analysis is the Treasury bill (Bodie, Kane & Marcus, 2003), which has duration of up to one year (Riksbanken, 2009).
Moreover, proper diversification is a legitimate concern of every rational investor. Most academics appear to consider everything between 15 to 30 stocks from different indus-tries as a reasonable amount. Moreover, empirical evidence of a diminishing rate of de-crease in the standard deviation of a portfolio as the number of stocks inde-creases was presented by Elton and Gruber (1977). They showed that, based on randomly selected stocks from the NYSE, the standard deviation of a portfolio of ten stocks is on average approximately 25% lower than that of a single stock. The average difference in standard deviation between a ten-stock portfolio and that of a 20-stock portfolio is below 2%, and between the 20-stock portfolio and the 30-stock portfolio the average difference is only slightly above 1%. Thus, after a certain point, the cost of increasing the amount of stocks in a portfolio is greater than the benefit, measured through the standard deviation of returns.
2.8 Transaction costs and Taxes
Trading with securities is subject to transaction costs. These costs consist of two items, namely a commission fee paid to the broker accommodating the trade, and a spread. The Commission fee is levied upon all trades, i.e. both when a security is purchased and sold. The spread, on the other hand, applies solely at the purchase. The commission fee at which an investor trades primarily depends on the amount deposited in the trading account with the broker, and the frequency with which he/she trades. Thus, in conduct-ing the study subsequently presented, this has to be kept in mind when decidconduct-ing upon an appropriate rate.
Capital gains are subject to taxation in Sweden. In accordance with the Swedish Tax Agency, a capital gain is the difference between the purchasing and selling price of a security, net of transaction costs. The capital gains tax is 30%, and losses are deductable at the 70% level (Skatteverket, 2009). Thus, in cases where losses occur, 70% of the
3 Method
In the following section, the reader will get a detailed explanation of the way the study presented in this report is conducted. An explanation of the reasoning behind every choice made will also be provided.
3.1 Data Collection
The quality of the data is fundamental for a study, regardless of its nature. For the pur-pose of this thesis, quantitative data is used, as oppur-posed to qualitative data that would not allow us to reach the desired level of concreteness in the results. The raw data is re-trieved from börsguide, a book containing financial information for the entire Swedish Stock Exchange. Extensive firm-specific information is provided, as well as all the ma-jor events that have affected the stock exchange since the last release, such as acquisi-tions, bankruptcies and name changes. Since its first release in 1986, the book has been published twice a year, first by Delphi Economics and, since the second release in 2004, by Avanza Vikingen AB.
Börsguide is a popular and widely used source of financial information in Sweden, with
the most prominent users being companies in the banking and financial sectors. As such, we think of it as a highly reliable source of information and entrust it as the prima-ry source of data for this thesis.
Using the first release of börsguide for every year in the period 2000-2009, market capi-talizations, P/E ratios and closing quote as at the chosen date by the publisher are col-lected and inserted in Microsoft Office Excel 2007 for all the stocks under considera-tion. The chosen period was opted for due to the fact that any findings suggesting the presence of market anomalies on the Swedish market are more relevant the closer the testing period is to the time at which the study is conducted.
Data for the two indices used for assessing relative performance, the AFGX and the OMXSB-GI, is retrieved from their respective websites (Affärsvärlden, 2009c; Nasdaq OMX, 2009d).
Data for the Swedish 12-month Treasury bill is retrieved from the Swedish Central Bank‟s homepage (Riksbanken, 2009).
Data used in calculating spreads for use in the assessment of the impact of transaction costs and taxes is retrieved from Privata Affärer (2009), and the commission fee used is the one offered by E*TRADE (2009), a popular trading agent in Sweden.
3.2 Portfolio Construction
Firstly, it has to be pointed out that the strategy is to construct equally weighted portfo-lios, with no regards to the total ranks. The reasoning behind this is that stocks with the highest scores according to the screening model are believed to be more likely to pro-duce exceptional returns than the average stock on the market. However, we also be-lieve that these stock characteristics do not automatically guarantee performance. By weighting the portfolio with respect to total scores we would be able to generate excep-tional returns, both compared to the market, as well as to an equally weighted portfolio. However, this potential is balanced of by the risk of underperformance. In addition, by weighting the portfolio we would assign a higher level of importance to certain stocks, thus losing some of the diversification. So, in conclusion, weighting the portfolio equal-ly is believed to be the best solution.
After all the data has been collected, the process of stock selection on the basis of a small-firm and P/E ratio ranking system is initiated. The system was chosen as a means of treating both factors equally, i.e. avoiding any bias toward any of the factors, which would have been the case had one factor been used as a screening criterion before the other. The stocks were sorted according to both factors, and ranks were assigned based on the total number of stocks on the market in the given year. Following the findings regarding the effect of the P/E ratio and the small-firm effect elaborated upon above, the highest ranks were assigned to the firms with the smallest market value and P/E ratio re-spectively. In cases were two firms had equal values, an equal rank was assigned. Nega-tive P/E ratios were placed at the bottom of the P/E list, consequently receiving the low-est possible rank. Moreover, since the P/E ratios of firms with values above 99 were not more specified, they were assigned an equal rank. The two ranks for each firm are then
list of firms and their corresponding scores for the specific year is re-sorted with respect to total score and, following Elton‟s and Gruber‟s (1977) findings, the 20 highest ranked firms are selected for inclusion in the portfolio.
The portfolio is then controlled for any firms with negative P/E ratios as these, follow-ing the reasonfollow-ing of Basu (1977, 1983), are not desirable. In cases where such firms are identified, they are replaced with the best ranked firm with a positive P/E ratio from the list of initially excluded firms.
3.3 Specific Events and Dividends
When the 20 portfolio constituents have been determined, their respective closing quotes for the end of the 12-month holding period are found. In cases where this cannot be found the events surrounding the firm are more closely scrutinized and the cause for the absence of a quote is ascertained. For the sake of uniformity and consistency in the strategy, a rule is put in place: the most liquid option should always be preferred to less liquid ones. This means that cash offers, in the case the firm held in the portfolio is ac-quired or merges with another firm, are prioritized. If the only option is to obtain shares in the other firm this is accepted, and these shares are then sold of immediately at the quote for the new stock as of the last trading day for the stock originally held. In other words, the original stocks are held until they are no longer traded before any offers are accepted.
Further, we control for any splits that might have taken place during the holding period. In case a split has taken place, we adjust the quote at the end of the period as to reflect this change in value. Basic information regarding the splits is provided in börsguide, however in order to assess exactly when it was executed, we use the firms‟ annual re-ports.
Next, any dividend payouts during the holding period are accounted for. Information on dividends is retrieved from börsguide, and in order to assess our eligibility for reception of these dividends we use the firms‟ annual reports to find the record day on which Eu-roclear Sweden AB‟s (formerly Värdepapperscentralen, VPC AB) registry was
con-trolled to assess ownership of the specific stock in question. In case we would have been eligible for receiving the dividend, it is added to the quote at the end of the period.
3.4 Measuring Performance
Using the formula: ((CC/OQ)-1)*100, the return for each stock is calculated, where CC = the closing capital (closing quote plus dividends), and OC = opening quote. The aver-age portfolio return is then reached by summing the individual stock returns and divid-ing by the number of stocks in the portfolio. By usdivid-ing the annual portfolio returns, the accumulated return at the end of each period is computed. Finally, based on the accumu-lated returns in the opening and closing periods, the geometric average annual portfolio return is calculated. This is in turn used for the calculation of the standard deviation of the portfolio for the entire holding period.
Returns are calculated for the two indices, AFGX and OMXSB GI, as well. Based on their historical prices as at the same dates at which the portfolio is updated, their annual returns are calculated. Then, following the same procedure described above, their geo-metric average annual returns are calculated and subsequently their respective standard deviations.
Betas are next retrieved for all the stocks from börsguide. These are based on the most recent 48-month period preceding the release of the book. They have been calculated through regressions with the AFGX. In cases where betas are not available, later releas-es of the book are checked. If a beta cannot be found, the portfolio beta will be calcu-lated based on the remaining stocks in the portfolio.
Betas for the two indices are needed as well. Firstly, since the betas of the stocks in the portfolio, obtained from börsguide, are based on regressions with the AFGX, the AFGX is assigned a beta of 1. Secondly, for the sake of fairness in comparing performances, the beta for the OMXSB-GI index was calculated through running a regression of daily quotes for the nine-year period against the AFGX.
In accordance with Bodie et al.‟s (2004) recommendations, the Swedish 12-month Trea-sury bill is used as a proxy for the risk-free rate. When calculating the risk-free rate for
the period, an average of the daily rates for the Swedish 12-month Treasury bill over the entire nine-year period has been used.
3.5 Transaction costs and Taxes
Data on the latest bid and ask prices for the entire small and large cap lists of the OMX Stockholm stock exchange is retrieved. The bid/ask spread is calculated for each firm in the respective list, and then an average spread is computed. Since spreads are lower for more easily tradable stocks, and easiness in trading stocks is positively correlated with firm size1, this simplified method of accounting for spread is likely to put the perfor-mance of the market in better light than what would have been the case in reality. Based on previously calculated returns, we initiate the process of adjusting for transac-tion costs and taxes. To clarify, it is assumed that the alternative to creating the portfolio is creating an index fund, designed to follow the performance of the overall market. Hence following the alternative strategy, the holdings are solely purchased and sold once, at the beginning and end of the nine-year investment period respectively. We fur-ther assume that the amount available for investment is used to cover transaction costs at the beginning of the period as well, i.e. the actual amount placed in the market is in-itially reduced. Thirdly, since the portfolio should be equally weighted in the beginning of every one of the nine periods, we update all the 20 stocks in the portfolio each year, regardless of whether they are supposed to continue to be included or not. Hence, at the end of each period, commission fees are deducted for all the stocks in the portfolio. In compliance with the method described for the calculation of capital gains by the Swedish Tax Agency, the gain/loss for each period is computed, and tax is deducted. The after-tax amount is then invested in the market. With regards to regulations re-garding the treatment of losses, losses are carried forward and deducted from gains in the next year in which gains are realized. For clarification, note that the amount re-invested in the market after periods of losses is the amount left after the deduction of commission fees. Noteworthy is further that, for the private investor, different tax regu-lations apply.
All of the above calculated values are then used as input into the three performance measures used in this thesis: the Sharpe ratio, Jensen‟s alpha and the Treynor ratio. The results are analyzed firstly on an absolute basis against the indices, secondly on a risk-adjusted basis using the three measures mentioned above, thirdly solely on the basis of transaction costs and taxes and lastly on the basis of transaction costs and taxes adjusted for risk.
4 Empirical Findings and Analysis
In this section of the thesis, the empirical findings and a discussion of these are pre-sented. At first, the raw returns of the portfolio and the two market indices. This is fol-lowed by a sub-section where returns are adjusted for risk. Next, the impact of tion costs and taxes is illustrated, followed by the last sub-section in which both transac-tion costs and taxes, as well as risk are accounted for.
4.1 Portfolio Composition
The data presented in the table above shows the characteristics of the portfolio in rela-tion to those of the market. As is shown, the average P/E ratio for the portfolio is 16.07 as opposed to 19.96 for the market. The difference in market capitalization is however more distinct. The average market capitalization on the Stockholm stock exchange was SEK 18343.2405 Million while the portfolio average was only SEK 175.322. As a con-sequence, portfolio returns are reflecting the size effect more closely than the valuation
Table 4.1 Portfolio Composition.
Portfolio
Av. P/E ratio
Av. Market Cap
(MSEK) Market
Av. P/E ratio
Av. Market Cap (MSEK) 2000 10.05 188.35 2000 23.6 29404.7 2001 10.7 89.1 2001 16 15619.47 2002 13.45 113.25 2002 22.42 18183 2003 14.65 116.25 2003 15.28 11842.4 2004 22.45 207.45 2004 22.85 14273.88 2005 21.05 160.65 2005 22.246 14728.36 2006 21.7 238.35 2006 22.3 20759.58 2007 17 257.55 2007 19.939 23175.679 2008 13.6 206.95 2008 15.033 17102.096 2000-2008 16.0722 175.3222 2000-2008 19.9631 18343.2405