7
c'
CER Sl--3'1
COPY2 .
HYDRAULIC MODEL STUDY Of The
MAKIO DAM SPILLWAY AICHI IRRIGATION PROJECT. Chubu District, Honshu Island
Japan.
Prepared For
Erik Floor & Associates, Inc. by
S. S. Karaki and M. S. Amin
ENGHtHIUlG
PIS~~.P~"AUG 17'71
fOOTHILLS
EA~ 11a k~u~~~Colorado State Unviersity Research Foundation Civil Engineering Section
Fort Collins, Colorado
)
_.__,l
I
f...
,
HYDRAULIC MODEL STUDY Of The
MAKIO DAM SPILLWAY AICHI IRRIGATION PROJECT.
Chubu District. Honshu Island Japan.
Prepared For
Erik Floor & Associates. Inc. by
S·. S. Karaki and M.S. Amin
Colorado State University Research Foundation Civil Engineering Section
Fort Collins. Colorado
8.
September 19
sff
CER58SSK34
'
,
...
-
..,
.
,
.... .
I
I
FOREWORDThis report presents the results of a hydraulic model study of the spillway at Maldo Dam, located in Nagano Prefecture, Japan.
The dam is to be constructed by the Aichi Irrigation Public Corporation. The. study was conducted for the consulting engineering firm of Erik Floor & Associates, Inc. , Chicago, Illinois. All phases of the
investi-gat~on were undertaken in the Hydraulics Laboratory of Colorado State
Univ~rsity, which is under the general technical and administrative supervision of A. R. Chamberlain, Chief of the Civil Engineering Section. Technical advice was received from A. J. Peterka of the
United States Bureau of Reclamation, as consulting engineer to Colorado State University, for the model study.
-:
'
,
..
.,
CONTENTS Page FOREWORD ••••••••.
.
.
.
. . .
..
. . .
SYNOPSIS •••.
.
.
.
.
.
.
. . .
.
.
.
.
.
.
. .
.
. . .
.
iii FIGURES TABLES.
. . .
.
.
.
..
.
.
.
.
.
.
.
. .
iv
vii
Chapter I I I I I IIV
v
INTRODUCTION. .
.
. . .
.
. .
.
. . . .
.
.
.
.
.
1General Description of Project • • • • • • • • • 1 Scope of Investigation • • • . • • • • • • • • • • 1
PROTOTYPE STRUCTURE •••••••••••••
z
Spillway Approach • • • • • • • • • • • • • • • • • Z Spillway Gate Section and Chute • • • • • Z Spillway Stilling Basin • • • • • • • • • • • • • • 3
T,fiE MODEL ..•.•....•••••.•••.•. Construction • • • • • • • • • • • • . • • • • • • • Water Supply ••••••••••••••••••• MODEL INVESTIGATION •••••••••••••• 4 4 5 6 Spillway Approach • • . . • • • • • • • • • • • • • • 6 Spillway Gate Section and Chute • • • • • • • • • • 7 Spillway Stilling Basins . • • • • • • • • • • • • • 10 RECOMMENDED SPILLWAY
REFERENCES APPENDIX
'"
I
,
..
SYNOPSIS
Hydraulic model studies of the Makio Dam Spillway were made on a 1:60 scale model. The purpose of the study was to check the
original design and make modifications as necessary to develop an eco-nomical overall structure which would perform adequately. Data and notes taken on the flow in the model showed that the general performance of the preliminary design was satisfactory. However I some design
modi-fications are recommended to improve performance and to reduce the cost of the structure. These modifications included the following: fhe shape of the approach channel walls was changed to improve flow condi-tions. The width of spillway chute was reduced from 49.6 to 47.2 meters. Two types of stilling basins were tested; stilling basin B1 with
modifica-tions~ Figure 371 was found to be hydraulically superior and was
recom-mended for prototype construction. The preliminary design was re-duced 15 meters in length to provide the minimum structure. The basin floor was lowered 2 meters because of changes in tail water elevations.
Photographs 1 water surface profiles 1 pressures 1 and other data 1
and a spillway rating curve were obtained during the testing program.
f '
,
.
FIGURES FIGURES· 1.
z.
3. 4. 5.6.
7. 8.9.
10.11.
12. 13. 14. 15.Site Plan of Dam and Appurtenant Works. . Stilling Basin A Preliminary Design.
Stilling Basin B Alternate Preliminary Design. Schematic Drawing of Model.
General Photograph of Model.
Flow pattern in approach channel with vertical walls in preliminary design of Figure 2.
Flow at spillway crest with vertical walls in preliminary design of Figure 2.
Flow at left vertical approach wall for preliminary design of Figure 2.
Flow at wall for the alternate design of approach wall
of Figure 3.
Recommended approach Channel and Walls. Flow pattern for recommended approach wall design of Figure 10 .
Flow along left wall with recommended approach wall design of Figure 10.
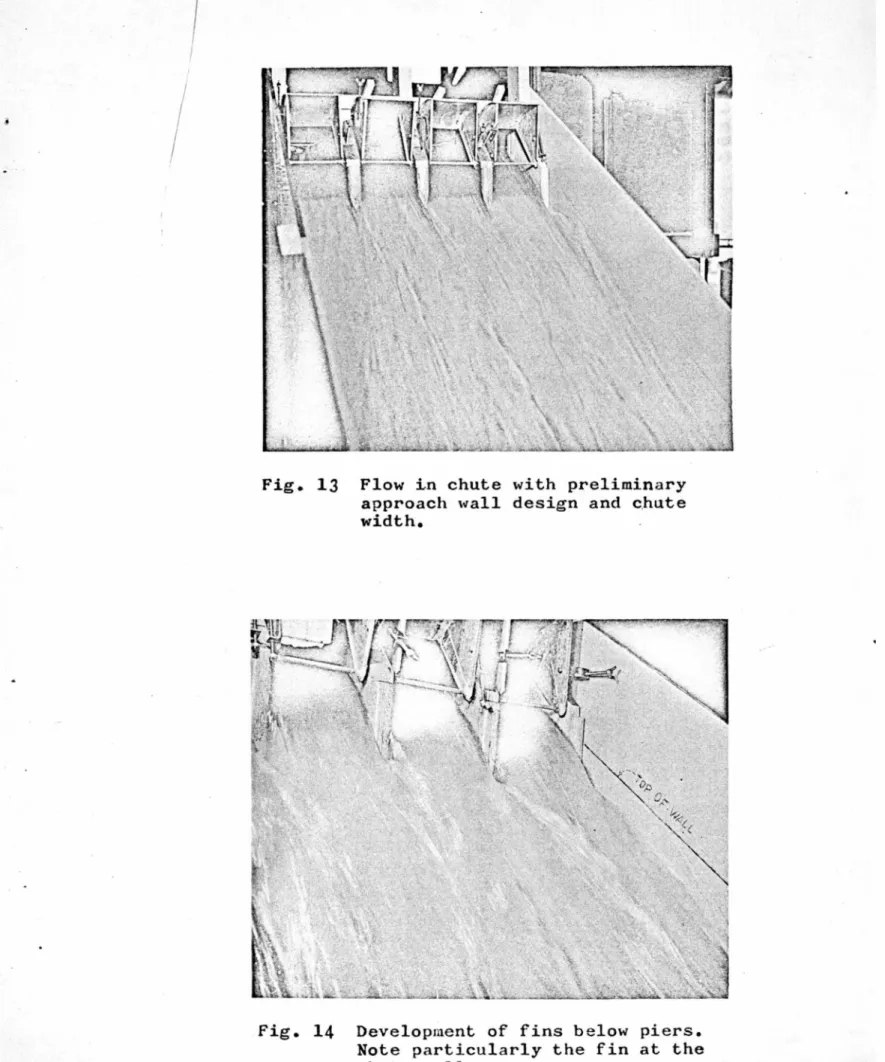
Flow in chute with preliminary approach wall design and chute width.
Development of fins below piers. Note partic..1larly the fin at the chut e wall.
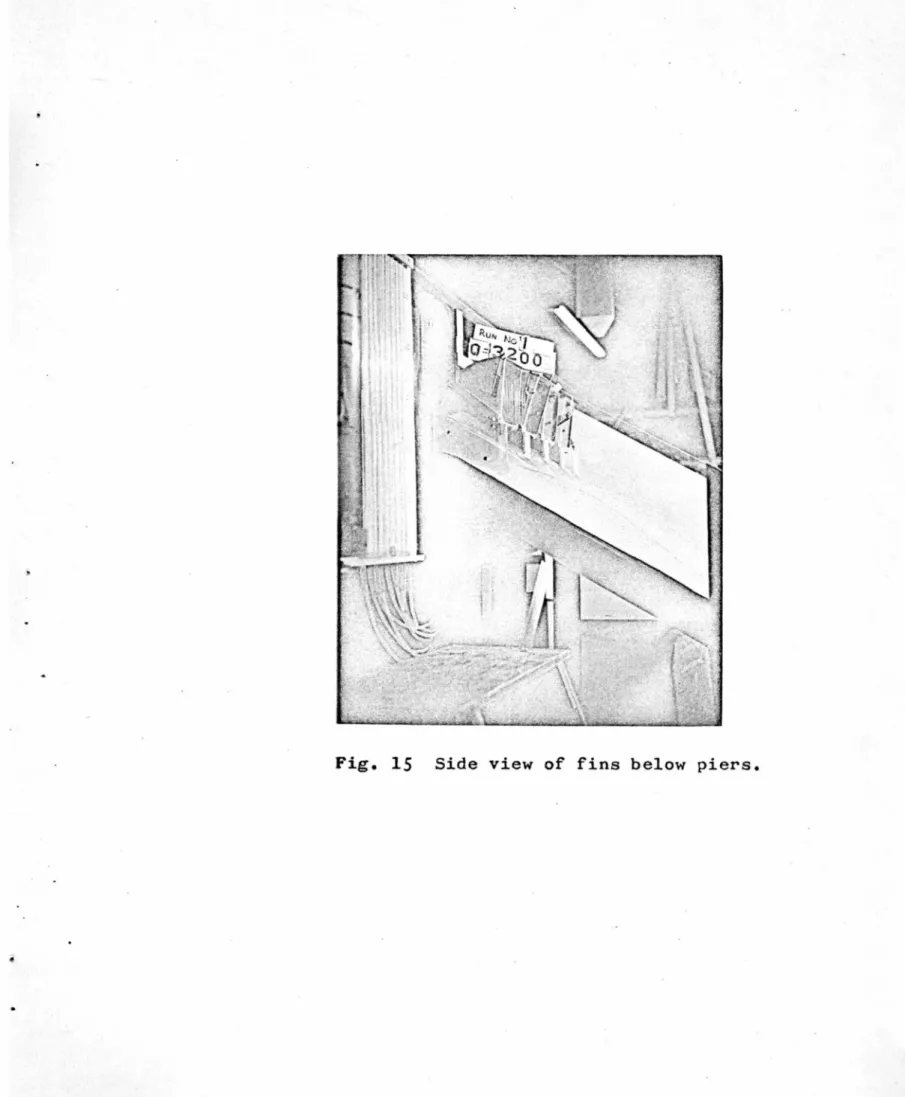
Side view of fins below piers.
,
~•
,
..
•
FIGURES - - Continued.
16.
Flow along chute wall with recommended spillway chute for discharge of 3 200 m 3!
sec. Abutment pier and chute · wall are in the satne vertical plane.17. Flow along chute wall with recommended spillway chute for discharge of 2000 m 3
!
sec. Abutment pier and chute wall are in the same vertical plane.18. Spillway Rating Curves. 19. Discharge Coefficient C.1rve. 20. Tail water Rating Curves.
2.1. Stilling Basin A . 3
Water S-..1rface Profile for discharge of 3200 m
I
sec. 22. Flow in 9 2 meter stilling basin with 4. 6 meter high bafflepiers. Discharge 3200 m 3
1
sec. Tailwater set from old rating curve.22 A.
~3.
Flow in 9 2 meter stilling basin with 3. 6 meter high baffle piers. Discharge 3200 m 3/ sec. Tailwater set from old · rating curve .
Flow in 9 2 meter stilling basin with 4. 6 meter high baffle piers. Discharge 2000 m 3/sec. Tailwater set from old rating curve.
24. Flow in 9 2 meter stilling basin with 4. 6 meter high baffle piers. Discharge 1000 m 3
!
sec. Tail water set from old rating curve.25. Location of Piezometers.
26. Flow in preliminary design of stilling basin B.
Discharge 3200 m 3/sec. Tailwater set from original rating curve .
'
.
•
t
..
FIGURES - - Continued.
Z7. Flow in preliminary design of stilling basin B.
Discharge 2000
m
31
sec. Tailwater set from original rating curve.ZS. Flow in preliminary design of stilling basin B.
Discharge 1000 m 3/sec. Tailwater set from original rating <;:urve.
29. Flow in stilling basin B shortened lO:f.leters to 85 meters in length. Discharge 3200 m
I
sec. Tail-water set from original rating curve.30. Flow in stilling basin B shortened 20:f.leters to 75 meters in length. Discharge 3200 m /sec. Tailwater set from original rating curve.
31. Flow in recommended stilling basin. Discharge of 3200
m
31
sec. Tailwater set from new rating curve. 32. 33. 34. 35.36.
37. A-1. A-2. B-1.Flow in recommended stilling basin. Discharge of 2000 m 3/ sec. Tailwater set from new rating curve • Flow in recommended stilling basin. Discharge of
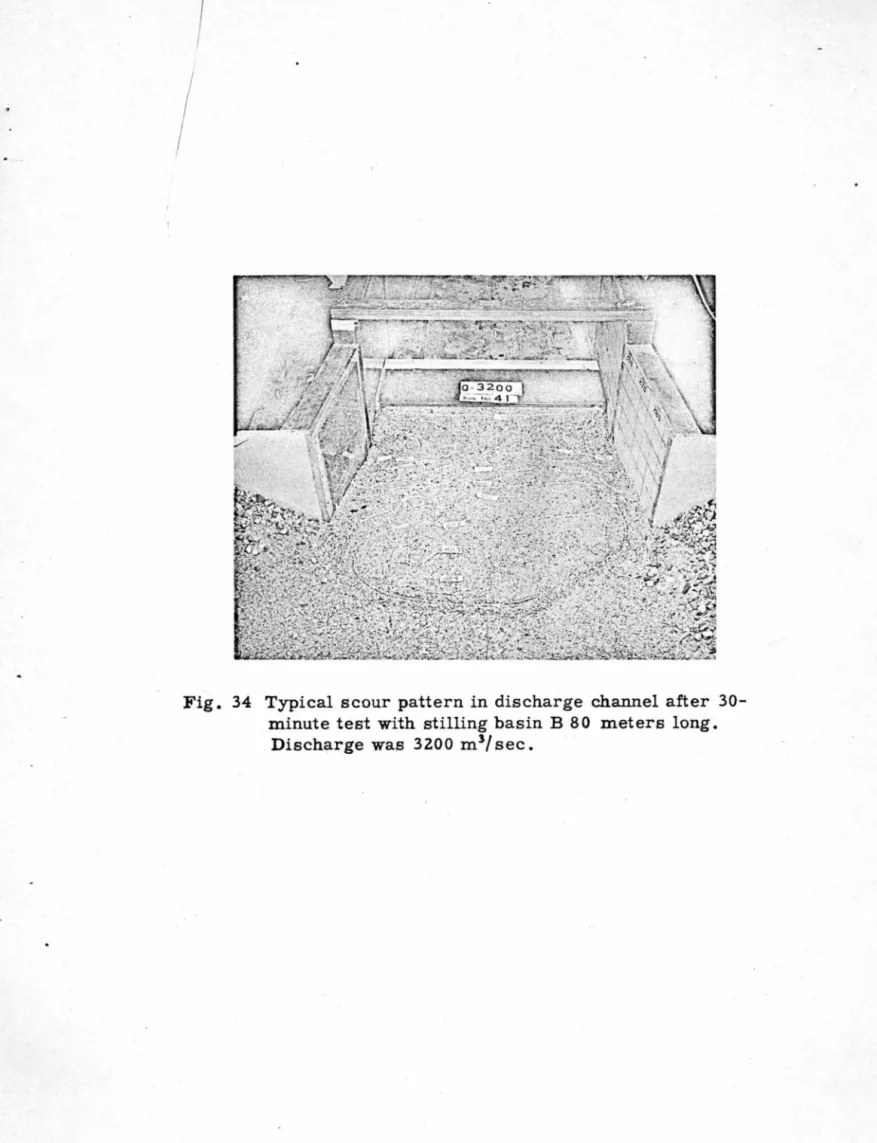
1000 m31sec. Tailwater set from new rating curve. Typical scour pattern in discharge channel after 30-minute test with stilling basin B SO--meters long. Discharge was 3200'f~··m3/ sec. ·
Protection of discharge channel bed for total length of. 35 meters beyond end sill.
After 30 minute test. Note condition of rip rap and small amount of erosion on bed of discharge channel · downstream.
Recommended Spillway.
Flow in stilling basin B with baffle piers 3. 6 meters high located midpoint in the basin. Discharge is
3200 m31sec. tailwater set from new rating curve. Flow in stilling basin B with baffle piers 3.6 meters hish located midpoint in the basin. Discharge is 2000
m
I
sec. Tailwater set from new rating curve. Final Design of Approach Channel and Walls.•
• t.
'-; Table 1 TABLES PageTable of Pressures in Meters of Water Along Spillway Crest Profile. Q=3200 m 3/sec. • • • • • • • • • 8 2
3
Maximum Negative Pressures in Meters of Water On Chute Blocks For Stilling Basin A.
Q=3200 m 3/ sec. L =102 Meters
Original Tail water Curve • • • • • • • • • • • Table of Pressures in Meters of Water On Chute
Blocks and Baffle Piers For Stilling Basin A. Length of Stilling Basin
=
92.0 meter s.
.
Height of Baffle Piers
=
4. 6 Meters ••••••• 4 Table of Pressures in Meters of Water on Chute5
6
7
Blocks For Preliminary Stilling Basin B. Length of Stilling Basin
=
9 5. 0 meters No Baffle PiersOriginal Tailwater Curve •••.•.. Table of Pressures in Meters of Water On Chute
Blocks For Stilling Basi n B.
Q=3200 m 3
I
sec. New Tail water Curve •••. .
.
Table of Pressures in Meters of ·water On Chute Blocks For Recommended Stilling Basin
Length of Basin
=
80 m. New Tail water Curve Table of Maximum Wave Heights In The DischargeChannel For Stilling Basin B. • • • • • • • • • •
vii 11 14 16 19 20 20
,
. I..
rlI
II
I. INTRODUCTIONGeneral Description of Project
Makio Dam is an 80-meter high rockfill dam on the Otaki
Riyer in Nagano Prefecture 1 approximately 8 kilometers south and east
of .Fukushima1 Japan. Although the dam is being constructed as part of
an irrigation project~ it actually will provide multiple purposes:
(1) Irrigation.
(2) Storage for a power plant on the Otaki River 1
immediately below the dam.
(3) Storage for regulation of flow for power plants on the Kiso River downstream of the junction with the Otaki River.
(4) Water supply for domestic and industrial uses. (5) Flood protection of lower farm lands.
The project is being constructed with the financial assistance of the Inter-national Bank for Reconstruction and Development.
The spillway is of the chute type and is isolated from the dam on the left bank. See Figure 1 for a site plan of the dam and appurtenant works. The spillway crest is normal to the chute center line; the chute is of constant width and discharges into a hydraulic jump stilling basin. Scope of Investigation
The purpose of the hydraulic model study was to check the pre-liminary design of the spillway and to make modifications in arrangement or dimensions as necesso.ry to assure its proper hydraulic preformance. The scope of the investigation included the following studies:
(1) Flow approaching the spillway crest. (2) Flow over the crest and around the piers.
(3) Performance of two basic types of stilling basins. (4) Flow and scour conditions at various discharges
,
• I....
•.
.,
/
I
Spillway Approach. II. PROTOTYPE STRUCTURE
The preliminary designs of the spillway are shown in Figures 1,_ Z, ·and 3. The approach channel is approximately 300 meters long and narrows from about 250 meters in width at the entrance. Figure l, to 95 meters at the beginning of the concrete approach walls. The walls, shown in Figures 2 and 3, are 40 meters long. Rip-rap is shown in the bottom of the approach channel for a length of 50 meters. followed by 65 meters of concrete slab paving extending to the spillway crest. The sides of the approach channel walls are protected with rip-rap beyond the ends of the approach walls .
Two designs of approach walls were proposed. The first design consisted of symmetrical vertical walls converging to the crest at an angle of 30°51' to the center line of the spillway as shown in Figure 2. The height varied from 15 meters at the upstream end to 18 meters near the crest because of the slope in the concrete floor of the approach sec-tion which lowered the floor 3 meters. The top of the wall was level with the top of the dam, El. 885 m. The alternate design had an unsymmetrical arrangement of the approach walls. The right wall was vertical and the left wall was warped as shown in Figure 3.
Spillway Gate Section and Chute
An ogee spillway designed for a maximum flood discharge of 3200 m 3
1
sec. Figure 2. 47. 2 meters in length. was set with crestEl. 870 m. Three spillway piers each 2.4 meters thick reduced the effec-tive length of the crest to 40 meters; 4 bays each 10 meters long. Four radial gates, each 10 meters wide by 10.5 meters high, were used to control the flow over the spillway .
-2-•
••
I
I
/ The spillway chute. 49. 6 meters wide. was excavated in rock and inclined downward at thirty degrees from the junction with the crest to the
I
beginning of the stilling basin. At the toe of the chute. blocks were set to aid development of the hydraulic jump in the stilling basin.
Spill way Stilling Basin
Two stilling basins.· .termed stilling basin A and stilling basin B. were proposed by the designers. Stilling basin A included a secondary weir or dam 10. 5 meters high with the floor of the basin only 2 meters lower than the elevation of the discharge channel. In stilling Basin B. the floo·r was set 7 meters lower than the discharge channel and a stepped sill was used at the end of the basin.
Dimensions of stilling basin A are shown in Figure 2. The length of the basin was 102 meters. measured along the center line of the spill-way from the toe of the chute to the face of the secondary dam. The walls of the basin diverged from the chute to a point 85 meters dov:nstream. From there to a point 5 meters beyond the secondary dam the width of the basin was constant at 60 meters. The training walls of the secondary basin diverged to a point 35 meters downstream.
Dimensions of stilling basin B are shown in Figure 3. The length of the basin was 95 meters. measured along the center line of the spillway from the toe of the chute to the beginning of the stepped end sill. All
lengths of stilling basin B, used in this report. · have . reference to the above line of measurement. The walls diverged in a manner similar to that of stilling basin A. The floor elevati on of the stilling basin was El. 795 m. and the elevation of the top of the end sill was the same as that of the river bed, El. 802 m.
In the preliminary designs no protection of the bed and banks was indicated for the discharge channel.
,.
I ....J
I
ConstructionIII THE MODEL
- ;
The model shown in Figures 4 and 5 is a 1:60 scale reproductionof the spillway and adjacent areas. A scale of 1:60 was chosen since it · provided a model sufficiently large to supply accurate data and was in keeping with the available laboratory space and facilities. A larger model would have supplied little, if any, additional data and would have cost more to construct and test.
The overall dimensions of the head box were 12 feet long by 8 feet wide. The part of the approach chG.nnel constructed in the head box~ shown
in Figure 4, represented approximately 160 meters of the 300 meters of approach channel length. Velocities calculated for the channel upstream from this point yielded values. sufficiently small to indicate that modeling of that section was unnecessary. Also, no peculiar hydraulic problems exist in that section of the channel.
The bed of the approach channel consisted of 3/4 in. gravel
to
assimilate the rip-rap indicated in the prototype design . The concrete paving was assimilated by plywood and the vertical approa::::h walls by sheet metal. To dampen the disturbances in the flow after passing through the inlet diffuser, a rock baffle was set in the headbox normal to the center line of the spillway. A piezometer, 90nnected to the headwater stilling well, was installed downstream from the rock baffle to measure water surface levels in the approach channel .
The spillway crest was constr ucted of sheet metal and was fitted with wood piers, constr ucted according to the plans of the preliminary design. To measure pressures along the spiJ.lway crest profile, 9 piezo-meters were installed and connected to water manopiezo-meters. Spillway Crest Detail in Figure 4 shows the location of the piezometers.
-4-...
,
.
I
..
The stilling basin was constructeq so that t:esting of both types of sfilling basins could be done without major re~o~struction of the model. The initial floor of. the model was constructed to the elevation required for stilling basin B1 and falsework was overlaid so that stilling basin A
could be tested first.
A transparent wall was set in one side of the stilling basin to facilitate observation and photography. Downstream topography was assimilated as closely as possible in a movable gravel bed and extended for 6 feet,1 as shown in Figure 4. To measure the tail water level in the
discharge channel a piezometer tap was made in the center of the channel and connected to the tailwater stilling well. The stilling well was graduated
in model meters for ease of setting the desired tailwater depth. Control of the tail water level was obtained with an adjustable gate.
Water Supply
· -- - Water was supplied to the model from a 14-in. turbine pump~ and
recirculated through the laboratory sump system. The flow into the model was measured with an orifice installed in the discharge line of the pump. The orifice was calibrated volumetrically at the beginning of the investi-gation •
-s-,.
,
"
IV . MODEL INVESTIGATION
The investigation was concerned with the hydraulic performance of the spillway and stilling basin and with the erosion of the movable (erodible) bed in the discharge channel caused by flow leaving the stilling basin. The maximum flood discharge of 3,200 m 3/sec was tested along with the design discharge of 2000 m 3
!
sec, and a smaller discharge of 1, 000 m 3!
sec to be certain that the spillway operated satisfactorily over the entire discharge range.Spillway Approach
The spillway was first tested with the approach walls of Figure 2 in place. Figure 6 shows confetti traces which indicate the flow lines
3
in the approach area for a flow of 3, 200 m
I
sec. Note the absence of eddies. Figures 7 and 8 show flow at the spillway crest and approach wall. Because of the sharp intersection at the junction of the approach wall with the abutment piers, there was considerable drawndown on the spillway crest. In both photographs the discharge was the maximum3
flood flow of 3, 200 m
I
sec.The results of this test indicated that the width of the approach . channel could be reduced and that some modification of the approach wall
would be necessary to eliminate the excessive drawdown at the abutment piers.
With the warped wall of Figure 3 in place, instead of the verti-cal wall, the surface stream lines were smoother at the upstream end of the wall, Figure 9, but there was greater drawdown at the wall-pier junction. Compare the photographs of Figures 8 and 9.
The width of approach channel was decreased by placing gravel along the banks of the model until a satisfactory width was attained and several alignments of the approach walls were investigated. Figure 10 shows the recommended width of approach channel and alignment of the
-6-••
I
approach walls, and Figures ll and 12 show the resulting surface flow pattern and profile for a discharge of 3, 200 m 3
I
sec. Note the smooth flow and absence of drawdown at the abutment pier.Spillway Gate Section and Chute
Flow Characteristics - - Flow through the gate section is shown photographically in Figures 7 and 11 for the maximum discharge of 3, 200 m 3
I
sec with the gates open for free flow. A standing wave at the pier noses caused a slightly uneven water surface across the crest of the spillway. In an attempt to reduce the wave, various pier shapes were tried, but because of the location of stop log grooves in the piers any streamlining of the noses would have had to project upstream from the crest. "Bullet-nosed'' piers were tried, but the added frictional resistance of the longer piers somewhat offset the benefits derived by stream-lining the nose. Since the wave was more a matter of interest than concern, it was decided that the original pier shapes were satis-factory.Figures 13, 14, and 15 are photographs showing flow conditions and profiles in the chute at the maximum discharge of 3. 200 m 3
I
sec. Jn the p.reliminary design, the chute was wider than the crest width, because the abutment piers projected into the flow area defined by the chute walls. The abrupt offset at the downstream end of the abut-ment piers caused a water '1fin" :to develop along each chute wall, asshown in the photograpl1s. The fins adjacent to the chute walls
over-3 0
topped the walls at 3. 200 m
I
sec d1scharge.To eliminate the fin, the width of the chute was reduced so that it was equal to the width of the crest. Thus the faces of the abut-ment piers were in the same vertical plane as the chute walls. The effect can be seen in Figures 16 and 17. Note in Figure 16 that the height of the wall immediately adjacent to the abutment pier should be increased to contain the flow at maximum discharge. Figure 17 shows satisfactory conditions for 2, 000 m 3
I
sec discharge.•
I
-I
Spillway Crest - Table!_ gives values of pressures on the spillway crest. It will be noted in the table that there was very little influence of changes in the approach wall with pressures on the crest. The minimum crest pressure noted for the maximum discharge of
3
3200 m /sec was 0. 3 meter. Location of piezometers are shown on the crest detail of Figure !~ Because no negative pressures were
developed on the spillway crest. the preliminary crest shape was con-sidered satisfactory.
TABLE 1
TABLE OF PRESSURES IN METERS OF WATER ALONG SPILLWAY CREST PROFILE
- 3
Q=
3200 mI
secPiezometer Preliminary Preliminary Recommended
No. Design with Design with Approach wall
Vertical· wa.lls Warped walls Design
1 13.3 13.3 13.3 2 4.7 4.7 4.6 3 2.4 2.4 2.3 4 0.3 0.3 0.3 5 1.4 1.2 1.2 6 2.0 2.0 2.0 7 1.5 1.4 1.4 8 2.7 2.6 2.7 \ 9 4.1 4.0 4.1
..
-8-..
,.
approach and in the chute walls at the gate section, the spillway crest Rating Curve - - With the modifications made in the spillwaywas calibrated for both free and gate controlled flow. The rating curve is shown in Figure 18. The efficiency of the crest is indicated by the discharge coefficient in the equation:
where:
Q =discharge in m 3/ sec., C = coefficient of discharge,
L =effective crest length in meters,
H =total head or difference in elevation of reservoir surface and crest in meters.
For maximum discharge under free flow conditions, the coef-ficient is approximately 2.13 as shown by the curve of the coefcoef-ficients. See Figure 19. Note that Figure 19 also shows the coefficient in terms of feet and cfs units. ' The value 3. 8 indicates that the crest is very efficient. · The water surface in the reservoir, at maximum
dis-charge of .3, 200 m 3
1
sec under free flow conditions, is at El. 881.2 m. The reservoir level anticipated by the designers was shown on the pre-liminary drawings as El. 883.5 m.The spillway was also calibrated for gate-controlled flow, as shown in Figure 18, for use in prototype operation of the structure. The crest and gates were calibrated with the recommended approach walls and chute width in place in the model. Gate opening is defined as the vertical distance between the lower lip of the gate and the gate seat. The gate seat is at El. 869.843 m. The gates were operated uniformly •.
Discharge curves for exact meter openings are shown in Figure 18. Discharges for openings involving fractions of meters
'.
may be interpolated from the data shown. The dashed lower portion of the gate opening curves indicates a region which cannot be deter-mined exactly in a model. However 1 the values shown by the dashed
curves are believed to be essentially correct. Spillway Stilling Basins_
The two stilling basi ns were tested to develop the most eco-nomical basin consistent with adequate hydraulic performance. Two tailwater rating curves were used during the course of the investigation.
The original rating curv e, shown in Figure 201 was used
through-out the testing of both stilling b a sins. When the testing was completed, a new tailwater rating curve, also shown in Figure 20, was received from the designers as being representative of the tailwater elevations established by field investigators. The recommended stilling basin B was re-tested using the new tail water rating curve. Stilling basin A was not re-tested however, as it had been previously concluded that stilling basin B was economically and hydraulically better suited to the locale.
Stilling Basin A - - The water surface profile in the basin for the preliminary design of stilling basin A is shown in Figure 21.
{Figure 2 shows the details of the preliminary design of stilling basin A}. The water surface was determined from average readings taken at numer-ous points on the gr id on the sti lling basin wall. See Figure 5 for the grid marked on the wall opposit e the transparent wall. Because the theoretical sequent depth was not attained in the basin, the jump formed farther down-stream than was desirable and the chute blocks were partially exposed. The flow, after passing over the secondary dam, formed a second hydrau-lic jump below the dam which was somewhat unstable and considerable water surface roughness wa s developed in the discharge channel.
Secondary dam heights of 10 . 5 : 11. 0, 11. 5 and 12. 3 meters were 3
tested, with 3200 m
I
sec di s charge to establish a more efficient hydraulic jump and to move the jump upstream to cover the chute blocks. These-10-•
•,
"
tests indicated that a height for the secondary dam of 12.3 meters provided sufficient depth over the chute blocks to prevent development of excessive negative pressures. It was considered desirable to re-duce# or eliminate# negative pressures because of the associated possibility of cavitation. Cavitation would present co~siderable
maintenance difficulties to the structure and hence add to maintenance costs.
The maximum negative pressures recorded on the chute blocks for each of the heights are given in Table 2.
TABLE 2
MAXIMUM NEGATIVE PRESSURES IN·.METERS OF WATER ON CHUTE BLOCKS FOR
STILLING BASIN A. 3
Q=3200m/sec. L = 102 meters
Original Tailwater Curve
Height of Piezometer1 Maximum Neg.
Secondary Dam Number Pressures in
Meters
10.5 2 -10.
oz
ll. 0 2 -10.
oz
ll. 5 2
-6.8
12.3 2 -4.2
1 Piezometer number indicates location as shown in Figure 25.
z Values are greater than maximum negativepressures poss-ible# but are tabulated to indicate model results.
-11-...
r
• .
An effective method to shorten a stilling basin is to modify the hydraulic jump. This may be done by various arrangements of baffle piers and sills on the basin floor. The restriction on the arrangement is that the baffle piers and sills must be non-clogging. Experience and numerous experiments by personnel of the United States Bureau of Recla-mation in Denver 6 Colorado 6 have indicated that for a basin of the size
under consi deration here, a single row of baffle pier·s placed favorably in the basin would be effective in shortening the basin. (A list of references is given in the Reference Section). Tests were therefore conducted with baffle piers to shorten the stilling basin.
Preliminary tests were conducted with three sizes of baffle piers, 3. 66 4. 6, and 6.1 meters high. Only a single row was used. The
spac-ing between piers were equal to the widths of the baffle piers. The dimen-sions of the baffle piers with piezometer locations on the piers are shown in Figure ZS. To determine an effective location for the baffle piers, tests were made at quarter points in the length of the basin.
The results of tests for the three baffle piers at the first quarter point downstream from the toe of the chute, indicated an unsatisfactory location for all sizes. Excessive negative pressures were developed on the baffle pi ers and considerable turbulence existed in the stilling basin beyond the baffle piers. Two pier heights of 3.6 and 4.6 meters were found effective and applicable at the mid-point of the basin., but the 6.1-meter baffle pier was too high in relation to the sequent depth, as excess-ive turbulence was created beyond the baffle pier. Tests at the third quar-ter point showed that baffle piers in this location were not effective in
shortening the hydraulic jump.
It was decided from the results of these tests that two sizes of baffle piers should be used in developing the stilling basin, and their loca-tions should be confined near the mid-point of the stilling basin length.
-12-...
,
. ,
During the tests with the baffle piers, it was noted that the hydraulic jump moved upstream and was stabilized. The control point for the hydraulic jump was transferred from the secondary dam to the baffle piers, and it was found that the preliminary height of secondary dam, 10.5 meters, was sufficient when the baffle piers were used.
The tests with baffle piers in the 102-meter long basin showed that a considerable length between the piers and the secondary dam was ineffective. Accordingly, in order to determine the shortest stilling basin, consistent with adequate performance 1 the length was reduced in increments of 10 meters from 102 meters to 82 meters. Each basin length was tested with and without baffle piers. The baffle piers were located at the mid-point of the stilling basin.
As noted previously 1 the preliminary design of stilling basin A was inadequate, for the hydraulic jump was not contained entirely within the basin. Use of both 3. 6 and 4. 6 meter baffle piers stabilized the jumps within the stilling basin. There were no negative pressures developed on either size of baffle piers with the maximum discharge of 3200 m 3/sec., although, negative pressures of -5.5 m. and -5.0 m. of water respectively existed at the chute blocks. Both sizes of baffle piers developed satisfactory pressures on chute blocks and baffle piers for the design discharge of 2000 m 3
!
sec.Tests for the 92-meter basin length provided results w.,Pich were satisfactory and is discussed below. The 82-meter basin was insufficient for development of an adequate hydraulic jump even with
the 4. 6 meter baffle pier in the stilling basin. A negative pressure of -4.0 m.eters was P.~veloped on the baffle piers for the maximum discharge.
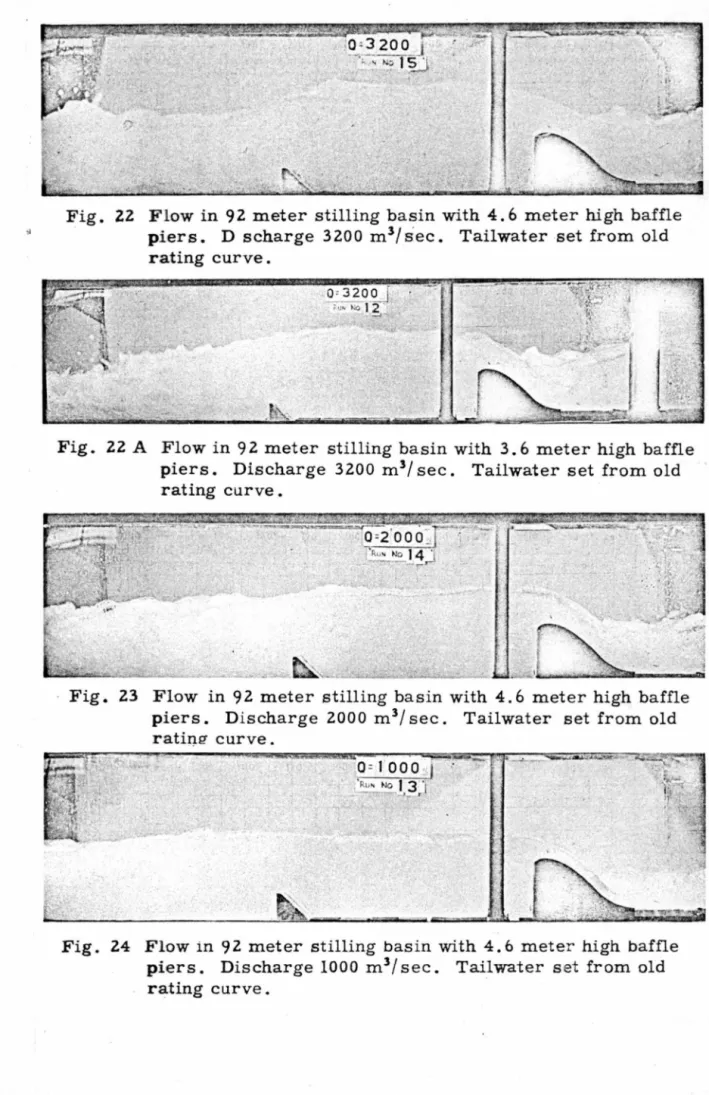
Figure 22 shows a satisfactory basin 92 meters in length with 4. 6-meter baffle piers located at the mid-point of the basin. Baffle piers 3.6 meters high provided negative pressures for 3200 m 3/sec discharge •
-13-••
No negative pressures were measured for the 40 6-meter pier. Chute block pressures were negative and with both sizes of baffle piers the magnitudes were approximately the same. The hydraulic jump in the stilling basin with 30 6-meter high baffle piers is shown in Figure 22 A.
Figures 23 and 24 show flow conditi ons in the 92-meter stilling
3
basin and 4. 6-meter baffle piers for dischar ges of 2000 and 1000 m
I
sec respectively . Although negative pressures were measured on the chute3
blocks for a discharge of 3, 200 m
I
sec ., no negative pressures were measured for discharge s of 2000 and 1000 m 3I
sec . Table 3 gives a tab-ulation cof pressures on the chut e block s and baffle piers o Location of piezometers is shown in Figure 25 0TABLE 3.
TABLE OF PRE SSURES IN ME TERS OF WATER
ON CHUTE BLOCKS ANI) BAF FLE PIERS FOR STILLING BASIN A Length of Stilling Ba sin
=
9 2 o 0 meters· Height of Baffle Piers
=
4. 6 metersI
Q = 3,200 m3/sec~
Q = 2,000 m 3/sec Piezometer Number* "" 3 Q = 11 000 mI
sec 1 2 3 4 5 6 ChuteI
Baffle 1 ChuteI
Baffle Bloc.ks Piers Blocks .Piers-4.7 2.3 1.5 9.9 -6.4 2. 0 1.5 9o3 -2.1 29.3 3.0 16.6 -6 . 0
--
0.9 ---2.1--
3. 0 ---1.4--·
4.1-*
Piezometer location s are shown in Figure 25.-14-Chute ! Baffle Blocks Piers 7.3 13.3 705 11.9 8.7 12.6 7.0
--8.1 --7.9--..
• .
....
I
I The
w~ter su:dace in the discharge channel for a flow of 3200
m
~I
sec had waves up to 2. 0 meters in height which were developed by the hydraulic jump, below the secondary dam. For 2000 m 31
sec waves Jere approximately 1. 3 meters high and for 1000 m 3!
sec waves were about 1. 0 meter high ..'
In order to determine the scour potential for various conditions of flow' a study was made of the effect of various lengths of paved apron downstream from the secondary dam. The bed of the channel consisted of 3/4 to 1/4 in. gravel. Testing of 40, 28, and 18-meter lengths of
. 3
aprons for a discharge of 3, 200 m
I
sec indicated that essentially the same depth of scour occurred at the end of the apron in a one hour test period. A 1. 5-meter high end sill with a 2:1 sloping upstream face and a vertical downstream face was subsequently tested at the end of each apron using the same discharge and test period. The results showed that 18 meters of paved apron length would be sufficient, provided an end sill was used. The scour hole which occurred with the end sill in place was located downstream from the structure and was not as deep as the scour hole formed at the end of the flat apron. One hour tests were also made for discharges of 2, 000 and 1, 000 m 3!
sec and very little scour was found for either discharge.Stilling Basin B with Orig-inal Tailwater Curve - - The prelimi-nary design of stilling basin B is shown in Figure 3. Figure 26 shows .the hydraulic jump in the stilling basin for a discharge of 3, 200 m 3/ sec.
From the traces of the air bubbles, a stagnant zone upstream from the end sill was evident, indicating the stilling basin was longer than necessary . Figures 27 and 28 show flow conditions for discharges of
3 .
2, 000 and 1, 000 m
I
sec respectively. Table 4 shows pressures on the chute blocks for the three discharges .-15-.
.
..
•.
TABLE 4.
TABLE OF PRESSURES IN METERS OF WATER ON CHUTE BLOCKS FOR PRELIMINARY STILLING BASIN B
·Length of Stilling Basin = 9 5. 0 meters • No Baffle Piers
Original Tailwater Curve Piezometer Q=:f, 2oo
m
3I
sec Q= 2, 000 m sec - 3/No.* 1 -0.8 3.9 2 -2.0 3.3 3 -1.1 2.6 4 -2.4 3.0 5 2.4 3.7 6 3.4 5.8
*
Piezometer locations are shown in Figure 25.Q=l, 000 m 3 sec 7.6 6.4 6.0 6.1 6.5 7.0
From the performance of this stilling basin it was evident that no changes were necessary in the elevation of the basin floor, or in the height of the end sill. The stilling basin was subsequently reduced in length by moving the end sill upstream in increments of 10 meters. Each modified basin was tested for performance at the maximum dis-charge of 3, 200 m 3
!
sec. Figure 29 shows the hydraulic jump in thestilling basin 85 meters long. In Figure 30 the basin length is 75 meters. Comparing these two figures, it may be seen that the 75-meter basin is too short because the j·:ump extends beyond the end sill. On the other hand, the 85-meter basin was somewhat longer than necessary to con-tain the jump. This was determined from a study of the motion of air bubbles in the basin.
-16-_Baffle piers were installed in the 7 5 -meter basin to develop the 'j 1mp in a sh orter length. Two sizes of baffle pier s, 3. 6 meters and 4. 6
meters high were installed at the midpoint of the basin. For the maximum discharge of 3, 200 m 3
!
sec and for both sizes of baffle pi ers the chute block press ures were positive, but negative pressur es were measur ed on the baffle piers . The 3. 6-met er pier developed a maximum negative pressure of -3 meters and 4.6-meter pier a press..1re of..,s.8
metera . These values are indications of possible cavitation on the piers. Visual observation of the water surfaces in the discharge channel indicated that wave action with either baffle pier ranged from 2 to 2. 5 meters in height. A table of wave heights for the various conditions of stilling basin B is given in Table 7 J.Di scussion with the designers on the res~lts of tests~ ,for ,}he
still-. ing basins at this stage of the investigation,· led to the decision that stilling basin B was superior t o stilling J>asin A on the basis of hydraulic perfor- · mance. It was also decided by the designers that for the initial construc-tion, baffle piers in the stilling basin would not be included because of the associated m aintenance problems. However, it was desirable that tests be made of !he recommended stilling basin with baffle piers to demo~strate
additional stilling benefits. Results of these tests are included in Appen-dix A of this report •
Sti lling Basin _!L with New Tail water Curve - - The new tailwater curve shown in Figure 20 is appreciably lower than the original curve. · It was noted in the previous tests that the original tailwater curve produced a depth in b a sin B that was close to the sequent depth at a discharge of 3,200 m 3/sec. Therefore, in adpoting the new tailwater curve it seemed necessary to lower the stilling basin floor to maintain a comparable relationship between sequent depth and tailwater :depth at a discharge of 3,200 m 3/sec. To check this, the longer stilling basins of previous tests were retested with the new tailwater level and without change in the basin
-17-•
•
floor elevation. The hydraulic jumps formed well downstream from the chute blocks in all the basins tested; was inadequate and somewhat un-stable but was not swept out. It was apparent that the basin floor would need to be lowered.
The stilling basin floor was subsequently lowered 2 meters and basin lengths of 85, 80, and 75 were tested at maximum discharge. These basin lengths were selected for final testing on the basis of the results of previous tests. A 9-meter high end sill was tried. but was found to cause considerable turbulence at the end sill. The height of end sill was reduced 2 meters - to 7 meters high.,: and stilling basin lengths of 85, 80, and 7 5 meters were again tested at maximum dis-charge. The 85-meter basin was found to be longer than necessary because a stagnant zone was developed in the basin upstream from the end sill. The 80-meter basin showed no stagnant zone, indicating suf-ficient basin length for the hydraulic jump. The adequacy of the
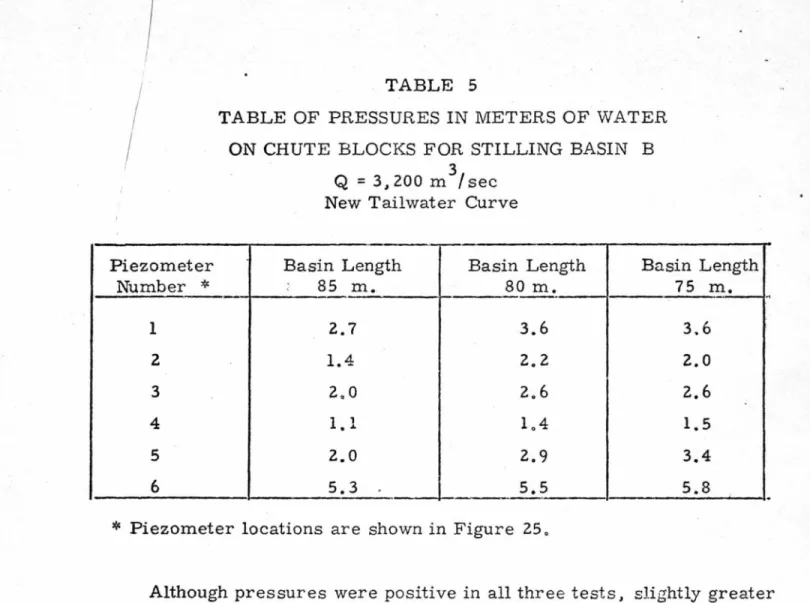
80-meter basin was subsequently proved by testing the 7 5-meter basin. The hydraulic jump for the 7 5-meter basin extended beyond the end sill indicating that the basin was too short. Table 5 shows a tabulation of pressures on the chute blocks for the three basins tested.
-18-I
I
Piezometer Number*
1 2 3 4 5 6 TABLE 5TABLE OF PRESSURES IN METERS OF WATER ON CHUTE BLOCKS FOR STILLING BASIN B
3
Q=3,200m/sec New Tailwater Curve
Basin Length Basin Length Basin Length
85 m •. 80 m. 75 m. 2.7 3.6 3.6 1.4 2.2 2.0 2.0 2.6 2.6 1. 1 1. 4 1.5 2.0 2.9 3.4 5.3 5.5 5.8
*
Piezometer locations are shown in Figure 25.~
.
Although pressures were positive in all three tests, slightly greater values were found when the basin was 80 meters long than when the basin was 85 meters long. This is an indication of the effectiveness of the SO-meter basin as compared to the 85-meter basin. In comparing the pressures for the 7 5-meter basin and the 8 0-meter basin no essential difference is noted. This was because the hydraulic jump extended be-yond the end sill in the 7 5-meter basin ,
On the basis of the tests described above, a stilling basin 80 meters long, having an e"nd sill 7 meters high, wo.s found to be best. Tests for smaller discharges of 2, 000 and 1, 000 m 3
I
sec showed the basin perfor-mance to be satisfactory. See Figures 31, 32, cmd 33 for photographs of flow in the recommended stilling basin at discharges of 3, 200. 2. 000,3 .
and 1, 000 m
I
sec respectively. Chute block pressures for these tests are given in Table 6.I
..
I
TABLE OF PRESSURES IN METERS OF WATER TABLE 6I
ON CHUTE BLOCKS FOR RECOMMENDED STILLING BASIN; Length of Basin = 8 0 m.New Tailwater Curve
Piezometer Q-3, 200 m - 3
f
sec Q=2, 000 m 3I
sec Q=l,OOO m /sec 3 Number* 1 3.6 3.5 7.6 2 2.2 1. 6 5.7 3 2.6 1. 7 5.2 4 1.4 1. 1 5.3 5 2.9 2.7 6.0 6.
5.5.
4.7 6.7•
*
Piezometer locations are shown in Figure 25 • TABLE 7TABLE OF MAXIMUM WAVE HEIGHTS IN THE DISCHARGE CHANNEL FOR STILLING BASIN B
Length of Height of Tail water DISCHARGES
Basin in Baffle piers CUrve
Q=j.
200 Q=2,000 Q=l, 000Meters in Meters m /sec m 3/sec m 3/ sec
95 NQne Original 2.0 1.3 1.0 85 None Original 2.5
--
--75 None Original 2.5--
--75 3.6 Original 2.2--
--75 4.6 Original 2.5--
--85 None New 2.5--
-·-75 None New 3.0--
--80 None New 2.5 1.5 0.7 80 3.6 New 2.0 1.0 0.5 80 4.6 New 2.5 1.0 0.5-20-/
j
Table·? gives values of maximum wave heights in the dischargechannel downstream from the stilling basin. ·
I ..
Scour studies made with 3/4 to 1/4 in. gravel extending beyond the end of a 22-meter long paved channel bottom showed that appreciable ~cour did not occur during a 3-hour test period. The bed material was then changed to coarse sand with a median grain size of 1. 85 mm. This material, although not representative of the bed material in the proto-type, made scour tendencies more visible. In order to determine the . length of bed protection .necessary in the discharge channel, variouslengths of paving which extended downstream from the end sill at ele .... vation 800 were tested. The lengths tested ranged from 12 meters to 42 meters in 10-meter increments. For a discharge of 3, 200 m 3
!
sec and a test period of 30 minutes, about the same amount of scour occurred at the end of each paving length. A typical scour pattern is shown in Figure 34. Scour occurred in .the area where the bed sloped upward from El. 800 m. to El. 802 m. When this sloped section was paved with rip-rap very little scour occurred farther downstream. Figures 35 and 36 show the condition of the discharge channel bed before and after the final scour test. The total length of paving represents 35 meters pro-totype. Although a portion of the total length is solid paving in the model,, rip-rap may be used ·in the prototype. The rip-rap should be graded with jndividual pieces of about one meter in diameter as the upper limit in size.-21-l
!.
The recommended spillway is shown in Figure 37 from the V. THE RECOMMENDED SPILLWAY eginning of the approach walls to the ends of the training walls. The approach channel to the spillway in the preliminary design was wider. , than necessary and savings in excavation might be effected by reducingthe channel to the alignment and dimensions shown in Figure 10.
The spillway approach walls were modified in alignment from the preliminary designs to eliminate the sharp junctions at the approach walls and abutment piers, and to improve the efficiency of the spillway crest. The preliminary designs shown in Figures 2 and 3 caused a sharp drawdown at the abutment piers which in effect reduced the width of the crest. Although the drawdown is not completely eliminated with the new alignment, the improvement is substantial in both the water
surface profile and discharge over the spillway crest.
Because of the abrupt offset at the downstream end of the abutment piers, a water fin formed along the spillway chute walls. At a discharge of 3, 200 m 3
!
sec the fins overtopped the walls of the preliminary design. By reducing the width of the chute so that the walls were in the same vertical plane as the inside of the abutmentpiers~ the fin was eliminated. However, because of the improvement
made in the approach wall alignment 1 which increased the capaCity of the spillway 1 it will be necessary to increase the height of the chute walls immediately adjacent to the downstream end of the piers. The maximum depth of water normal to the chute at this point is about 7. 5 meters.
Stilling basin B 1 with modifications from the preliminary
design~ for hydraulic and economic reasons, is recommended for
use in the prototype. The length of stilling basin can be reduced from 95 met~rs to 80 meters, a reduct ion of 15 meters from the .~reliminary
design. Channel bed protection downstream from the end sill can be
-22-I
reduced from 50 meters to 35 meters in length and may be com.-pfised of graded rip-rap with the maximum size about one meter in
I
diameter. Although the training walls were not investigated in the model because they were not considered to be part of the hydraulic design, they may be ended at the end sill if geological and topographi-cal conditions permit. The sides of the excavated channel may then need to be protected with rip-rap, similar t o the bed . rip-rap.
The stilling basin floor was lowered 2 meters -to El. 793, because of a change in the tail water r ati ng curve. The hydraulic jump in the recommended st illing basin is shown in Figure 31 for a discharge of 3. 200 m 3
I
sec. For this discharge the following condi-tions were measured in the model:D1 = 1. 86 meters D 2
=
20.8 metersWave heights in dis charge channel about 2. 5. meters. From these values the following may be calculated:
V 1
=
36. 4ml
sec. F 1=
8.5~~
=
11.2 and the length of basin=
3" 8 5 D 2.Discharges of 3, 200 m 3
I
sec and less. will be passed safely through the recommended stilling basin " No unusual maintenance problems should be expected on the chute blocks, since pressures will be positive for the entire r ange and no cavitation should occur.The foregoing r ecommendations, based on the model investi-gation, will provide a spillway and stilling basin which will be hydrau.-lically adequate and economical to construct.
..
•.I
I ' REFEREMCESBradley 1 J. N. 1 and Peterka1 A. J. The Hydraulic Design of
Stilling Basins: Hydraulic Jumps on a Horizontal Apron (Basin I) Proc. Paper 1401. A. S.C. E. Jour. of Hyd. Div. Oct. 1957.
Z. Brad1ey1 J. N. 1 and Peterka1 A. J. The Hydraulic Design of
Stilling Basins: High Dams, Earth Dams, and Large Canal Structures. (Basin II) Proc. Paper 1402. A. S.C. E. Jour. ofHyd.Div. Oct.l957.
3. Bradley, J. N. 1 and Peterka, A. J. The Hydraulic Design of
Stilli'ng Basins: Short Stilling Basin for Canal Structures 1 Small Outlets, and Small Spillways (Basin III) Proc. Paper 1403. A.S.C.E. Jour. of Hyd. Div. Oct. 1957.
4. Bradley, J. N., and Peterka, A. J. The Hydraulic Design of Stilling Basins: Stilling Basin and Wave Suppressors for Canal Structures, Outlet Works and Diversion Dams. (Basin IV) Proc. Paper 1404. A.S.C.E. Jour. of Hyd. Div. Oct. 1957.
-24-I
El. 885.0 -, _ C' 'DAM
--,---~--r-, I I I ', I I I I 1 1 1 't-Cofferdom I / I I I ,.I
/
I I I 1 .,-' 1 1 , ..;_... Slope --'-
/ 1 I I _-r ..,...-' _,~1- : ___ ... "" .:.--- I I I---I
~\+ -\ .,.... \ \ I v \ I /~, \ \ I /' \ \ \ I ,_,, \ 'Y' ',_\... - - - -·--'/ 0 50 100 meters SCALECOLORADO STATE ·uNIVERSITY RESEARCH FOUNDADON
MODEL STUDY
MAK/0 DAM SPILLWAY
SITE PLAN OF DAM
AND APPURTENANT WORKS
Drown by ___ S. K.
Traced by __ S.A.
Checked by _S.K .
I
I- I
I
I
-1
I
I I I --400- - ~--- --- 127.0 I I1
,-5.o
I · I , I 1~ I I - ---+--- 102. 0 -- --- - ---+17. 5-rr - 35.0 -- ~ : I Dam 1 I . 1 t..-,6 4-l I . I I I I I I :I
I I :--- - -85.0---1
1
~~ ~:
J:l===jt
-1PLAN
,.-EI. 885.0 ..--- - - =,..., L -,.-£!. 8 70 .0 El. 86 7. O,, /- EI . 870 .0 I I II
I I I I I IA~--
40.0 -- +16.4 --l I I I I I ,-EI. 823.0 E/. 816.0 -, ,-£1. 818.0 / I II
Stilling 8 as in A E/. 810.5 r-~=-=--~-- LI
£1. 800.0 -, El . 802. 0 -1I
~~~==========~~======~==~--~~~~======~
I I I I /I
I I I ~- - - - 127.0 - - - -->-k- - ---
85 .0 -- -.J_ -+ 110 -~17.5 ~-- 35 . 0 -- ~ Ir---:-
I I I I II I 102.0 - - --:-------J 5. OJSECTION THROUGH
.CENTER LINE
100
20 40m SCALE /,.
II
I r--3.2 -~ j2.37 -1 ,crest El. 870.o
I~-.I~
/
/.836 o.e36 I I I ;_ ;'~ =1 .936H y I\
/"~
J... - - -,--,-£1. 868.3 .,.-J /
\
r---
5 .5 1 / I 1 I o --..j I 30I
., '-R=2. 1 \ ~ \EI.8610\I
,,
·- -R= 6 ·8\i
SPILLWAY CREST DETAIL
Scale !"=4m
NOTES
The preliminary design is designated stilling basin A .
The approach walls shown are one of the preliminary designs .
All dim ension s and elevations are tn meters unless otherwise indicated.
COLORADO STATE UNIVERSITY RESEARCH FOUNDATION
MODEL STUDY
MAKIO DAM SPILLWAY
STILLING BASIN A
PRELIMINARY DESIGN
/~-~d>
Approved ~l __ _____ _ I Drown by ___ S . K . Traced by __ _ S. A . Checked by __ s . K.• ! I ' . !
l
I !~I
I . ;-- - -40.0--+---
135.66---:---+---
95.0 --- - ~1~ I II
, --55. 84 ---+j,
I ,~· 1 I I _T _ __ I 1 ll) I I I I I II
~-60
I I I I I I 1.0I
I I ...._ I I . I-t--.1-
I I ~--- - - - --78.0--- - -j 1--!6.4-i I III I
II
- -j I I~~~c=~~~~~~~~~~~~~~~~~~~~~J!========================l:==~~Tt~~-~t~-~~~~~--- .-
1 I I I ~ t\Jc.o
a
a
r-...: Chute <::) ";t~
~
t--.a
lC) - -+--0')_ ....;_I_
f.
Spillway._...., 1 I· ,I -+-- - - - -- - - 1 I I
t-,
I 1 1 ...__< +-Paved 1 I I I I I I I I_i __ _
I I I Apron -... I I I I I "/ ' -1 I_L_;~~~~~~~~~~~~~~~~~~~~~~~~~====================~==lll~~JI~~==~/~/J
__ L _
..¥ I I-- - _L _
PLAN
,-£/. 885.0 r---~~-.L ~-I I 1-EI . 870.0 . I I El. 867.0 .... .... I Ir- - -
40.0-- -1 I I f-16.4-1 I I II
II
I I o , C) ~'<) ..1.. _ _ _ _ / ,-Top of Wall / El . 818.0 Stillinr; 8 a sin 8 E I . 818.0-1 El . 816.0 ) _.1 _ Apron [1 . 802.0 -; : Floor El. 795 .0 -, j ·· 1 ~============~==~~====~====k~~- I I I I I I I I 1 I I I I~ - - -~-- -~ -- -- - 135. 66
---r--- ...
95 .0---+~---
6.0 ...~./
I 49.84 -- ---i ISECTION THROUGH
CENTER LINE
10 0 20 40mNOTES
The preliminary des ign of the stilling basin is shown on Fi g . 2 along with one
approach wall desi gn .
The alternate design of approach wall and stilling basin ore shown on this drawing.
For crest detail see Fig . 2 .
All dimensions and elevati ons are in meters unless otherwise indi cated .
COLORADO STATE UNIVERSITY RESEARCH FOUNDADON
MODEL STUDY
MAKIO DAM SPILLWAY
STILLING BASIN 8
ALTERNATE PRELIMINARY DESIGN
Drawn by __ _ S. K .Traced by ___ 5 . A .
-r-
T--1 I I II I
II
"
Ia
I -I I ~ ~I Ia
I ' I OJI
I I !-I -I
I
II
II
I
I ..
C::
I
"'t Diffuser--I ~--- 12'-o" - - - -- - - ---1 II
I
f
Crest 1 I , -Wove Dampinr; ( Board'
~-Grovel Bed .. T- · I I Toil Gate- - "' / .---..~~~=r~~~~~~~==~~Fp=,- -T -- --T-f I 1 Secondary Dam--, Outlet I I I I ~ Ia
I ' I l"r) I I I ' I .3 16 I)'
-- - - 1.0--- ---p --
----Line of
~1;:;
1r---,. 1-Stilling We ll Tap 1Piezometers ) in Floor of Model
1
see
spi//way.:?r::::~::===-=====rr=:===========r====f1Wlllli;~~~~~~l
"a
1SPILLWAY CREST DETAIL
LOCATION OF PIEZOMETERS
Crest 1 ... 1 1
Detail , Manometer Board 1 1
I
i I l"r)1 I I I II I .. 1 I . I for Crest 1 f.. l!_§_ +ll,31 + -r-- 9 .. 1 I Piezometer s I I 32 I o 4 I I 332 I I
~--~~---~---~~---~~---~======~=====r~=====d~~==~====~ ---i- - - - 1
•I I I I I ..,._,..Tallwater I I I I I I 3" 6-1/ -8 1 II
I Stilling We/1 1 1 I I II I I , " • I ! " I I II I , ~--- - --r-- --- -
4-?J.j_ - -- -~ - 1 -tO L-T -- 2- 2 - -~--- - -- 6-0 - - - -+ 1-9 --I 6 4 I 6 4 I 4 I I I ::- I ~~~ 0) I ,~ I I I Gate I 1 o II
C) II
. "'),
_L - --- - - _
I . _i_ _ _ _PLAN
Secondary ~---==-=,.----+----... D om.., - J Fols e Floor - .., ;' / Stoff Gage - \ I ::::::::--Screen,'
I I - 0- Gro veJ ~-?; --" I I ;L1.---=~~=====-='==fl~,_.,b,========9
I I I I ' 3 II I I 6 I H 3 !" I I " I ~ -1 6-11- -- - - -t--- - -- - 5-6-- - - -- -+11-+ - -
2-2- - --1 , -Adjustable ( 1 Tai l Ga t e INOTES
In this schematic dra wing only the approach wolf orran·qement and basin A are shown .
warped s t illi ng Stillin g basin B wa s obtaine d by remov ing
the false fl oor arran gement 1n t he model .
Model s c ole I : 60
COLORADO STATE UNIVERSI TY RESEARCH FOUNDATION
MODEL STUDY
Inlet Pipe -< . . 8 I 64 I 64 I 4 1 Trap Sand To Sump
MAKIO DAM SPILLWAY
Floor
Elevafton-77 ~ Elevafton-77Elevafton-777
777 7 7 77 777 7 777 7 7 77 777777 7777 7777 7777 7 777 7 7 7 77/ ;) 7 7 / /7/) 77777777 7 7 77SCHEMATIC DR AWING
OF
MODEL
PROFILE THROUGH CENTER LINE
I " I ' .. I
!---9 ~ - 1-0 --j
I Drawn by __ M.Sh. A . _/?/~ /
Traced by __ 5 . A . Approved
I
I
I
I
IFig. 6 Flow pattern in approach channel with vertical walls in preliminary design of Figure 2.
Fig. 7 Flow at spillway crest with vertical walls in preliminary design of Figure 2.
Fig.
8
Fig. 9
Flow at left vertical approach wall for preliminary design of Figure 2.
Flow at wall for the alternate design of approach wall of Figure
3.
/
II
I
I
I
I
I
I
I
I
I
I
I II
I
I
I
I
I
II
I I I II
I1 ,.----Rip Rap as Necessary __ _
,--1 ~ T) ... \ ' ... / 1 - - - / _, l'
-// €;;---
---/Channel--~--~
_FLow
1L
0 10 20 30m SCALE Q~ ,'J~
1 r- / I ~ I ' S, S I I ·0 j. / --~ 'A~
~
~Concrete
~
Apron - --... - _,.. ' r_,COLORADO STATE UNIVERSITY RESEARCH FOUNDADON
MODEL STUDY
MAKIO
DAA1
SPILLWAY
RECOMMENDED APPROACH
CHANNEL AND WALLS
Drown by __ _ S . K . /._/ ~ .
Traced by --- S. A . Approved -
7
~-Checked by __ S.K.
I
I
1;'. .. l.g. 1;'. . 1g. 11 12Flow pattern for recommended
approa·ch wall design of Figure 10.
Flow along left wall with recommended approach wall desig n of Figure 10.
I
I
Fig. 13 Flow Ln chute with preliminary approach ,.,.all design and c.hute width.
Fig. 14 Development of fins below piers. Note particularly the fin at the chute wall.
I
I
)
Fig. 16
Fig. 17
Flow along chute wall with recommended spillway chute for discharge of. 3200 m3/ sec. Abutment pier and chute
wall are in the same vertical plane.
Flow along chute wall with recommended spillway chute for discharge of 2000 m3/ sec. Abutment pier and chute
<.1) ~ <l)
-
lb ~ -c;::. -~....
~ ::::.. Cb --l.u ~c
::::.. ~ Cb <.1) Cb tt: 887 86 885 84 83 82 81 880 79 78 77 76 875717
I
870 0 200 400 6001
I
I
Max. Reservoir Elev. 883 · 5 7 - \ . 8 9
l
_2.- __
r---+-t
4 ,_ __--~75.-
f---+-A _-r - .
,_-;v- i -~ -
V ,__- 7-
~-!--- ·-
v /
v
/
v .
7
/
--1- ,
/
/ . /
/
/
BOO 1000
Gate Openin9 i s tfhe Vertical Distance Between the Lower Lip o f Gate 8 Sill El. 869. 843
1200 1400 1600
Discharge Over Spillway 4 Gates Opened Uniformly
I
1800 . 2000 2200 2400
2800 2600
3000
COLORADO STATE UNIVERSITY RESEARCH FOUNDATION
MODEL STUDY
MAK/0 DAM SPILLWAY
SPILLWAY RATING CURVES
Drown by __ M.Sh .A. Approved
~
/ / " .Traced by__ S . A .
-· ~
--Checked by __ S .K .2 .2 4.00
1----
~ 3.75 ~"='
I--"
....
_...
11'1 2 . 0~
(") ~ ~ 3 .50"='
....
v
/ C) <:I 11'1v
(1) (") :---~ / 3. 25 1.8v
Coefficient of Discharge, C , in C) C) C)/
O=CLH'/z (Free Flow)-(1) ...._ ~
/v
3.00 C) where 0 = Discharge ... C) ...._I. 6 L = Clear len9th between
:--
..._v
p i ers , and - ... ~I
2.75 (1\ C) H =Head on crest . (1) ...I
("") -:3'1M
I . 4 2.50 (1\I
(1) ("")-
2800 3200 3600 4000 1.2COLORADO . STATE UNIVERSITY RESEARCH FOUNDATION
MODEL STUDY
1.0
MAK/0 DAM SPILLWAY
0 400 BOO 1200 1600 2000 2400
DISCHARGE COEFFICIENT
Discharge 0, m /sec 3
CURVE
Drown by ___ M. Sh. A.
Approved
~~--Traced by __ 5 . A .Checked by _S . K.
'
.
- - ----.---- - --
- -
---.-.
-·- . --·- . - ~-- - - ·-·-·---
--~-7<'.. ., ....
~·v
814~0~8)
~
.../
/ i
II
I
~..,
812 (/)Original Toilwoter /
v
ANew Toilwate/I
c::
/
I
...
Rating Curve', Rating Curve
...., I Cl (')
1/
/
CbI
r,.,--
I
Cb 810"'
/
/:(8100)
I Cl ...-.
I
C) ;::, I--
v
/v
II
~I
I
I
808 ,/
I
I / I I I/~6.3)
II
I:
I I 2500 3000 3500 806/
II
I
I
I
COL GRADO STATE UNIVERSITY
1-I RESEARCH FOUNDADON
I
MODEL STUDY
804 I
I
IMAK/0 DAM SPILLWAY
500 1000 1500 2000
Discharge 0, m /sec 3
TAIL WATER RATING CURVES
Drown by __ M.Sh.A.
Approved/~~-Traced by __ S. A.