Mobile application onboarding
processes effect on user attitude
towards continued use of
applications
PAPER WITHINInformatics
AUTHOR:Emelie Parflo and Hanna Eriksson TUTOR:Bruce Ferwerda
This exam work has been carried out at the School of Engineering in Jönköping in the subject area Informatics. The work is a part of the three-year Bachelor of Science in Engineering program. The authors take full responsibility for opinions, conclusions and findings presented.
Examiner: Vladimir Tarasov Supervisor: Bruce Ferwerda Scope: 15 credits
Abstract
The growing popularity of smartphones in recent years has led to an increase in mobile application development and use. However, a large number of mobile applications are only used once before being removed. For companies and organizations to spend time and money on application
development only to achieve low user retention rates is unsustainable. During their first interaction with a mobile application it is crucial that users find functionality and value quickly to avoid discontinuation of use. User onboarding is often implemented in mobile applications to aid in first time interaction, making onboarding processes subject of investigation for effect on user attitude towards continued use of mobile applications.
The study examined mobile onboarding processes and their effect on user attitude towards continued use of applications as well as the difference between onboarding processes effect on user attitude towards continued use of applications. The study was conducted within-subjects through a survey consisting of interaction with two prototypes with different onboarding processes and a questionnaire based on the technology acceptance model in order to investigate the variables of interest. The results of the survey were analyzed to measure the effects of the onboarding processes on the factors of the technology acceptance model and to investigate the differences between the onboarding processes. The results showed that user onboarding has a positive influence on perceived usefulness, attitude towards use and intention to use. There was no significant difference between the different types of onboarding patterns effect on attitude towards continued use. The positive effects on attitude and intention to use confirmed that implementing onboarding processes in mobile applications could be beneficial for value proposition and user retention. The perceived usefulness proved to be the determining factor on attitude and intention to use.
Keywords
User Onboarding, Mobile Applications, Technology Acceptance Model, User Attitude, User Experience Design, User Interface Design, User Retention.
Contents
1 Introduction 5
1.1 Background 5
1.2 Purpose and Research Questions 6
1.3 Delimitations 6 1.4 Limitations 7 1.5 Outline 7 2 Theoretical Background 8 2.1 Mobile Devices 8 2.2 User Onboarding 10 2.3 Value Proposition 12 2.4 Customer Retention 12
2.5 Technology Acceptance Model 13
3 Method and Implementation 15
3.1 Method 15
3.2 Implementation 17
4 Findings and Analysis 20
4.1 Demographics 20
4.2 Onboarding Process 1 23
4.3 Onboarding Process 2 23
4.4 Comparison of Processes 24
5 Discussion and Conclusions 25
5.1 Discussion of Method 25
5.2 Discussion of Findings 26
6 Appendices 29
Appendix A Survey Results 29
Appendix B Prototypes 30
Appendix D Data Analysis 32
1
Introduction
With the development and popularity of smartphones in recent years user behavior has changed and mobile applications are becoming an essential aspect in fulfilling daily activities. Although usage of mobile applications has increased, 62% of applications are used only a few times before being removed (O'Connell, C. n.d.). With the increase in supply and variety of new applications and services, aiding users in quickly understanding and finding functionality and value of a product has become more important (Alvarez, R. D. 2018). The first encounter with a mobile application is a determining moment whether a user will continue to use the product, users seldom give an application a second chance if the first impression fails (Crumlish, C., & Malone, E. 2009).
Onboarding is the process of introducing and teaching a new user the functions of a mobile
application (Crumlish, C., & Malone, E. 2009) and is often implemented in applications to aid users in finding value (Balboni, K. n.d.). Onboarding can provide that crucial first impression as it is the only part of the mobile application that every single user will experience (Traynor, D. 2016) and forms the bridge between the users desire for value and the value that the application can offer. The aim of this thesis is to investigate different mobile onboarding processes effect on user attitude towards continued use of applications. The problem will be examined through the creation of two prototypes with different onboarding processes, which will be tested and compared through interaction and a
following survey. This thesis has been carried out as a final project work in informatics and a 15 credit course as part of the New Media Design program at Jönköping University School of Engineering.
1.1 Background
The increased popularity of smartphones and user applications has transformed user’s internet behavior. Daily activities like shopping, socializing and entertainment can now be accomplished through mobile devices wherever and whenever by users every day. According to Statista, it is forecast that the number of smartphone users will grow from 2.1 billion in 2016 to 2.5 billion by the end of 2019 (Statista. n.d.). This rapid growth of mobile device dependency places an increased demand for mobile applications. As a result, mobile applications accounted for nearly half of the global internet traffic in early 2018 (Statista. n.d.) indicating that consumers are continuously choosing mobile over desktop devices. Although usage of mobile applications has increased, 62% of applications are used only a few times before being removed (O'Connell, C. n.d.) and 21% of users abandon applications after the first use (Rodde, T. 2018). One key reason why users choose to discontinue using applications is that mobile applications fail to facilitate user needs with ease (O'Connell, C. n.d.). If users fail to understand the value or benefit of the use of an application it is unlikely that they will return to it.
To meet the demands placed by consumers many companies are investing in mobile applications as there is a variety of benefits to gain. Mobile applications contribute to the improvement of overall accessibility, customer engagement, brand recognition and value proposition as well as offer a unique channel for sales (Tarcomnicu, F. 2017). The potential earnings of a mobile application are high and revenue for mobile applications globally is projected to reach 188 billion by 2020 (Charuza, P. 2018).
However, mobile application development is a costly process that often requires a vast amount of resources dependent on the application type and platform (Tarcomnicu, F. 2017). If user retention rates are low, the time and money spent on mobile applications end up as missed business
opportunities, which ultimately contribute to an unsustainable business model.
In order to achieve higher user retention rates, it is pivotal that users continue to use a mobile application. The first impression when using a mobile application is crucial as it may determine whether users will continue to use it or not. If the first impression fails users seldom give an application a second chance (Crumlish, C., & Malone, E. 2009). To ensure a good first impression, onboarding is often implemented in the application. Onboarding is the process of introducing and teaching a new user the functions of a mobile application (Crumlish, C., & Malone, E. 2009).
Onboarding aids users in the understanding of functionality and value of a product (Balboni, K. n.d.). Without direction or purpose, many users can feel lost, overwhelmed and confused (Crumlish, C., & Malone, E. 2009). By enhancing the first-time user experience and providing new users with guidance into understanding the core value of products, (Johnson, R. 2015) users may be more likely to use an
application. The purpose of this thesis is to investigate the effect of different onboarding processes on
users attitude towards continued use of an application.
1.2 Purpose and Research Questions
The purpose of this thesis is to investigate mobile onboarding processes and their effect on user attitude towards continued use of applications. This was investigated by creating, testing and comparing two prototypes of different onboarding processes. A survey containing prototype interaction and a following questionnaire was carried out in order to measure the usefulness of
onboarding in terms of change of attitude towards continued use. To fulfill the objective of this thesis, the following research questions were investigated:
1. What effect does onboarding processes have on user attitude towards continued use of applications?
2. What is the difference between different onboarding processes effect on user attitude towards continued use of applications?
1.3 Delimitations
The prototypes used in this study were constructed using the software Sketch and presented using InVision. Therefore, the prototypes are limited to the capacity of the software. The prototypes were adapted to mobile view on the iOS platform and did not take other platforms into account. The prototypes were limited to the onboarding process of the chosen application type, a generic travel application. The onboarding processes tested in this thesis were tailored to the application type chosen through combined elements of identified onboarding patterns. The onboarding patterns identified were limited to those researched in the theoretical background. The prototype interaction did not cover full application functionality but focused on the user journey from start of the application to the end of the onboarding process.
1.4 Limitations
The prototypes designed and tested in this thesis are limited to the designers knowledge of
onboarding, design theories and UX principles. The software used for prototyping and presentation may have effect the quality of the prototypes. The platform and application type tested may have affected the result. The project is time limited and time spent on designing, creating and optimizing the prototypes was limited. This project had no budget or funding and was limited to the resources at hand. The test persons used in the research was limited to a selection of people that the researchers could reach and no specific demographics were targeted. The presentation of the survey and prototypes on various devices was not controlled and the prototype interaction solely relied on instructions and was not directed or surveilled.
1.5 Outline
This thesis gives an analysis of onboarding processes effect on user attitude towards continued use of applications. The Theoretical Background section of this report covers what has already been
established in previous research on onboarding, including onboarding guidelines and patterns as well as related topics to provide an overview of the subject. The third section, Method and Implementation, describes how the study was constructed and carried out. In the chapter Findings and Analysis, the results of the study are presented alongside an analysis of the results. The last chapter Discussion and Conclusion covers the strengths and weaknesses of the method. Here the results of the study are discussed based on the theoretical background and analysis with the purpose to answer the research questions presented in the introduction. To conclude, the final chapter includes a discussion of further research on the topic.
2
Theoretical Background
2.1 Mobile Devices
As mobile usage is increasing and surpassing desktop use, designers and developers have to shift their focus to design for mobile first (Staff, Creative Bloq. 2012). Mobile devices are very different from desktop devices, not only in size, but in interaction, usage and features (Staff, Creative Bloq. 2012). Mobile devices refers to any handheld computer devices such as smartphones, tablets, and
smartwatches. Mobile devices provide a wide range of different integrated features such as internet access, cellular network access, global positioning systems, cameras, orientation and motion sensors, and interactions are often touch based through touchscreens (GCFGlobal. n.d.). Mobile operating systems integrated in mobile devices often provide them the ability to run mobile applications with specialized functions that can be accessed anywhere and at all times by users (GCFGlobal. n.d.). Mobile devices are highly personal and are always with the users through their everyday activities, keeping them connected and presenting countless unique contexts of use (Staff, Creative Bloq. 2012).
2.1.1 Mobile Applications
A mobile application, or an app, is a type of software that is designed to run on a mobile device such as a smartphone or tablet (Cuello, J. & Vittone, J. 2013). Compared to websites, applications need to be downloaded to the mobile device before use (Cuello, J. & Vittone, J. 2013). They are available through different distribution platforms such as the Apple App Store or Google Play. Mobile
applications help users connect to a variety of internet services whilst offering a more interactive and intuitive experience than a mobile website (Viswanathan, P. 2019). The purpose of applications can vary widely, ranging from utility, productivity, navigation, entertainment and more (Viswanathan, P. 2019).
2.1.2 Mobile Interface Design Guidelines
User interface design is the study that focuses on simplifying the usage of a computer system (Gong, J. & Tarasewich, P. 2010). Interfaces for mobile devices is a challenging context where time and attention is limited, and therefore, demands design and function that is fast, easy and useful (Alvarez, R. D. 2018). The trends for mobile interface design are constantly changing as technology advances and allows for new and creative solutions. There are many different tips, guidelines and fundamental design principles to consider when designing and developing mobile applications. The first common tip to mobile interface design is to keep the design simple and focused on the core functions and differentiators that makes the application unique. Functionality should be user-centered with a focus on what is valuable to the users and their needs (Staff, Creative Bloq. 2012). The interface should be neutral, content-focused (Babich, N, Shopify. 2018) and blend with its functionality (Apple
Developer. n.d.). Performing frequent operations should remain short and be designed in a way that makes usage effortless and require little memorization to repeat these frequent tasks (Gong, J. & Tarasewich, P. 2010).
A user should be provided with informative feedback on an action and interaction that the user can understand (Gong, J. & Tarasewich, P. 2010) such as providing visual representation in response to a user’s action to clarify the result (Apple Developer. n.d.). This includes providing the user with an indication to confirm their position or completion of a task (Gong, J. & Tarasewich, P. 2010). Feedback should be provided for confirmation of actions as well as for errors and system processes (Staff, Creative Bloq. 2012). The interface should be designed in a way to avoid errors, such as through the size and placement of buttons. Should a mistake or action occur there should be a simple method for the user to reverse their actions (Gong, J. & Tarasewich, P. 2010). It is also suggested to provide guidance by looking for parts of the user journey that may be difficult for users and provide assistance in those areas (Babich, N. Shopify. 2018).
A user should always feel like they are in control of the system and not that the system controls the user (Gong, J. & Tarasewich, P. 2010). Design for enjoyment is a key influence of designing user interfaces for mobile devices. Applications should feel personal, human, friendly, fun and reliable (Staff, Creative Bloq. 2012) as well as adaptable to user needs to create an enjoyable and personalized user experience (Babich, N. Shopify. 2018). An overall enjoyable user experience can invoke a positive affective response from the user (Gong, J. & Tarasewich, P. 2010). Mobile applications should be designed to function in dynamic contexts and for split attention (Gong, J. & Tarasewich, P. 2010). This is because users will access and use the application under varied conditions, such as weather and location, as well as during a variety of distractions. These external distractions may affect the users interaction with applications (Staff, Creative Bloq. 2012.). There should be a consistency in the design between devices for a platform or application (Gong, J. & Tarasewich, P. 2010). This consistency can be achieved by using familiar interactions, navigation, terminology and actions (Apple Developer. n.d.). A feature that is increasing in use is gestures for navigation and users are now ready to adapt to gesture-based interfaces (Babich, N. Shopify. 2018.). It is important to remember that gestures are invisible to users and may need introduction and multi-touch should be used with care as it requires the user to use two hands (Staff, Creative Bloq. 2012).
2.1.3 UX Design Principles
In order to produce a successful mobile application design, user experience design and user experience principles must be considered. User experience is defined as user interaction with any product or service (Schmidt, A. 2010). A well designed user experience brings value to both customers and businesses by providing products and services that ensure customer satisfaction and builds brand loyalty (Hassenzahl, M. 2008). User experience design aims to make the user experience as easy, efficient and pleasant as possible to fulfil the needs and meet the expectations of users (Hassenzahl, M. 2008). Information architect and user experience pioneer Peter Morville outlines seven factors that describe user experience (Morville, P. 2004);
● Useful ● Usable ● Findable ● Credible
● Accessible ● Valuable
The first factor, useful, means if the product has a purpose. The application’s purpose can be practical or non-practical, as long as the purpose is what the user wants (Morville, P. 2004). Usability concerns how effective a product or process is in helping the user achieve their end goal. The third principle findable means that content within a product is easy to find. Credibility is about how trustworthy a product feels that it will fulfill its purpose. The UX factor desirability is about using aesthetics, branding and image to create a product that is enticing. Accessibility means your product can be used by users with different abilities including those with disabilities. The last factor is valuable, which means the product should deliver value to the user (Morville, P. 2004).
2.2
User Onboarding
With the big supply and variation of applications today, it can be difficult for users to quickly understand the purpose and functions of a given application. Onboarding is often included in mobile applications to teach users how to use a mobile application from the first-time usage until the end of the first session (Crumlish, C., & Malone, E. 2009). The first time user onboarding experience of a mobile application is crucial because if the first impression fails, users seldom give an application a second chance (Crumlish, C., & Malone, E. 2009). Good onboarding helps users find success quickly so that users can discover the value of a product. This can be done by pointing to features and
functions that will help solve the users problem (Balboni, K. n.d.).
2.2.1 Onboarding UI/UX Patterns
There are many different approaches to creating onboarding processes. Different onboarding patterns can be combined and tailored to shape the user experience. The onboarding process varies between applications but there are common recurrences in onboarding solutions. Appcues analyzed over 500 user onboarding experiences and categorized them into eight common onboarding patterns. These patterns are combined in different ways to form unique onboarding processes tailored for the mobile application in question.
The first pattern introduced by Appcues is the welcome message, which is very commonly included in onboarding processes to start the onboarding sequence. The welcome message provides the user with a welcome text and the opportunity for action, such as a product tour or walkthrough (Balboni, K. n.d.). The welcome message typically uses a modal window with a transparent background or full
screen, where modal seems to be preferred. The second user onboarding pattern described by Appcues
is product tours, which walks the user through a series of steps introducing it to key features that may otherwise be missed. The goal of product tours is to help orient new users and help them reach their
first moment of value (Balboni, K. n.d.). Product tours typically consist of tooltips, which are boxes
with pointers giving attention to specific features within the application. Typically, this pattern only uses 3-5 tooltips with short copy on the value of the feature, whilst also providing an indication on
how far the user has reached in the tour (Balboni, K. n.d.). Appcues continues by introducing the
or dashes implemented into the UI to motivate users in completing a series of steps. This onboarding pattern is most effective when each step shows a substantial progression which makes the user feel like they have already achieved something (Balboni, K. n.d.).
The next onboarding pattern introduced by Appcues are checklists, which similar to the progress bar encourages progress by providing a visual representation of completed tasks and how much of the task is left. Checklists are most common for complex multistep tasks, as it turns them into smaller
achievable steps (Balboni, K. n.d.). They work best when presented contextually to remind a user that
tasks still need to be completed. Appcues further presents the relatively new onboarding pattern hotspots, which is a mix between notification badges and tooltips. Through implementing tooltips contextually, hotspots offer users information about features without interrupting the user workflow
(Balboni, K. n.d.). Hotspots are typically used to call out non-essential features using UI such as a
pulsating animation to catch a user’s attention. Appcues proceeds to introduce the action-driven
tooltips which is an onboarding pattern that guides the user through a series of steps, whilst requiring an action from the user in order to progress onto the next step. This onboarding pattern provides instructions while highlighting elements such as form fields or buttons, to guide the user through the application (Balboni, K. n.d.). The seventh pattern introduced is deferred account creation, which is a common onboarding pattern that lets users experience the value of an application before requiring
users to sign up (Balboni, K. n.d.). The last onboarding pattern presented by Appcues is persona based
user onboarding. This pattern asks users to select options to personalize their user experience of the product. Personalized user onboarding typically requires a signup process and works best when the
user is presented with 2-5 choices (Balboni, K. n.d.). All these onboarding patterns can be combined
in different ways to create an onboarding processes for a mobile application. The combination options are endless and require the creator to decide which patterns to combine in order to form an onboarding processes that is suited to teach the user about the application functionality.
2.2.2 User Onboarding Guidelines
The topic of user onboarding has been discussed by mobile application developers and technology blogs for some time. These discussions can provide a basis of recommendations on what makes a
good user onboarding experience and many common themes arise in the proposals to what classifies
good onboarding processes. The first common recommendation given to optimize the onboarding experience is that user onboarding should be focused on enhancing the value proposition and
introducing basic functionality (Johnson, R. 2015). Any guidance should be short and straightforward, focusing on what value the product can offer the user (Akbar, H. 2016). If guidance is given, offer the user a representation of progress (Johnson, R. 2015) or allow users to skip the tutorial (Apple
Developer. n.d.). Primarily an app should be intuitive, if a tutorial is required, keep to the essentials and make the learning engaging by incorporating animation and interactivity (Apple Developer. n.d.). The use of text and language also plays a role in the user onboarding process. Language within the app should feel personal and text should be kept to a minimum (Johnson, R. 2015). Functions should not be explained in extent, but rather convey the basics and encourage users to continue to engage with the application (Johnson, R. 2015). It is also suggested to let users engage with an application by using interactivity and gestures to make activities flow seamlessly (Johnson, R. 2015). Furthermore,
researchers suggest to keep the onboarding simple. A signup should ask for the minimum amount of information (Akbar, H. 2016) and collect this user information as quickly as possible (Johnson, R. 2015). It is recommended to consider login options such as social media logins, account creation through email, as well as experimenting with timing; when to ask the user to sign up (Johnson, R. 2015).
2.3 Value Proposition
One important aspect of onboarding is making your users understand the core value, or value proposition, of a product. A value proposition is an analysis and quantified review of the business benefits, costs and value that a company can deliver to prospective customers and customer segments (Barnes, C., Blake, H., & Pinder, D. 2015), often through a provided product or service. The benefit of a strong value proposition is that it differentiates a product from its competitors, which can give consumers a reason to choose a product over competitors (Hassan, A. 2012). The value proposition also defines the value which makes it easier for users to understand the benefits of the given product. Mobile applications that offer more value are perceived as more interesting to users which is reflected on consumer intended behaviour (Anckar, B., & D'incau, D. 2002). Ensuring a well-performed deliverance of the value proposition that meets customer expectations will build trust and lead to higher conversion rates (Hassan, A. 2012). To meet customer expectations, it must be considered that value is not only defined by the value proposition, but by the users perceived value. What is perceived and defined as valuable is highly personal and the users perceived value of a product can be
summarized as the customers overall evaluation of the perceived benefits and sacrifices of a product (Zeithaml, V. 1988).
2.4 Customer Retention
Once customers have been initially acquired through a buy or use of a product or service, it is up to the company to make customers return. Customer, or user, retention refers to the ability of a company to retain its customers over time and can be measured through the retention rate, the percentage of retained users over time (Galetto, M. 2018). High customer retention is when a customer of a product or service returns to, continues to buy or use a product. This also means the customer has not moved onto a competitor product or service. Attracting, educating and converting new customers to a product or service is a tedious and costly process and customer retention is the preferred alternative as it is cheaper, faster and easier to market to already acquired customers since they have experience of the product or service. As a result, it can be said that customer retention contributes to a more sustainable business model and company growth (Galetto, M. 2018).
Overall satisfaction, quality as well as high levels of trust and commitment result in higher customer retention rates, where quality relates to how a user perceives a product or service performance in terms of rewards and sacrifices (Hennig-Thurau, T., & Klee, A. 1997). In a high-commitment relationship, a slip in quality may not endanger the whole relationship, but in a situation where the relationship is not established it is more likely that a single incident may result in termination by the customer (Hennig-Thurau, T., & Klee, A. 1997). In a user onboarding process where the user has a
first interaction with an application and a relationship has not yet been established, the overall satisfaction and quality could affect customer retention.
2.5 Technology Acceptance Model
A variety of theories and models have been developed through the years as to aid in understanding and explaining user behavior and the reasons behind the usage of technology. The technology
acceptance model developed by Fred D. Davis in 1989 is a popular and widely used theory which has been successfully applied in various research on information technology (Venkatesh, V. 2000). The model has proven its capacity and validity in predicting and measuring user behavior in technology acceptance. By technology the model refers to information technology (Davis, F. D. 1989), which includes the handling of data by systems and devices such as computers and mobile phones, and systems within them. The aim of Davis technology acceptance model was to determine the reasons behind acceptance of computer technology that could explain, predict and reflect user behavior across a broad range of computer technologies (Davis, F. D. 1989).
The technology acceptance model is based on the theory of reasoned action which aims to explain the relationship between attitudes and behaviors within human action (Wu, J., & Wang, S. 2005). The theory of reasoned action suggests that user behavior is determined by behavioral intention, while the two key determinants on behavioral intention are attitude and subjective norms (Ajzen, I., & Fishbein, M. 1975). Davis expanded the theory of reasoned action by replacing the determinants for attitude with technology acceptance measures and hypothesized two specific variables, perceived usefulness and perceived ease of use, to be fundamental and determining factors of technology acceptance (Davis, F. D. 1989). Davis defined perceived usefulness as “the degree to which a person believes that using a particular system would enhance his or her job performance" (Davis, F. D. 1989), meaning how much a user perceives a technology to aid in the execution of a task, and defined perceived ease of use as "the degree to which a person believes that using a particular system would be free from effort" (Davis, F. D. 1989), meaning how easy to use the user perceives the technology to be. Through the two factors Davis indicated that users would be more likely to accept technology if they thought it would improve and streamline the execution of a task (Davis, F. D. 1989). Additionally, studies have shown that an increase of technology acceptance can also occur through the perceived of usefulness and ease of use of related elements of the technology (see for an overview of studies Marangunić and Granić, 2015). Davis developed and validated new scales through which the two factors perceived usefulness and perceived ease of use could be measured (Davis, F. D. 1989).
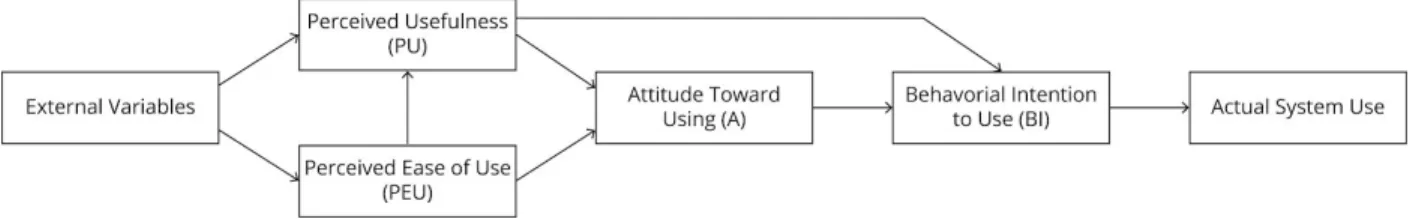
The technology acceptance model explains the relationship between the perceived usefulness and perceived ease of use and their effect on attitude toward use and behavioral intention to use. Attitude toward using refers to the users thoughts or feelings towards use, while behavioral intention to use means the users aim or plan of using a technology. Furthermore, the model demonstrates the effects of attitude on behavioral intention to use and ultimately the actual use of a system determined by the behavioral intention to use (Davis, F. D. 1989). The model accounts for other factors that could affect the perceived usefulness and ease of use which are referred to as external variables, as seen in figure 2.1. Dennis A. Adams repeated the study by Davis and concluded that user perceptions of perceived
(Adams, D. A., Nelson, R. R., & Todd, P. A. 1992.). Adams further stated that a variety of factors such as user experience, type or sophistication of system use as well as other task and user
characteristics may mediate the relationship between ease of use and perceived usefulness (Adams, D. A., Nelson, R. R., & Todd, P. A. 1992.). The technology acceptance model has been further
developed, refined and validated through research as many researchers suggested it needed integration with additional variables (Wu, J., & Wang, S. 2005). Despite its revisions, the technology acceptance model is a validated theory that offers measures which can be applied in the evaluation of onboarding processes in mobile applications effect on the constructs of the model. As onboarding processes are part of the first impression and full experience of an application, onboarding processes are part of the technology of interest. By applying the technology acceptance model, it can be investigated whether the processes affect the continued use of the application.
Figure 2.1 Technology Acceptance Model (Davis, F. D., Bagozzi, R. P., & Warshaw, P. R. 1989.).
3
Method and Implementation
3.1 Method
The study aimed to evaluate the technology of interest, mobile applications with an onboarding process. As onboarding processes are part of the first impression and full experience of applications, it was of interest to investigate the onboarding processes in mobile applications effects on continued use of applications. A quantitative research method based on the technology acceptance model (Davis, F. D. 1989) was used in the study, consisting of a survey including prototype interaction and a
questionnaire. The original technology acceptance model was deemed as a credible base for the study as it is a validated model, which offers measurement tools for the constructs of interest in evaluation of the onboarding processes in mobile application effects. To investigate the research questions the main effect of interest was whether the onboarding process influenced the behavioral intention to use, meaning the continued use of the application, as well as if this influence was positive or negative and whether there was a difference in the effect between the processes tested.
To test onboarding processes in mobile applications effect on the factors of the technology acceptance model (Davis, F. D. 1989) two prototypes of two different user onboarding processes were created, tailored to a travel application. The prototypes were used for user interaction and evaluated through a questionnaire. The questionnaire was developed based on the measures provided by Davis (Davis, F. D. 1989) and the responses were collected using a Likert scale of 1 to 5. The survey carried out was divided into a series of steps, guiding the participant to first interact with the prototype in question and continue by filling out the corresponding questionnaire. The study was conducted within-subjects, meaning that participants tested both conditions in form of both of the prototypes.
The aims of the technology acceptance model is to predict and measure user behavior in technology acceptance (Davis, F. D. 1989). The method of choice allowed for the collection of quantitative data. The data facilitated answering the research questions by providing sufficient data to measure the effects of onboarding on the continued use of mobile applications, for comparison of the differences between onboarding processes as well as enabling making predictions on users on a larger scale.
3.1.1 Prototyping
The first step of the research process was to design and create interactive prototypes that were to be tested. To create the prototypes the prototyping tool Sketch and prototype presentation service InVision was used. The prototypes were adapted for the mobile device Iphone SE and the operating system iOS. The prototypes covered two onboarding processes that combined elements of onboarding patterns and guidelines tailored to suit the application. As there was no real application to be used in testing, the prototype was based on a generic travel application with functions such as search for accommodation, flights or car rentals by asking the user to provide destination, travel dates and the number of travelers. The value that the prototypes introduced is that the user can quickly and easily book their travels through the application. The study was not aimed at any specific gender, any specific profession or income level and covered ages above 18. A travel application was selected as it
suits a wide range of user groups in terms of age and gender. As people of any age may have traveled or plan to travel at some point in their life for work, school or holiday (Tours. 2017), anyone who wants to book a trip is a part of the target audience for travel applications. Any choice of application would have inflicted upon the results, however the travel application was deemed to have a small impact in comparison to other types of applications, not excluding that others could have performed equally or better.
To create a suitable onboarding process for a mobile application, different onboarding patterns can be
combined. The selection of onboarding patterns to introduce the travel application’s functions and
value was based on the user onboarding patterns discussed in the theoretical background. These were evaluated and selected based on what was best suitable to the application type and testing of
onboarding processes. The application’s functions were considered when selecting which onboarding patterns to combine to form the onboarding process; how the onboarding processes could teach the user how to use the application and also how the onboarding process can show the user the value of the application. The onboarding patterns selected to create two onboarding processes also aimed to do this in two different ways. The technical restrictions of the study also played a part in the selection of
onboarding patterns. Two of the onboarding patterns selected were walkthrough and product tour,
which introduce the application’s functions through a series of steps. The onboarding processes also included the onboarding pattern welcome screen. This pattern was also included in both onboarding processes as it is commonly used to begin onboarding sequences and seldom used on its own.
Progress bars are common onboarding patterns that are used to indicate a series of steps. Progress bars were included in both onboarding processes to motivate users to complete all the steps of the
walkthrough and product tour. The onboarding patterns that were not selected were those that required a functioning application, such as hotspots and action driven tooltips. This also included checklists, which would require the user to make progress. This progress would require a functioning application to record the progress, which was not the intent of the onboarding for the chosen application.
Furthermore, onboarding patterns that allowed participants to skip the onboarding processes, such as deferred account creation, were also ruled out. As there was no content to be personalized the persona-based onboarding pattern was not a fit for the mobile application of choice.
3.1.2 Questionnaire
The questionnaire used in the study was created based on the technology acceptance model (Davis, F. D. 1989) to evaluate the onboarding processes effect on the four variables of interest: perceived usefulness, perceived ease of use, attitude towards use and intention to use. The questions were formulated based on the measures provided for each construct, the full questionnaire can be found in appendix C. To assess the onboarding processes, the statements in the questionnaire were focused on the onboarding processes effect on continued use of the application, as well as the onboarding processes themselves. As an onboarding process implemented in a mobile application is a part of the application system, meaning that the onboarding process and application are interrelated, evaluation of both the onboarding process and the continued use of the application was of interest. This to gain insight and a deeper understanding of the onboarding processes tested as well as their effects on the constructs of the model.
Each question on perceived usefulness aimed to investigate how helpful the onboarding process is perceived as for the continued use of the application, such as understanding of the application or perceived increase of effectiveness in continued use. The questions for perceived ease of use aimed at evaluating the perceived effort of going through the onboarding process, through concepts such as clarity, comprehension and ease, focusing on the onboarding process itself. Since onboarding is part of the usage of a mobile application, questions about the onboarding process are directly related to the continued use of the application. To investigate if onboarding in mobile applications affect a change in attitude towards continued use of the application, the questions regarding attitude were targeted at both the continued use of the application and the onboarding process. This was achieved by evaluating if users perceived the processes beneficial for understanding and continued use, as well as the
experience of going through the onboarding process before application use. The statements on behavioural intention to use were focused on the continued use or intention to use the application. This was to measure if the onboarding process influences the users intention to use the application in a positive or negative way.
3.1.3 Survey
The study was conducted by a survey that was created and distributed through Google Forms online, with the intent to reach as many participants as possible and no specific demographics were targeted. The survey consisted of two parts, participant interaction with the onboarding process prototypes and a questionnaire per prototype. Participants were provided with the context for the onboarding
prototypes and brief instructions. After viewing the instructions, participants interacted with the onboarding process provided. The study was conducted within-subjects, meaning that the same participant tested both conditions in the form of the two onboarding processes. To counteract that participants would interact with both prototypes, the order in which they were seen by the participant was randomized. Participants interacted with one prototype at a time and completed the questionnaire before proceeding to the next. The questionnaire was filled in by participants after interaction with the provided prototype and consisted of provided statements to be answered on a Likert scale of 1 to 5. The survey provided quantitative data that was to be analyzed and measured, and the survey results were collected through Google Forms.
3.1.4 Data Analysis
To be able to analyse the results and make predictions about the population, common quantitative analysis methods were used. This meant using inferential statistics for a more complex analysis to examine the relationship between variables of the technology acceptance model. A regression analysis
is a set of statistical processes for estimating the relationships among variables, where a linear
regression analysis is used for a single variable and a multiple regression is used for multiple variables (Anderson, D.R., Sweeney, D.J., Williams, T. A., Freeman, J. & Shoesmith, E. 2014). A linear
regression analysis (SPSS Tutorials. n.d) was conducted for each onboarding process to determine the effects of each variable in the technology acceptance model according to the relations of the model. The linear regression could determine to what degree one independent variable was a predictor of another dependent variable. A multiple regression analysis was conducted for each onboarding process in order to determine how several variables influenced a specific variable in the technology
acceptance model. To conduct these calculations both of the methods collected the results, measured by the Likert scale, of questions on each factor in the technology acceptance model. To compare the effects of the onboarding processes a repeated measures ANOVA (Troeger, V. n.d.) was conducted. To further investigate any differences that appeared a pairwise comparison was used. The analysis of the data was done using the statistical software IBM SPSS Statistics version 25, where the variables were assigned in the program for calculation.
3.2 Implementation
3.2.1 Prototyping
The construction of the prototypes began with planning the flow for each of the onboarding processes. The features of the mobile application were broken down into various screens that would introduce the functionality. The interface design was created by taking inspiration from other travel applications such as Agoda, Booking.com and Momondo, as well as other application design solutions to create a realistic layout with familiar elements. The mobile interface design guidelines were taken into consideration throughout the prototyping process, and the design was aimed to present product value through functionality focus. Short descriptions, animations, icons and imagery was used to introduce the functionality of the application in both prototypes. Any text provided was designed to be friendly, human and directed to the user. The overall design was kept simple and formed using conventional navigation options, icons and terminology as well as cohesive colors and gradients and a
screen-optimized font. The prototyping was carried out using the software InVision.
3.2.1.1
Onboarding Process 1
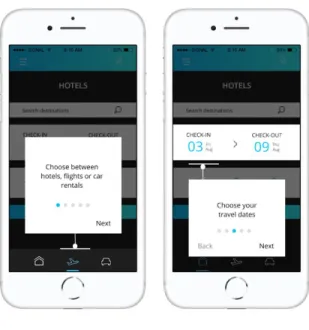
The first onboarding process included a welcome screen that introduced the application followed by a product walkthrough that described key application functionality. Short descriptions, animations, icons and imagery were provided on each screen to introduce functionality. A slide animation was used to transition between screens and the layout of screens were kept similar. A progress bar was implemented to indicate the length of the process and the full user interface was not visible during the onboarding process, see figure 3.1. For the sake of the testing of the onboarding process, the user was not given the alternative to skip the process at any step of the process. However, an option to go back to the previous screen was provided. The full prototype can be found in appendix B, prototype 1.
Figure 3.1 Onboarding Process 1.
3.2.1.1
Onboarding Process 2
The second onboarding process was created with the user interface as the outset. The process began with a welcome screen and then proceeded by presenting the user with the full application interface and provided tooltips that highlighted a certain functionality as well as a short description of its value. The tooltips were provided as modals over the visible user interface, see figure 3.2. The tooltips contained short descriptions of functionality and animations and highlights were used to provide context for the tooltip. A new modal was provided for each function, and each modal was positioned in regards to the function it was to present. The length of the process was indicated by a progress bar. For the sake of the testing of the onboarding process, the user was not given the alternative to close the tips at any moment. However, the user was provided with the option to go back to previous tooltips. The full prototype can be found in appendix B, prototype 2.
Figure 3.2 Onboarding Process 2.
3.2.2 Survey
The survey was created using Google Forms and was divided into sections to guide the user through each part of the survey. The survey was introduced through a short introduction of the purpose and additional information. Instructions were provided to explain how the different parts of the survey, the prototype interaction and questionnaire, was to be carried out. A link was provided in the survey to the prototype and participants were instructed to complete the onboarding process before proceeding to fill in the questionnaire. Once the first interaction and questionnaire were complete, the process was repeated for the second onboarding process. The questionnaire for the survey was developed based on the technology acceptance model (Davis, F. D. 1989) by adapting the questions from the original technology acceptance model questionnaire and the questions were formulated according to the purpose of the study to cover the variables of interest: perceived usefulness, perceived ease of use, attitude towards use and intention to use. Several control questions were included in the questionnaire to enable detection of invalid responses. The full questionnaire can be found in Appendix C. The survey was distributed online through various channels to increase the reach. No incentives were provided upon survey completion. The survey results and quantitative data was collected through Google Forms to be further analyzed and measured.
4
Findings and Analysis
The questionnaire used in the survey was developed based on the technology acceptance model (Davis, F. D. 1989) by adapting the questions from the original technology acceptance model questionnaire (Davis, F. D. 1989) to represent the variables of interest. In the following chapter, the results will be presented individually for each onboarding process, where each result is an average of the questions representing the variables investigated. The questions for each variable can be found in appendix C. The results were analyzed using a linear regression analysis and a multiple regression analysis to investigate each onboarding process effect on the factors of the technology acceptance model. Since the study was conducted within-subjects, a repeated measures ANOVA, analysis of variance, was executed to investigate if there was a difference between the onboarding processes. A total of 68 responses were collected in the study and any demographic information collected was voluntarily provided by the participants. The full raw data of the study can be found in appendix A and the analysis can be found in appendix D.
4.1 Demographics
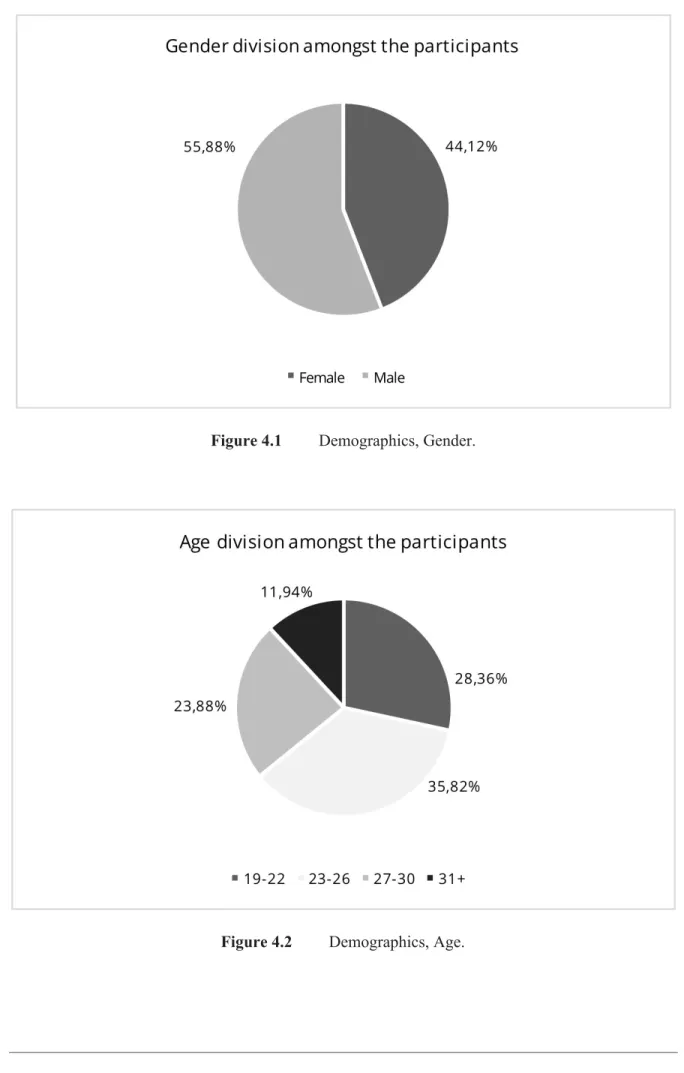
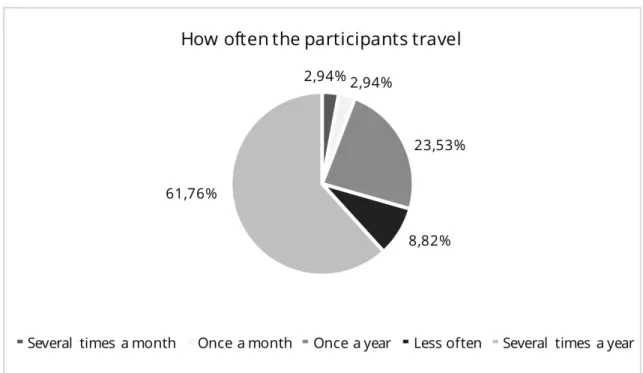
The demographic information was collected through questions which were voluntary for participants to answer. Of the 68 participants in the study, 67 answered the question regarding their age, and all 68 participants answered the remaining demographic questions. The participants of the conducted study were made up of 56% male and 44% female, as visualized in figure 4.1. The participants were between the age range 19-57 years of age, where 19-26 represented the majority of participants, see figure 4.2. The participants travel habits as seen in figure 4.3 showed that 62% of the participants traveled several times a year, 24% traveled several times a month and less than 15% traveled less often. More than half of the participants sometimes or always booked their travels through a travel application as seen in figure 4.4. However, a large amount of 46% never booked their travels through a travel application.
Figure 4.1 Demographics, Gender.
Figure 4.3 Demographics, Travel habits.
4.2 Onboarding Process 1
According to the relations within the technology acceptance model, a multiple regression analysis was used to test the effects of perceived usefulness and perceived ease of use on attitude toward using for onboarding process 1. The results of the regression indicated that perceived usefulness and perceived
ease of use explained 81% of the variance found in attitude (R2 =.81, F(2,66)=140.25, p<.001). It was
found that perceived usefulness had a positive effect on attitude (β = .836, p < .001), meaning that attitude increases as perceived usefulness increases. Additionally, the results showed no effect of perceived ease of use attitude (β = .005, NS), meaning that the perceived ease of use had no influence on the attitude that participants had towards onboarding process 1 as seen in figure 4.5.
Figure 4.5 Regression Analysis, Onboarding Process 1.
To evaluate the remaining factors a linear regression analysis was performed. The results of the regression showed that perceived ease of use explained 38% of the variance found in perceived
usefulness (R2 =.38, F(2,66)=10.77, p<.01) as well as significant effects of perceived ease of use on
perceived usefulness (β = .421, p < .01). Furthermore, attitude explained 74% of the variance found in
intention to use (R2 =.74, F(2,66)=84.34, p<.001) and attitude showed a positive effect on intention to
use (β = .813, p < .001). Positive effect was also shown of perceived usefulness on intention to use (β
= .680, p < .001) and perceived usefulness explained 67% of the variance found in intention to use (R2
=.67, F(2,66)=53.04, p<.001).
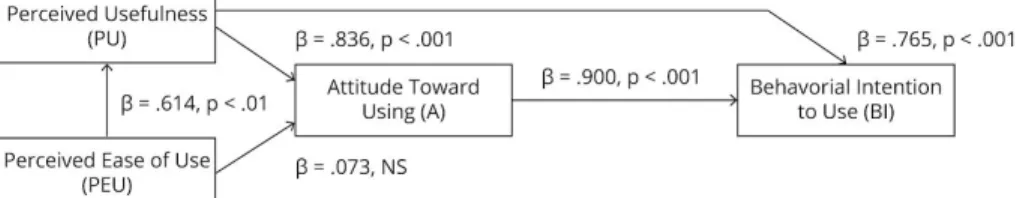
4.3 Onboarding Process 2
The multiple regression analysis was repeated for onboarding process 2 to test the effects of perceived usefulness and perceived ease of use on attitude. The results of the regression indicated that perceived
usefulness and perceived ease of use explained 77% of the variance found in attitude (R2 =.81,
F(2,66)=140.25, p<.001). The results showed a significant positive effect of perceived usefulness on attitude, meaning that the higher the perceived usefulness the higher the attitude (β = .836, p < .001). Furthermore, there was no effect of perceived ease of use on attitude (β = .073, NS), implicating that perceived ease of use had no impact on the attitude of participants towards onboarding process 2, as shown in figure 4.6.
Figure 4.6 Regression Analysis, Onboarding Process 2.
To investigate the remaining factors a linear regression analysis was run for onboarding process 2. The regression showed that perceived ease of use explains 36% of the variance in perceived
usefulness (R2 =.36, F(2,66)=9.59, p<.01). There was a significant positive effect of perceived ease of
use on perceived usefulness (β = .614, p < .01), meaning that a higher perceived ease of use contributes to a higher perceived usefulness. The results of the regression further indicated that
attitude explains 75% of the variance in intention to use (R2 =.75, F(2,66)=84.34, p<.001) and there
was a significant positive effect of attitude on Intention to use (β = .900, p < .001). Furthermore it was
found that perceived usefulness explained 43% of the variance in intention to use (R2 =.43,
F(2,66)=84.34, p<.001), which may overlap with the variance explained by attitude.Significant
positive effect of perceived usefulness on Intention to use (β = .765, p < .001) was found.
4.4 Comparison of Processes
A repeated measures ANOVA was conducted to investigate if there was a difference between the two onboarding processes. The results indicated that there were no significant effects for perceived usefulness (F(1, 76) = 2.711, NS), attitude (F(1, 76) = .227, NS) and intention to use (F(1, 76) = .226, NS). However, there was a significant difference for perceived ease of use (F(1, 76) = 3.341, p=.05) for which assumption of sphericity was violated and Greenhouse-Geisser correction was applied to correct the degrees of freedom of the F-distribution.
Further investigation of the significant effect was done using a pairwise comparison which showed that perceived ease of use of onboarding process 1 was reduced by -0.25 points compared to onboarding process 2 (p= 0.05). This means that the perceived ease of use of onboarding process 1 was lower than for onboarding process 2. Furthermore, in common for both onboarding processes was that there was no significant effect of perceived ease of use on attitude, meaning that the perceived ease of use did not affect the attitude towards none of the processes. Thereby the lower perceived ease of use of onboarding process 1 was not significant. Ultimately the onboarding processes had an effect on all the factors of the technology acceptance model, however there was no significant difference between the two onboarding processes that indicated that one was better than the other.
5
Discussion and Conclusions
5.1 Discussion of Method
The purpose of the method was to investigate onboarding processes in mobile application and their effect on user attitude towards continued use of applications, as well as the difference between onboarding processes in mobile applications effect on user attitude towards continued use of
applications. The method selected was based on the technology acceptance model (Davis, F. D. 1989). The model has been widely used in research on information technology and proven as a valid
instrument to test technology acceptance and user behavior (Venkatesh, V. 2000). To test onboarding processes in mobile applications effect on the factors of the technology acceptance model, prototypes with user onboarding patterns were used. The prototypes used in the study represented real
onboarding processes using onboarding patterns tailored to the application of choice. The use of prototypes over existing mobile applications with onboarding processes allowed for full control over the patterns, flow and content of the processes and eliminated external factors that could have influenced the results. The external factors eliminated included the need for participants to download existing applications on their device, and the inability to control that the participants would fully complete the onboarding without skipping the process. Other factors included the risk of participants having already used the application to be tested, as well as already having gone through the provided onboarding process. Finally, the inability to control the content of existing onboarding processes, as well as updates by those providing the application during the execution of the study was avoided. However, as it was apparent to the participants that the study was conducted with prototypes, it may have been a factor of influence on the experimental procedures. The testing of the prototypes yielded very similar results, which did not indicate any difference between the onboarding processes on the outcome of intended use. The onboarding processes were very similar in both flow and content, and it could be assumed that if the processes had larger differences, there would have been a more
significant difference in the results. However, it is not certain whether this would have provided any meaningful insights rather than just generated larger differences in the result. Creating larger differences in the onboarding processes would also interfere with the representation of real onboarding processes.
The study consisted of a survey which was divided into a series of steps, guiding the participant to first interact with the prototype in question and continue by filling out the corresponding
questionnaire. The study was conducted within-subjects, meaning that participants tested both conditions in form of testing both of the prototypes. In order to counteract any impact of this, the order in which the prototypes were shown to the participant was randomized. The study was
conducted online, which implied that participant interaction with the prototypes, as well as the context in which the prototypes were viewed, could not be controlled. It could not be ensured that an
interaction took place or that the interaction was completed, meaning that the results rely on the sincerity of those partaking in the study. The questionnaire used in the study was developed based on the original technology acceptance model questionnaire and validated instruments for the technology acceptance model to ensure validity through construct representation, meaning that the questionnaire
provided valid measurements for each construct. The questions were adapted to the purpose of the study to measure the variables of interest. In the original technology acceptance model questionnaire, the constructs are rated on a scale of 1-7 providing quantitative results. However, the scale was considered too large for the study in question, and a scale of 1-5 was used. To provide reliable results the survey contained control questions which allowed for removal of invalid responses.
The study was conducted as a quantitative study since it aimed to investigate the effects of onboarding processes in mobile applications rather than to gain insight into the opinions of participants on the onboarding processes. The study allowed for testing of the specific hypothesis that onboarding processes in mobile applications affected attitude towards continued use of applications. The quantitative method generated results which provided statistics that could be used to draw
generalizations on a population and could successfully fulfill the purpose of investigating the research questions. Distributing the study online allowed for a broader reach, and a total of 68 respondents participated in the study. The sample size of 68 participants reflects a population of 80, with a
confidence level of 95% and a margin of error of 5%. With a larger population the confidence level is reduced and as such it is recommended that further research could repeat the study on a larger sample size to ensure reliability on a larger scale.
Due to limited resources and time constraints, the participants were reached through social media channels, which may have affected the demographic representation in the study. The age
representation in the study was wide and covered ages ranging from 19-57 years of age. However, the age range 19-26 represented the majority of participants which may have introduced a bias. For future research it would be encouraged to test a wider age range to investigate whether different age groups would have an impact on the results. The study showed that only half of the participants sometimes or always used a travel application when booking their travels. The participants that were already familiar with using a travel application may have established a certain level of confidence, meaning that they may have found the introduction useful but had enough prior knowledge to figure out the functions and value of the application. As a result, these participants may not have experienced one onboarding screen to be significantly better than the other which may have influenced the results. Therefore, the selection of a mobile travel application may have had an influence on the results and may be subject of further investigation as only half of the participants represented this category of users. Further research may also investigate other demographic connections to the effects of onboarding.
5.2 Discussion of Findings
The theoretical background study showed that onboarding processes were argued to be beneficial for the first-time impression and are often implemented in mobile applications to help users find value of a product quickly. Since user onboarding is the first interaction a user has with a mobile application, it is worth investigating whether onboarding can affect user attitude towards continued use by enhancing
this first-time interaction. In order to investigate this problem, this thesis has examined the effect of
different onboarding processes in mobile applications on users attitude towards continued use of applications. By using common onboarding patterns to investigate this problem, it could determine the
the study will be discussed in order to answer the research questions on mobile application onboarding processes and their effect on user attitude towards continued use of applications.
5.2.1 What effect does onboarding processes have on user attitude
towards continued use of applications?
The onboarding processes in mobile application showed effect on all variables in the technology acceptance model, meaning that onboarding processes can be used as a tool to affect the variables of the model. As for the effect on attitude, it was found that all variables had a significant effect on
attitude, for both processes with the exception of the perceived ease of use.The positive effect of
perceived usefulness on attitude found in both onboarding processes showed that if users found the onboarding process useful, they were inclined to have a positive change in attitude. Furthermore, perceived usefulness showed positive effects on intention to use, indicating that if users found the onboarding process useful they were more inclined to use the application. Attitude also showed positive effect on intention to use, meaning that onboarding processes in mobile application inflicting an increase of attitude would lead toward continued use of the mobile application.
The theoretical background showed onboarding was assumed to aid users in finding success and value in a product quickly. The positive results indicated that onboarding could be helpful for quickly finding value in a product and that finding this value is important in determining the users attitude as well as intention to use. The perceived usefulness could be a crucial factor in determining user attitude and intention to use, which in turn could ultimately affect user retention rates. In conclusion, the positive effects on attitude and intention to use confirmed that implementing an onboarding processes in mobile applications can be beneficial for value proposition and user retention.
5.2.2 What is the difference between different onboarding processes
effect on user attitude towards continued use of applications?
To investigate the differences between the onboarding processes in mobile applications effect on the variables of the technology acceptance model, a pairwise comparison was used. The pairwise comparison showed that perceived ease of use on onboarding process 1 was reduced by -0.25 points compared to onboarding process 2 (p=0.05). The lower perceived ease of use of onboarding process 1
could be explained by the main difference between the two processes. Since both onboarding
processes provided the user with the same information on application functionality, one could assume that the presentation of the information was the underlying cause. Onboarding process 1 provided a walkthrough of the functionality within the mobile application, whilst onboarding process 2 revealed the full user interface with tooltips of the functionality. This indicates that the visibility of the user
interface affected whether participants perceived the technology to be free from effort or not and that
the visible interface had a positive effect on perceived ease of use.
Furthermore, both processes had no significant effect of perceived ease of use on attitude. As explored in the theoretical background, user experience design aims to provide an easy, efficient and pleasant interaction. It could be argued that the cause of the insignificant effect of perceived ease of use on attitude was that it rather affected the user experience, compared to perceived usefulness which
showed significant positive effect on attitude. As a result, the perceived usefulness was the main influence on the attitude of participants. This means that if participants found the onboarding process valuable and helpful, they were more likely to have a positive change in attitude while the perceived
ease of use contributed to a higher perceived usefulness. The results showed that perceived ease of use
has no direct influence on attitude. However, since perceived ease of use had an effect on perceived usefulness, and perceived usefulness had an affect on attitude, it could be considered that perceived ease of use had an indirect effect on attitude. This connection is ruled insignificant as the regression analysis showed that perceived ease of use did not have an effect on attitude.
Ultimately the results showed no significant difference between the two onboarding processes that indicated that one was better than the other regarding the effect on attitude. Due to the similarity between the processes in flow and content along with the fact that both processes were tailored to the travel application, it could be argued that both processes worked well in the provided context, thus explaining the equal performance in the test.
5.3 Conclusions and Further Analysis
After conducting the study and analyzing the results, several conclusions were reached. The study showed that the onboarding processes had a positive impact on user attitude towards continued use of mobile applications. There was no significant difference between the different onboarding processes effect on attitude towards continued use. The positive effects on attitude and intention to use
confirmed that implementing an onboarding processes in mobile applications could be beneficial for value proposition and user retention. The perceived usefulness proved to be the determining factor on
attitude and intention to use.
Further research could bring additional certainty on how onboarding processes affect user attitude towards continued use of applications. The study was limited to the testing of a mobile travel
application and two tailored onboarding processes. As discussed in the method, a comparison between less similar processes could have yielded a different result. Therefore, it could be useful to test a variety of onboarding pattern combinations to investigate the difference between onboarding processes further. To increase the reliability of the results, the processes could be tested on a larger
sample size unfamiliar with the application type. To investigate the impact of attitude and intention to
use, onboarding processes in existing applications could be tested to measure the effects on customer
6
Appendices
Appendix A
Survey Results
Survey results, Onboarding Survey.xlsx. (2019, April 24) Accessible at
https://docs.google.com/spreadsheets/d/1ySM4Ojj0dITJM5JD4e5KLbkjFOM6LdmpiLE0AyjsF4Q/ed it#gid=896033910