may
?
Statens väg- och trafikinstitut (VTI) - Fack ' 581 01 Linköping
National Road & Traffic Research Institute - Fack - S-581 01 Linköping - Sweden
29
Frost Heaving on Roads
in Relation to Freezing Index
by Rune Gandahl
Reprint from the International Symposium on
Frost Action in Soils
Proceedings
Luleå, Sweden. February 16 18 1977. Vol. I.
Statens väg- och trafikinstitut (VTI) - Fack - 581 01 Linköping
National Road & Traffic Research Institute - Fack - S-581 01 Linköping - Sweden
29
Frost Heaving on Roads
in Relation to Freezing Index
by Rune Gandahl
Reprint from the International Symposium on
Frost Action in Soils
Proceedings
Luleå, Sweden. February 16 -18 1977. Vol. I.
FROST HEAVING ON ROADS IN RELATION TO FREEZING INDEX R GANDAHL NATIONAL SWEDISH ROAD AND
TRAFFIC RESEARCH INSTITUTE LINKÖPING, SWEDEN
SUMMARY
Observations on test roads during several years show that, in the majority of cases, a practically rectilinear relationship between frost heaving and freezing index exists. One can, therefore, form the
quotient freezing index/frost heaving, which is of
great practical importance.
In this report an attempt is made to make a sta tistical analysis of different data from the test roads for thus being able to determine the importance of different variables to the size of the quotient freezing index/frost heaving.
At the statistical analysis it has naturally been found that the thickness of base has a predominating
effect. As to other variables, such as distance to ground water table, depth of frost, thickness of frost
active layers, the effect seems to be more complex. In this investigation it has not been possible to analyse in detail the importance of different factors to the quotient freezing index/frost heaving. Worth aiming at is, however, to obtain possibilities to esti-mate this quotient from the basis of known conditions regarding road base, subgrade and climate. One could
probably obtain a basis for such an estimate only through experiments, programmed in detail, with test surfaces or test roads, in which the marginal conditions are under control. The results of such experiments and of existing test roads should create favourable possibilities of practical illustration of the frost heaving process and its dependence on different factors.
207
OBSERVATION DATA FROM TEST ROADS
From measurements of frost heaving, which have been going on during a long succession of years, there are measuring data from 10 different test roads. Each
test road is divided into a varying number of test
sections, 70 test sections in all. Measurements have
been made on each test section three years in succession. The first year of observation is as a rule the same as the year of construction. Each year there are measure-ments on frost heaving, air freezing index, depth of
frost and distance to ground water table of the test section. The measurements are made about 5 times per
frost season. There are, furthermore, a material de
scription of the base and information about the state of the subgrade.
FROST HEAVING IN RELATION TO FREEZING INDEX
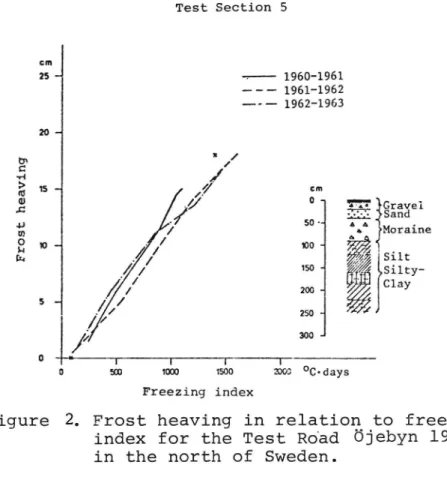
Figures l - 3 show, for 3 of the 70 test sections,
the frost heaving plotted against the measured freezing index. The points are linked together yearly. Studying the observations of one year one finds that the connec-tion is approximately linear, i e the points lie prac-tically on a straight line. The different years do not show any systematical differences, i e the lines are not separated.
Test Road KLINTEN A 1960 Test Section 11 cm . 25 4 1960 1961 7° " - 1961-1962
5
1962 1963
% g 15 _ cm JJ 0 _ _ m New base 8 so- ___ m 100 _ Old base 1w~ Silty clay 5 l 200-4ml
sol
o I | | | (o sm 1mm ama emo OC-days
Freezing index
Figure 1. Frost heaving in relation to freezing
index for the Test Road Klinten A 1960 in the north of Sweden.
Test Road öJEBYN 1957 Test Section 5 cm 25" 1960 1961 --- 1961-1962 -- 1962-1963 20 I
?
,/
H &; 15 - cm få 500 _ :,: .:. Gravel_._-_'_;,'_-_ Sand 3 z. Moraine 8 n 4 no f a. z' Silt 150 - %% Silty-zoo-a . Clay 5 1 f 50~ f mad 0 " r r l r 0 500 1000 1500 2000 oC-days Freezing indexFigure 2. Frost heaving in relation to freezing
index for the Test Road Ojebyn 1957
in the north of Sweden.
Test Road öJEBYN 1958 Test Section 13 cm -l960 l961 25 _. " l961-1962 ' l962 l963 20 -U'! Cl ...g > (U g 15 - cm 0 " _-å 3*"- Gravel 50 -8 Sand En 1° _ 100 " Peat Silt 150 - . _ , Silty-[I/ 200 - Clay 5 ~ </ 250 -awl 0 | 1 0 1503 2000 OC'ÖSYS Freezing index
Figure 3.Frost heaving in relation to freezing
index for the Test Road Öjebyn 1958
209
For describing the linear connection, the dependence
of the frost heaving on the freezing index, the equations of regression for all the test sections have been deter-mined. Each observation point has been treated as an in
dependent observation, independent of year. The equation has the form:
Y = a + bX
where Y is the frost heaving, X is the freezing index and a and b are constants.
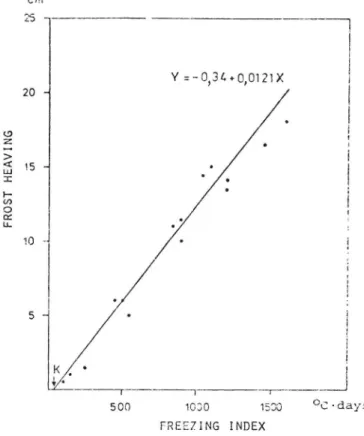
Figure 4 shows the observations and the regression
line for test section 5 on the test road öjebyn 1957 (compare figure 2). The adjustment is very good, the
equation of regression has a degree of explanation of 96 per cent. m c 25
Y=-O,3L+0,0121X
.. . .. . . FR OS T HE AV IN G 500 10.30 1530 &. days FREEZING INDEXFigure 4. Observations and regression line for test
section 5 on the Test Road Öjebyn 1957
(compare figure 2).
If Y is equalled to zero in the equation of regres sion above, an estimate of freezing index, which is
needed before any frost heaving takes place, is obtained.
This freezing index equales the index, which is neededg
to freeze the sand and gravel layers of the base, since these layers are not frost heaving. This quantity can also be determined physically, (The design of frost
foun-dations, frostheat and soilheat. Norwegian geotechnical
institute, publication nr 90 Oslo 1971, Skaven Haug).
A comparison between the values obtained has been done for the test sections in question. These differ
syste-matically, so that the estimate is less than the physi
cally determined value, which indicates that the mea
sured freezing indices are systematically incorrect. This does not, however, influence the linearity in the connection between frost heaving and freezing index. The incorrectness can be explained by the difficulties in finding the right moment to start the reading off of the freezing index.
The inverted value of the constant b (the quotient of the frost heaving) indicates how many degree days that are needed for the frost heaving of 1 cm. This quan
tity varies, for the test section observed, between 58
and 789 degree days.
THE QUOTIENT FREEZING INDEX/FROST HEAVING IN RELATION TO OTHER VARIABLES
A dependent variable is freezing index/frost heaving kl. The following variables have been examined
1. The thickness of the base
2. The thickness of the frost active layers
3. The position of the ground water table before
the freezing measured from the road surface.
4. The position of the ground water table in the
late winter measured from the road surface.
5. The position of the ground water table before
the freezing measured from the lower edge of the base.
Originally some ten variables were put in relation to the quotient of frost heaving. The justification of choosing the 5 variables mentioned above was that they were expected to give rather strong positive correlations.
Table l shows the average values and the standard deviations of the independent variables and the coeffi cients of correlation between the independents and the dependent variable. Strongest correlated with the
freezing index per frost heaving is variable 1, the
thickness of the base. Then follows variable 3, the
position of the ground water table before freezing measured from the road surface. The other variables
211
TABLE 1
Variable Average Standard ' The coefficient of value deviation correlation between
' Y and Xl, r X1 1,06 0,33 0,64 X2 3,62 3,31 0,40 X3 1,42 0,51 0,51 X4 1,91 0,48 0,34 X5 0,36 0,45 0,11 Thickness of base, r = 0,64
Figure 5 shows freezing index/frost heaving
plotted against the thickness of base. The figure
indicates a quadratic dependence, i e that k is de
pendent on the thickness square of the base. The equa-tion of regression Y = a + bX, in which Y is the free zing index/frost heaving, X the thickness of the base, a the constant and b the coefficient of regression,
gives a degree of explanation o 50 per cent. If the
thickness of the base square, X , is put to the equa-tion, the degree of explanation is raised by 9 per cent. The results are in accordance with practical experience. The most common steps taken, to reduce the frost heaving, is an enlargement of the thickness of the base. In this report the connection has not been able to be totally unambiguous, since bases of different kinds are inclu-ded in the observation material, which means that not only the thickness of the base has been varied.
m» Y ' gg A
a) 0 *
o . H Ad GOO-4 . äs&
m _ 0) .C: Um 400-. 0 H wa \ X .. m "0 C H m 20c c -|-l N & (D _. H En X 0 cm o 1mo Thickness of baseFigure 5. The quotient freezing index/frost heaving, kl
in relation to the thickness of base. Thickness of frost active layers ,r'=-4ng
The negative correlation is not in accordance with
the practical experience, which shows a gns
jvecxxre-lation. Since the frost heaving requires a good water supply, it is supposed that the latter is more critical for the frost heaving than the thickness of the frost active layers. Compare the case with stratified layers.
Distance to ground water table! r : 0,51, 034 and 0,11
The correlations are positive, though not high for the three variables, where the distance of the ground water table has been measured in different ways. "The position of the ground water table before freezing mea
sured from the road surface shows the best correlation,
which probably is due toxthe fact that the thickness of the base exerts an influence. The same thing can be said about "the position of the ground water table in the late winter measured from the road surface". "The position of the ground water table before freezing measured from the lower edge of the base" has the lowest correlation. To investigate into what extent the level of the ground wa-ter table is of importance, the observation mawa-terial for
213
classes and a new analysis of correlation has been done.
Figure 6 shows freezing index/frost heaving plotted against the thickness of base divided up according to this variable.
U ' E (J o o 24 [ :* 65cnn M ! . I
8
-r-| / 30 '- 65cm > m I g wo-- I 5 -»30cm I 4.)8
o 5
u ; cm wa \ X m E.zv H 0 0 C H N <-m w H in 1 *: i 50 700 250 cm Thickness of baseFigure 6. The quotient freezing index/frost heaving, kl,
in relation to thickness of base for diffe rent classes of depth to ground water table.
Table 2 shows the coefficient of regression and the degrees of explanation of the four ground water classes. It is evident from the table that the degree of explanation rose by 5 to 20 per cent when the divi ding up was made. From this one can draw the conclu-sion that only at high ground water level, i e when the ground water table is in level with or near in le vel with the terrace surface (within half a metre),
the ground water level more markedly exerts_an influence on the frost heaving. This corresponds also with prac tical experiences.
TABLE 2.
The distance of Number of Constant Coefficient of reg- Degree of ex f
the ground water observations ression planation in
surface from the for X for X2 percentages terrace surface ' 1 1 in cm 6 14 2,15 4,17 2,82 79 6 30 16 3,62 6,65 4,04 78 30 65 _ 14 . 4,70 - 8,40 5,12 65 65 15 7,65 15,63 9,41 80 Totalt 59 3,79 6,79 4,20 59
FROST HEAVING IN SWEDEN
In the material, which we have been going through in this report, the quotient of frost heaving varies between 58 and 789 degree days/cm. Experience shows that the quotient of frost heaving seldom is less than 50, i e a quotient of frost heaving of this size rep resents maximally dangerous frost heaving conditions. If the frost heaving quotient is high enough it loses importance, since higher and higher freezing indices are needed to obtain a frost heaving of a fairly size. The average freezing index in Sweden goes up to slightly more than 1500 degree days. A quotient of frost heaving of 500 means in that case a frost heaving of 3 cm, which, as to roads, is not regarded as damaging. An attempt to estimate the frost heavings, that may occur in Sweden in an average cold winter, when the frost heaving quo
tients vary from 50 to ZX) degree days, has been made
and is shown in figure 7. One can notice that at the lower freezing indiceskin the southern and the middle parts of the country, the frost heaving amounts become small. In the northern parts high frost heavings at small values of the frost heaving quotient arise, but also here may small frost heavings occur, that is to say at high values of the frost heaving quotient.
215
__mw_ Frost heaving (cm)
When 1 cm needs:
50 OCd 100 OCd 200 OCd
36
18
9
30
15
7,5
24
12
18
9
4,5
12
6
3
6
3
1,5
Ä.
'=.
t ,.
vo;
Figure 7. The average freezing index (OCd) and the
corresponding frost heavings(cm) for the quotients of frost heavings: 50, 100 and
200 (OCd/cm).
DISCUSSION
It has earlier been shown that the thickness of the base of great obtained material swer the the size question,
and the distance to the ground water table are importance to the frost heaving, which can be for a certain freezing index. The observation
has, on the other hand, not been able to an
question how the subgrade as such determines of the frost heaving. This is an important
that often is asked by the road designer.
To sum up the problem is a question of weighing together the factors in question for the frost heaving in field, 1 e the tendency of soil materials towards frost heaving, the consequence of earth-layer, the ground water supply and the thermal conditions.