WATER QUALITY INDEX (WQI) OF RIVER
TAPTI-SURAT, GUJARAT-INDIA
1Jigna Desai
2Tank.S.K
1SRK Institute of Computer Education & Applied Sciences, Surat
2Department of Biosciences, V.N.S.G.University, Surat
E-mail:drtanksk@hotmail.com
Jigna_1999@yahoo.co.in
ABSTRACT
Water quality monitoring is an important aspect of water management concerning to the pollution control. Present communication deals with study of physico-chemical parameters such as pH, temperature , total dissolved solids (TDS),total suspended solids (TSS), total alkalinity (TA), , total hardness (TH), chloride (Cl), fluoride (F), sodium (Na), calcium (Ca), magnesium (Mg), sulphate (SO4), nitrate(NO3), nitrite (NO2), dissolved oxygen (DO),
biochemical oxygen demand (BOD), chemical oxygen demand (COD) and heavy metals like chromium (Cr), arsenic (As), lead (Pb) and cadmium (Cd) of water samples from five sampling sites of River Tapti, Surat, Gujarat state, India. The water samples were collected at regular interval of 30 days for two consecutive years 2008-2009. The experimental values of water samples were compared with standard values given by World Health Organization (WHO). Water Quality Index (WQI) was also calculated to know the overall quality of water samples by using Water Rating System adapted by Canadian Council for Minister of the Environment (CCME-WQI). The data were analyzed statistically to identify those parameters which are responsible for variation in Water Quality Index (WQI). To identify those parameters we have done correlation analysis, testing of hypothesis, factor analysis and regression Analysis by using SPSS (Statistical Package for Social Science). The results show that the quality of water is poor and not good for drinking or irrigation purpose. The variance was found significant at 1% level of significance in case of and turbidity, BOD, Cr and Pb. It was found significant at 5% level in case of COD.
KEYWORDS
Surface water, Water quality parameters, Water Quality Index (WQI) 1 INTRODUCTION
Water, the precious gift of nature to human being, is going to be polluted day-by-day with increasing urbanization. Although three-fourth part of earth is being surrounded by water but a little portion of it can be used for drinking purpose.
Almost all the surface water in India is unfit for direct consumption. In spite of the fact that the municipal water supply in most of the cities is through treated surface water, due to over contamination, more stringent treatments would be required to make the surface water potable. The prominent source of surface water pollution is domestic sewage, industrial waste water and agricultural run-off and other anthropogenic activities [1].
Urbanization is normally identified with growth and development of any country. The cities grow with the migration of population from rural surroundings in search of fulfilling their food and other domestic needs, resulting major stress on cities. Hence their settlement and water supply in urban area is always one of the major concerns to the local civic authorities. It is assumed that within the next few decades, more than 50% of India’s population would be living in urban areas. Quality of life of majority of India’s population depends on the existing environment within the cities. It is estimated that 75% of pollution loads of all the rivers in India is due to urban wastewater [7]. In these studies, Surat city was selected as a case study to understand the impacts of urbanization on River Tapti.
Most of the modern day rivers in India are severely polluted due to the irresponsible attitude & mismanagement by the people / stakeholders. As per the urban river health assessment studies, many cities of India may be termed as an excellent and classic example of the mismanagement of the rivers.
The river Tapti Basin is predominantly an agricultural region in Madhya Pradesh and industries are centered in East Nimar (Khandwa) district. The middle and lower reaches of the Tapi Basin in Jalgaon (Maharashtra) and Surat (Gujarat) are fairly industrialized. There are several large and medium scale industrial units besides large number of small scale units. The important urban centers in the basin are Burhanpur in Madhya Pradesh; Akola, Bhusawal, Jalgaon, Malegaon and Dhule in Maharashtra; and Surat in Gujarat.
The Tapti river eco-system is under maximum stress, due to the social and economic activities carried out by various population classes on different land use patterns. The occupational and domestic activities in various households invariably result in the production of liquid, solid and gaseous wastes of various types and quantities, which subsequently find their way into the river.
The study reported herein was undertaken with the objective of evaluating the surface water quality of Surat city of South Gujarat region so that we can restore and maintain the surface water quality at such levels as are needed to sustain the designated best use of the different stretches of the river.
2 METHODOLOGIES
To evaluate the water quality of River Tapti Surat, 5sampling sites were selected from upstream to downstream along the urban stretch of river Tapti through Surat city. These locations were- Varachha Bridge, Vivekanand Bridge, Ambika Niketan, Ramnath Ghela-Ichchhanath, and L & T Jetty-Hajira.
To evaluate the water quality, samples were collected during premonsoon, monsoon and postmonsoon season for two consecutive years 2008 and 2009. Sampling was done once in a month having regular interval of 30 days. 5 liter sample each time was collected. Samples were collected in the sterile plastic container rinsed with detergent and nitric acid and finally with distilled water. Immediately after collection some of the parameters were analyzed at the field and after that samples were refrigerated at 4oC prior to further analysis.
The samples were analyzed for various physico-chemical and biological parameters like- temperature, pH, Turbidity, Total dissolved Solids (TDS), , Total Suspended Solids (TSS), Total Hardness (TH), Alkalinity, Dissolved Oxygen (DO), Biological Oxygen Demand (BOD), Chemical Oxygen Demand (COD), Chloride (Cl), Sulphate (SO4), Nitrites (NO2),
Nitrates (NO3), Iron (Fe), Calcium (Ca), Magnesium (Mg), Sodium (Na), Iron (Fe), Fluoride
(F), Chromium (Cr), Cadmium (Cd), Lead (Pb), Arsenic (As) by standard methods of APHA [5]. The values were compared with the standard laid by different organizations [2, 3, 4].
Water Quality Index (WQI) was calculated to know the overall quality of water samples by using Water Rating System adapted by Canadian Council for Minister of the Environment (WQI) [6]. The water quality of all the sampling sites was categorized as per CCME-WQI guideline. Table 1 shows different categories of water quality as per CCME-CCME-WQI.
Table 1 Water quality rating according to CCME-WQI
WQI Category / Rating
95 – 100 Excellent 80 – 94 Good 65 – 79 Fair 45 – 64 Marginal 0 - 44 Poor
The data were analyzed statistically to identify those parameters which are responsible for variation in Water Quality Index (WQI). To identify those parameters we have done correlation analysis, testing of hypothesis, factor analysis and regression Analysis by using SPSS (Statistical Package for Social Science). Correlation coefficient was calculated by Karl Pearson’s measure, Factor analysis was calculated by extraction of factor by principal component method.
3 RESULTS AND DISCUSSION
To evaluate the water quality of River Tapti Surat, 5 sampling sites were selected from upstream to downstream along the urban stretch of river Tapti through Surat city. These locations were- Varachha Bridge, Vivekanand Bridge, Ambika Niketan, Ramnath Ghela Ichchhanath, and L & T Jetty-Hajira and the samples were collected during premonsoon, monsoon and postmonsoon season for two consecutive years 2008 and 2009.
3.1 Surface water quality of the River Tapti at Varachha Bridge Region:
In the year 2008, 5 parameters namely Turbidity, Temp., TDS, Cl, SO4 were found exceeding
their desirable limits. The concentration of Turbidity ranged from 10-16 mg/l in the month September and August respectively. Temperature ranged from 25-30° C. In the month March and May it was highest and lowest in the month November. Temperature is an important parameter for any water body most of the aquatic biota are temperature sensitive and temperature also affect other parameters like DO and solubility of heavy metals. TDS ranged from 59- 1142 mg/l in the month August and January respectively. The higher amounts of TDS indicate that the water body is being affected by the human activities [9]. In this region concentration of Cl was higher in the month November only and it was 284 mg/l.
Concentration of Sulphate (SO4) was higher than its permissible limits in the month January,
October, November, and December. It was 360 mg/l, 341 mg/l, 394 mg/l and 294 mg/l respectively. Heavy metals were not at all detected and all the other parameters were found within their desirable limits.
in the year 2009 River Tapti at Varachha Bridge Region except 5 variables namely Turbidity, Temp., TDS were found exceeding their desirable limits. Turbidity ranged from 5-12 NTU in
October and June respectively, which was somewhat higher than its desirable limit. Heavy metals were not detected and all the other parameters were within their permissible limits. 3.2 Surface water quality of the River Tapti at Vivekanand Bridge Region:
In the year 2008 parameters namely Turbidity, Temp., TDS, DO, BOD, Cl, Hardness, SO4,
Na, Ca, Mg, Fluoride and Iron (Fe) were found exceeding their desirable limits. All the other parameters were found within their desirable limits. In this region turbidity ranged from 13-19 NTU in the month January and June respectively. Temperature was recorded highest in the month March and that was 30 °C. TDS ranged vary widely from 489-24310 mg/l. The higher concentration of TDS indicates that the water body is highly polluted and not suitable for drinking and washing purpose. DO range from 1.29-5.9 mg/l. Except July and August concentration of DO was less than 3 which is not suitable for aquatic biota. For a healthy water body it requires DO more than 6. In case of BOD throughout the year the concentration is more than 6 mg/l in all the months. It ranged from 7.33-9.8 mg/l which indicate that water body is contaminated and highly polluted (Khan, N., et al., 2005). The concentration of Cl was higher than its permissible limit 250 mg/l except in the month April, July, August and September. The Hardness of water body ranged from 120-2450 mg/l in the month July and February respectively. The concentration of SO4 ranged from 36-1071 mg/l in the month May
and February respectively. The concentration of Na was higher than its desirable limit throughout the year. It ranged from 320-4335 mg/l in the month August and December respectively. The maximum permissible limit of Ca is 75 mg/l [3]. Fluoride was higher in the month November and it was 3.36 mg/l. The concentration of Fe was also higher in the month January, February, April, October, November and December. Similarly in the year 2009 also except Fluoride all the same 14 parameters were found exceeding their desirable limits.
3.3 Surface water quality of the River Tapti at Ambika Niketan Region:
In the year 2008 parameters namely Turbidity, Temp., pH, TDS, DO, BOD, Cl, Hardness, Alkalinity, SO4, Na, Ca, Mg, Fe were not found within their limits. Turbidity was higher than
its limits throughout the year. It ranged from 12-20 NTU Temperature ranged from 25-30°C. pH was higher than its in the month October and it was 8.63, which is slightly higher. TDS ranged from 206-22472 mg/l. The concentration of DO ranged from 3.28-6.5 mg/l in the month January and June respectively. The lower amount of DO indicates that the water body is polluted. BOD ranged from 2.1-8.78 mg/l. Concentrations of Cl ranged from 30-9550 mg/l in the month September and January respectively. Hardness ranged from 198-5290 mg/l and Alkalinity ranged from 0.4-329 mg/l in the month November and August respectively. SO4
ranged from 29-2513 mg/l in the month August and February respectively and Na ranged from 33-9195 mg/l in the month September and January respectively. Concentration of Ca ranged from 29-2780 mg/l in the month September and January and Mg ranged from 20-1080 mg/l in the month June and November respectively. The higher concentration of these parameters indicates that the water is highly contaminated [8].
In the year 2009 also except pH all the same 15 parameters were found exceeding their limits. Turbidity ranged from 13-18 NTU. TDS ranged from 206-22410 mg/l, DO ranged from 3.1-6.5 mg/l in the month January and June respectively. BOD ranged from 4.9-8.5 mg/l, which indicates that the water body is highly polluted.
3.4 Surface water quality of the River Tapti at Ramnath Ghela Region:
In the year 2008, 13 parameters were exceeding their permissible limits namely Turbidity, temp., TDS, DO, BOD, Cl, Hardness, SO4, Na, Ca and Mg. All the other parameters were
within their desirable limits. Turbidity ranged from 9-15 NTU. Maximum Temperature was found in the months of February, May and October-it was 30°C. TDS ranged from 359-29630 mg/l in the month September and April respectively. DO ranged from 3.46-6.2 mg/l in the month October and April respectively. Cl ranged from 85-13690 mg/l in the month August and April respectively. Hardness ranged from 150-5110 mg/l in the month September and January respectively. The concentration of SO4 ranged from 24-2439 mg/l in the month
July and February respectively. Sodium (Na) ranged from 32-9195 mg/l in the month August and July respectively. Ca ranged from 32-348 mg/l in the month September and March, Mg ranged from 17-829 in the month September and February respectively. Similarly in the year 2009 also al the same parameters were found exceeding their desirable limits.
3.5 Surface water quality of the River Tapti at L & T Jetty Region:
In this region 12 variables were found exceeding their desirable limits namely Turbidity, Temp, TDS, DO, BOD, Cl, Hardness, SO4, Na, Ca, Mg, and Fe. Turbidity ranged from 10-19
in the month May and February, Temp ranged from 27-30°C and it was highest in the month December. TDS ranged from 3326-22472 NTU, DO ranged from 1.96-6.9 mg/l, BOD ranged 1.3-4.38 mg/l in the month July, August and April respectively and Cl ranged from 1450-9550 mg/l in the month July and December respectively. Hardness ranged from 620-6560 mg/l in the month October and August, April. The concentration of SO4 ranged from 246-
4230 mg/l in the month November and January respectively. Concentration of Na ranged from 104-12642 mg/l in the month November and March, Ca ranged from 84-410 mg/l in the month November and July respectively. Concentration of Mg ranged from 114-1094 mg/l in the month September and March respectively. All the other parameters were within their desirable limits in the year 2008. In the year 2009 also same 12 variables were found exceeding their desirable limits.
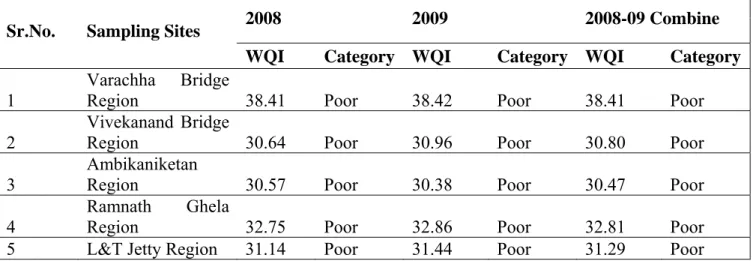
On the basis of above data the Water Quality Index (WQI) of each sampling site for the year 2008, 2009 was find out. Combined WQI for the years 2008-09 was also find out. Depending upon WQI the water quality was categorized according to the guideline laid by CCME. Table
2 shows the WQI of various region of River Tapti.
Table 2. Water Quality Index (WQI) of different sampling sites of the River Tapti, Surat
2008 2009 2008-09 Combine
Sr.No. Sampling Sites
WQI Category WQI Category WQI Category 1 Varachha Bridge Region 38.41 Poor 38.42 Poor 38.41 Poor 2
Vivekanand Bridge
Region 30.64 Poor 30.96 Poor 30.80 Poor
3
Ambikaniketan
Region 30.57 Poor 30.38 Poor 30.47 Poor
4
Ramnath Ghela
Region 32.75 Poor 32.86 Poor 32.81 Poor
5 L&T Jetty Region 31.14 Poor 31.44 Poor 31.29 Poor
Table 2 shows that the entire sampling site from upstream to downstream is having poor water quality, which indicates that the water of the River Tapti is highly polluted, which
indicate that the water body is being affected by industrialization and anthropogenic activities and not suitable for any purpose.
To identify the parameters which are most significantly affecting the WQI we have done correlation analysis, testing of hypothesis, factor analysis and regression Analysis by using SPSS (Statistical Package for Social Science). Correlation coefficient was calculated by Karl Pearson’s measure, Factor analysis was calculated by extraction of factor by principal component method. In this present study we considered WQI as dependent variable and the statistically significant parameters as independent variable. Statistical analysis was done for all the sampling site collectively for the year 2008, 2009 and for the year 2008-09 combined also.
3.6 Statistical Analysis of Surface water for the Year 2008:
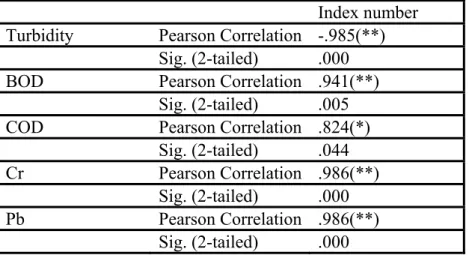
First of all, we have studied the correlation of variables with Water Quality Index (WQI) and identified statistically significantly correlated variables for the year 2008. Table 3 shows statistically significant variables.
Table 3. Significantly correlated variables with Water Quality Index for the year 2008
Index number
Turbidity Pearson Correlation -.985(**)
Sig. (2-tailed) .000
BOD Pearson Correlation .941(**)
Sig. (2-tailed) .005
COD Pearson Correlation .824(*)
Sig. (2-tailed) .044
Cr Pearson Correlation .986(**)
Sig. (2-tailed) .000
Pb Pearson Correlation .986(**)
Sig. (2-tailed) .000
** Correlation is significant at the 0.01 level (2-tailed). * Correlation is significant at the 0.05 level (2-tailed).
Out of these 23 variables only 5 variables namely Turbidity, BOD, COD, Cr and Pb were found statistically significant for Water Quality Index. Using these statistically significant variables, Regression model was fitted for Water Quality Index (WQI), which indicates that COD and Pb shows highly significant correlation (99%) with Water Quality index. Analysis of variance shows that the calculated p value 0.001 is less than alpha value (0.05), which implies that the group of explanatory variables shows a statistically significant relationship with the dependent variable.
This means that for the surface water the most affecting variables are COD and Pb. In the next preference Turbidity and BOD come, in the third preference Cr and rest of the variables can be considered as under control and within their desirable limit. So to improve water quality of Tapti River we must emphasis upon these variables. If not, then in future also surface WQI is likely to be around 39.7334 with Standard Deviation 17.3343. And minimum and maximum
values are 30.637 and 74.613 respectively, which indicate that the quality is suppose to be poor all the sampling sites.
3.7 Statistical Analysis of Surface water for the Year 2009:
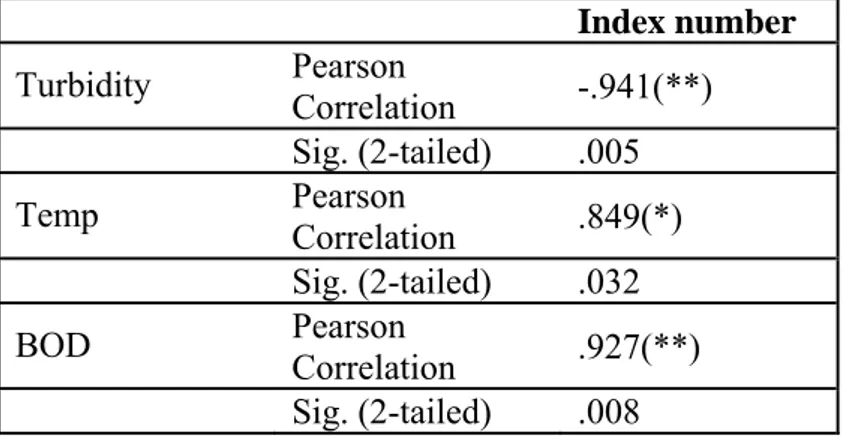
For the year 2009 also, we have studied the correlation of variables with Water Quality Index (WQI) and identified statistically significantly correlated variables for the year 2009. Table-3 shows statistically significant variables.
Table 4. Significantly correlated variables with Water Quality Index for the year 2009.
Index number Turbidity Pearson Correlation -.941(**) Sig. (2-tailed) .005 Temp Pearson Correlation .849(*) Sig. (2-tailed) .032 BOD Pearson Correlation .927(**) Sig. (2-tailed) .008
** Correlation is significant at the 0.01 level (2-tailed). * Correlation is significant at the 0.05 level (2-tailed).
Out of these 23 variables only 3 variables namely Turbidity, Temp and BOD were found statistically significant. Using these statistically significant variables, Regression model was fitted for Water Quality Index (WQI), which indicates that Temperature, Turbidity and BOD shows highly significant correlation (98%) with Water Quality index. Analysis of variance shows that the calculated p value 0.027 is less than alpha value (0.05), which implies that the group of explanatory variables shows a statistically significant relationship with the dependent variable.
This means that for the surface water the most affecting variables are Turbidity, Temp and BOD and attention should be given to these variables. If the same situations prevail, then in future also the WQI is likely to be 39.7546 with Standard Deviation 16.96. And minimum and maximum values are 28.7067 and 73.2692 respectively (Table-3.2.12). So it can be interpreted that in future the water quality is suppose to be poor at all the sampling sites. Similar findings have been reported for Ram Ganga River [11].
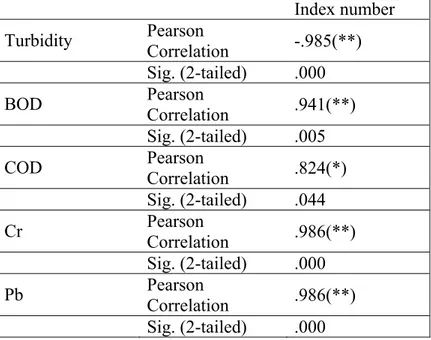
3.8 Statistical Analysis of Surface water for the Year 2008-09:
Table 5. Significantly correlated variables with Water Quality Index for the year 2008-09 Index number Turbidity Pearson Correlation -.985(**) Sig. (2-tailed) .000 BOD Pearson Correlation .941(**) Sig. (2-tailed) .005 COD Pearson Correlation .824(*)
Sig. (2-tailed) .044 Cr Pearson Correlation .986(**) Sig. (2-tailed) .000 Pb Pearson Correlation .986(**) Sig. (2-tailed) .000
** Correlation is significant at the 0.01 level (2-tailed). * Correlation is significant at the 0.05 level (2-tailed).
Out of these 23 variables only 5 variables namely Turbidity, BOD, COD, Cr and Pb were found statistically significant. Using these statistically significant variables, Regression model was fitted for Water Quality Index (WQI), which indicates that Turbidity and Pb shows highly significant correlation (99%) with Water Quality index. Analysis of variance shows that the calculated p value 0.000 is less than alpha value (0.05), which implies that the group of explanatory variables shows a statistically significant relationship with the dependent variable.
This means that for the surface water the most affecting variables are Turbidity and Pb and attention should be given to these tow variable most.
Statistical analysis shows that, if the same situation prevails in future also, then the surface water quality index is likely to be around 39.7334 with Standard Deviation 17.3343. And minimum and maximum values are 30.637 and 74.613 respectively.
To prove our null hypothesis we have done Wilcoxon Signed Ranks Test (Non-Parametric Tests).
HO:Index2009 < Index2008
(
)
(
)
) 18 ( ) 14 ( 18 3 21 2 ) 1 ( , 3 14 7 05 . 0 , 6 ) 1 ( = < = ∴ = − = − + = ∴ = ∴ = = ∴ = = ∴ = = ∴ + − + −∑
∑
value Table T W n n W W Positive is D where R T negative is D where R T n i i i i α α α αHere, the Table value is higher than the T+ so,H0 cannot be rejected and it can be interpreted
that the water quality Index is decreased in the year 2008 than in the year 2009. On the bases of comparison of water quality indices, there is statistical significant evidence to say that the surface water quality is decreased [10].
4 CONCLUSIONS
Present study shows that the water quality of River Tapti of Surat district is poor as per Water Quality Index. Water body is under high stress of industrialization and urbanization. Out of five sampling sites not a single site is having excellent or good water quality. This implies that the water quality is almost always threatened or impaired; conditions usually depart from natural or desirable levels. Public awareness with respect to the need to boil and/or filter the water before drinking is called for. Sanitary facilities to control river pollution and appropriate water treatments techniques are required in the area to improve the welfare of the riparian dwellers
.
More over It must be noted that the water quality is deteriorated from upstream to downstream. Our study also shows that the surface water quality of Surat is mostly being affected by the variables COD, Pb, Turbidity, BOD and Temperature. So, to improve the surface water quality in Surat the attention should be given to control the COD, Pb, Turbidity, BOD variables. On the bases of comparison of water quality indices, there is statistical significant evidence to say that the surface water quality is decreased.Furthermore there is statistical evidence to say that water quality will be poorer in the future also.
5 REFERENCES
[1] Pandit, B. R., and Oza, F. 2004. Int. J. Bioscience Reporter, 2(2), 232-234.
[2] World Health Organization 1995. WHO Guidelines for Drinking Water Quality. 2nd edn. WHO, Geneva.
[3] Indian Council of Medical Research, ICMR 2000. “Guidelines for Drinking Water Standards”. New Delhi.
[4] Bureau of Indian Standards (BIS) 1991. Indian Standards for Drinking Water BIS 10500. [5] Standard Methods for the Examination of Water and Wastewater. 1975. 20th Ed. American
Public Health Association (APHA), American Water Works Association, Water Environment Federation.
[6] Canadian Council of Ministers of the Environment (CCME) 1999.
Canadian Environmental Quality Guidelines. Winnipeg, Manitoba.
[7] Wolf and Aaron, T. 2001. “Water and Human Security”, Journal of Contemporary water
Research and Education, 29-188.
[8] Abbasi, S. A., et al. 1996. “Studies on limnology of Kuttiadi Lake North Kerala”, Eco.
Env and Cons. 2, 17-27.
[9] Khan N., Mathur A. and Matur R. 2005. “A study on drinking water quality in Lashkar (Gwalior)”. Indian J. Env. Port. 25 (3), 222-224.
[10] Rastogi, G. K., Saxena, A. and Sinha, D. K. 2009. “Statistical regression analysis of water quality parameters: An approach to underground water quality management”. J.
Environ. Res. Develop., 4 (1), 83-89.
[11] Sinha, D. K., Saxena, S. and Saxena, R. 2004.“Water quality index for Ram Ganga River at Moradabad”. Poll. Res., 25 (3), 539-543.