© 2019 Patriarca, Di Gravio, Constantino & Tronci. This is an Open Access article distributed under the terms of the Creative Commons Attribution-NonCommercial 4.0 International License (http://creativecommons.org/licenses/by-nc/4.0), permitting all non-commercial use, distribution, and reproduction in any medium, provided the original work is properly cited.
ISBN: 978-91-88898-41-8
WHO? WHAT? WHERE? WHEN?
A SCIENTOMETRICS PERSPECTIVE ON
RESILIENCE ENGINEERING
Patriarca Riccardo
1Giulio Di Gravio
1Francesco Costantino
1Massimo Tronci
11) Department of Mechanical and Aerospace Eng. Sapienza University of Rome, Italy
Abstract
This paper presents an exploratory research on the application of bibliometric methods to the field of Resilience Engineering. Starting from the Kuhnian idea on the structure of scientific revolutions, the aim of this research is to define centres of research and explore how their focus changes over time. The research developments have been traced by studying the science footprints revealed by scholarly publications. Such publications constitute a dynamic and self-organizing knowledge repository which is often difficult to understand systemically. By means of bibliometric indicators, this paper aims to identify who are the major authors in the field, what are the “invisible colleges”, which sources publish main documents, and the respective significant changes over years. A further analysis has been based on the usage of Pennant diagrams for scientometrics, with the purpose of exploring the relevance of an author within a certain literature database, and with respect to other authors.
Through this multi-method exploratory research, we aim to provide an interpretative summary on the research of past and current community of resilience engineers. The analysis aims to define the structure of the scientific field and of the scientific community, proving the usability of meta-analytic tools coming from scientometrics for the analysis of an inter-disciplinary scientific domain such as Resilience Engineering.
Keywords: scientometrics, bibliometric analysis, resilience engineering, review, Pennant
diagrams.
1. INTRODUCTION
The etymology of “resilience” acquires a combined meaning of hardness and elasticity, i.e. the property that allows rebounding after a shock, either literally or figuratively. At a system level, the notion has been extended following the stability against disturbances and perturbations, especially with reference to ecology [1].
For socio-technical systems, the term has been further expanded with the principles coming from cognitive ergonomics, human reliability and organizational management to describe the ability of a system to adjust its operation before, during or after changes or disturbances, in order to ensure the required operativity, under expected or unexpected conditions. Resilience
Engineering (RE), bore gathering the original confused consensus in the field of safety management [2].
Even if RE does not necessarily restrict its focus to a particular type of performance, its main domain of interest relates to safety, directly or indirectly. Following Kuhn terms, RE has been appointed as a paradigm shift for safety management. The usage of “paradigm shift” was intended to characterize the role of Resilience Engineering as a fundamental change in the basic concepts and experimental practices of safety management. Paradigm shift contrasts the notion of normal science, which represents the research work done within a prevailing paradigm. Since the first Resilience Engineering Association (REA) symposium held in 2004, many efforts have been conducted for both theoretical and methodological advancements, thus contributing to the intellectual structure of the field. Nowadays, the field encompasses a wide range of contributions, ranging from pure technical topics to social, through mixed socio-technical research. That’s one of the aims of RE: advocating for a scientific approach capable of integrating the socio-technical aspects of work.
More than 15 years after the first REA symposium, this manuscript aims to provide an in-depth exploration of the field by means of techniques coming from scientometrics, i.e. the discipline that analyzes the quantitative aspects of science. The aim of this paper is to provide data on the field and unveil thematic relationships, with the ultimate purpose of supporting researchers at identifying main topics (and related authors), as a support for future research.
The remainder of this paper is organized as follows. Section 2 details the methodology used in the paper. Section 3 presents the results of the applied methods. Section 4 discusses the obtained results, and lastly the conclusions summarize the outcome of the study and provide ideas for future research.
2. METHODOLOGY
Scientometrics is tightly linked to bibliometrics: a scientometrics study of a scientific field can be performed through the analysis of the field’s immediate and tangible outputs, i.e. papers, proceedings, books [3]. On this path, it is possible to take advantage of bibliometric mapping techniques to better understand the structure and dynamics of an intellectual structure. Various types of maps can be defined, with the possibility of setting the focus on authors, institutions, journals, documents, or keywords. For these maps, the analysis generally relies on simple counting, citations or even co-citations. Elements are connected through links representing the relationship between two items. For example, co-authorship is often used as a measure for quantifying and analyzing collaboration between authors, departments, disciplines, or countries. Bibliographic couplings link publications in terms of citations or co-citations, and co-occurrence links terms. In all these cases, once defined the strength of a link, a network is developed through all the links between the relevant items.
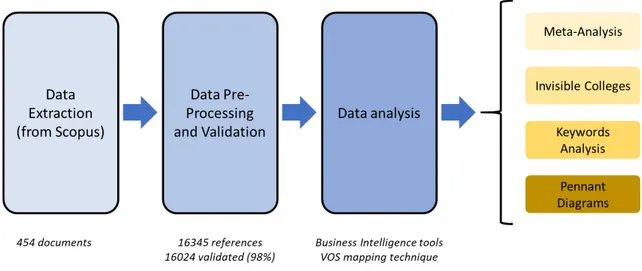
In operational terms, the first phase of the bibliometric analysis consisted of extracting bibliometric data from scientific repositories. In particular, in this research, Scopus has been identified as the reference database for two reasons: (i) nowadays, it is the biggest database of peer-reviewed literature with over 5000 publishers and over 71 million records fairly balanced among technical and social aspects of science; (ii) it allows a well-structured exporting either through its APIs or through manageable export files (.ris, .csv) [4].
As a second step, starting from the exported data, data have been pre-processed through Python and Power Query to define clean and usable database. Since the main aim of this work consisted
of identifying the scientific structure of the field, it has been selected a non-restrictive search key, selecting papers with the terms “Resilience Engineering” either in title, abstract or keywords, i.e. TITLE-ABS-KEYWORDS (“Resilience Engineering”) updated until March 2019. The database included 455 documents. One of them was neglected because considered not relevant for the analysis: a 1987 conference paper dealing with the combat resilience for army combat damage. The 454 documents share 16345 references: 16024 documents were included in the subsequent analyses after a data validation procedure aimed at removing incomplete or incorrect data (98% of the references were studied).
Then, for the data analysis, two software have been used. Besides bibliometric statistics in Microsoft Power BI (see §3.1), VOSviewer has been used for bibliometric mapping, at author (see §3.2), term (see §3.3) and source (see §3.4) level, and CiteSpace have been used for the development of Pennant diagrams.
Figure 1. Phases of the study.
The methodology for building the bibliometric maps relies on the VOS mapping technique. This latter requires a similarity matrix, which traditionally derives from a normalized co-occurrence matrix. Rather than using the Jaccard index, the map built here refers to the association strength as a similarity measure. The association strength between document i-th and j-th (𝑠𝑠𝑖𝑖𝑖𝑖) allows defining a similarity index as follow:
𝑠𝑠𝑖𝑖𝑖𝑖 =𝑤𝑤𝑐𝑐𝑖𝑖𝑖𝑖 𝑖𝑖𝑤𝑤𝑖𝑖
Where 𝑐𝑐𝑖𝑖𝑖𝑖 is the number of co-occurrences of items i and j, and 𝑤𝑤𝑖𝑖(𝑤𝑤𝑖𝑖) the total number of occurrences of items i and j. This metric has been reported to be more helpful if compared with traditional multidimensional scaling techniques, especially for large number of elements [5]. Once calculated 𝑠𝑠𝑖𝑖𝑖𝑖 for every couple of documents i and j, it is possible to construct a two-dimensional map in which the n items are located in a way, whose distance reflects their similarity 𝑠𝑠𝑖𝑖𝑖𝑖: high value of 𝑠𝑠𝑖𝑖𝑖𝑖 implies close items, and vice versa. The problem is solved mathematically by means of a majorization algorithm, developed as a variant of the SMACOF algorithm [6]. The same logic applies for multiple types of occurrence matrix, (e.g.) co-authorship, co-source, co-institutions matrixes.
3. DATA ANALYSIS
3.1. MAIN STATISTICAL ANALYSIS
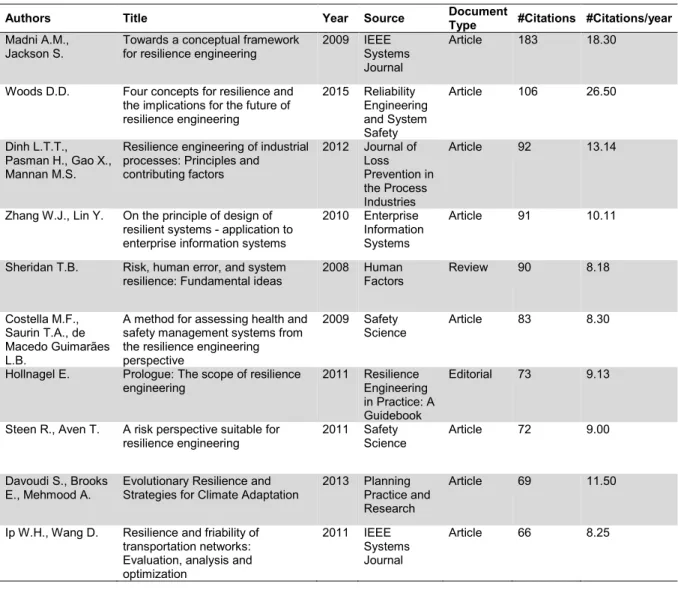
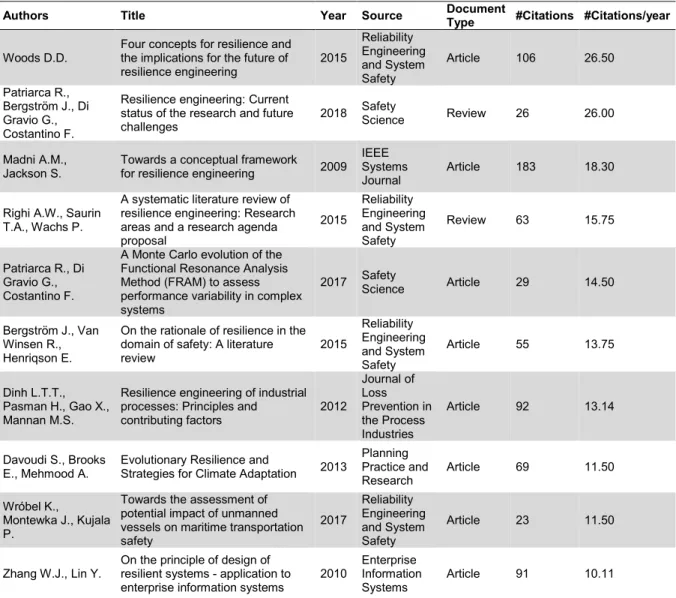
Some preliminary statistics can be helpful to obtain an overall framework. Among the set of data analysis provided in the text, a general overview is depicted in Figure 2, highlighting the distribution of open access documents. Until March 2019, 446 documents have been listed in Scopus, according to the increasing trend shown in Figure 2, where only 10.6% of them have been published as open access. Further attention has been devoted to citation analysis. On average, each document has 15.44 citations, and 2.16 average citations per year. Restricting the analysis only to journal articles, these latter acquire 3.06 citations per year on average, with a peak for documents published in 2009 (7.5 citations per year), mainly due to the document authored by Madni and Jackson published in IEEE Systems Journal (averagely, 9.46 citation per year) [7]. In terms of most cited journal articles, Woods’ document “Four concepts for resilience and the implications for the future of resilience engineering” is the most cited one (106 citations), and the one with the highest number of average citations per year (26.5 citations/year) [8]. Further details are reported in Appendix 1. More aspects on authors and sources relevance will be discussed in the following paragraphs (see §3.2-3.4), and available in the dynamic dashboard referenced in §5.
3.2. INVISIBLE COLLEGES
In late 1960s, a branch of sociologists started investigating the social structures of authors who work on similar research problems, leading to the notion of invisible college [9]. Modern societal and technological environment allow for wider collaborations, limiting the constraints imposed by geographical separation. Collaboration between scientists who share some types of communications or shared interpretations of a scientific field is favored. Consequently, invisible colleges become often the effect of large international co-operations. Nevertheless, measuring such social organization could be a difficult task, because it may rely on informal communication about research findings, research strategy, opinions, shared privately or by means of social network messages (e.g., Twitter, LinkedIn).
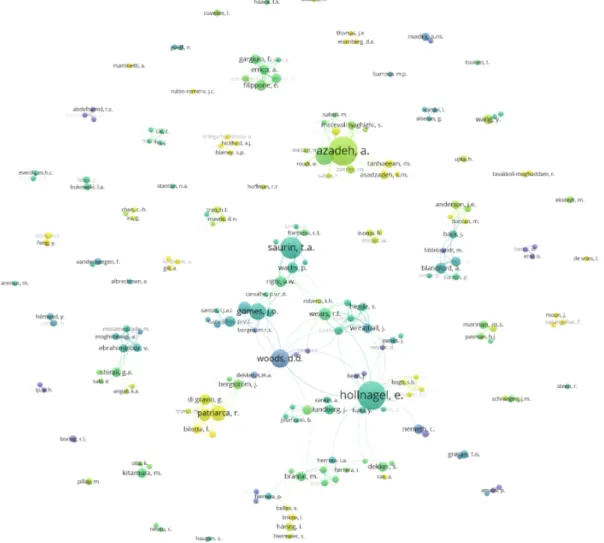
Following a simple hypothesis, this research considers co-authorship as a proxy measure of the social relationships between authors, i.e. the higher the number of co-authored documents, the tighter the link between those authors. Results of co-authorship maps are depicted in Figure 2, which includes the authors of at least 2 documents. The size of the bubble represents the number of documents authored by an author, while the colors are proportional to the average year of publication of the documents authored by the author him/herself.
3.3. KEYWORDS ANALYSIS
Similarly, the keyword analysis aims at presenting a map able to show the relevant terms and their interactions, both following a clustering algorithm, and a timeline horizon. This analysis has been performed in order to identify the main topics in the corpus of a text. The co-occurrence map has been built based on the terms present in title, abstract, keywords, by means of a probabilistic latent semantic analysis aimed at filtering relevant words. Figure 4 presents a map where the size of the bubble reflects the frequency of the term, while the dimension of each link is a function of the co-occurrence of the respective keywords in either title, abstract, or keywords.
3.4. ABOUT SOURCES
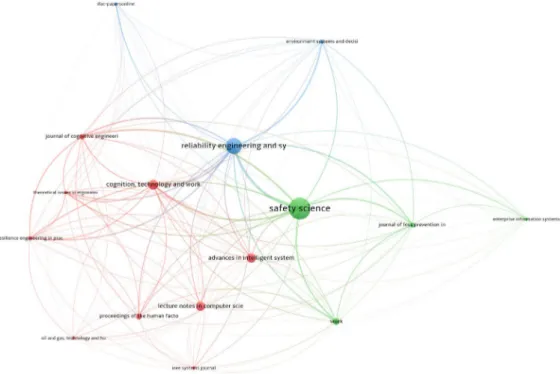
For the analysis of sources, a co-occurrence matrix has been built following the number of references shared by documents, leading to the notion of bibliographic links: a bibliographic link is a specific link between two items that cite the same document. Figure 3 highlights the
main sources (bubble size proportional to the number of documents published in the source), and the relationships between them in terms of bibliographic links. In particular, clusters are defined in terms of co-occurrences of sources in the bibliography, as an indicator of how frequently authors refer to the same source. Ideally, this metric is a proxy of the journals’ topic coverage and inter-relatedness, as illustrated by three major clusters of sources in Figure 5.
Figure 2. Documents trend in Scopus, open and subscription access. Update March 2019.
Figure 3. Co-authorship map (threshold: at least 2 documents per author). Colors reflecting average year of authored documents for each author. Update March 2019.
Figure 4. Keywords co-occurrence map (threshold: at least 5 occurrences per keyword). Colors reflecting average year of term present in title, abstract, keywords. Update March
2019.
Figure 5. Bibliographic coupling of sources (threshold: at least 5 occurrences per source). Colors reflecting different clusters of sources, based in bibliographic links. Update March
3.5. PENNANT DIAGRAM
As a complimentary analysis, this section aims to support the characterization of research clusters in relation to individual researchers, around whom scholarly literatures have gathered over years.
Such names are frequently co-cited with other authors, who pursue a similar research agenda. The entire analysis starts from the assumption that if citers repeatedly co-cite some authors, there are -possibly latent- thematic relationships and reasons for it [10].
Labelling each author individually is generally not sufficient for understanding these relationships: it is rather required an approach to reveal the intellectual company a seed author keeps over years. Pennant diagrams are graphs to visualize such aspects for specific literature elements (e.g., authors), whose frequency counts in a database is weighted according to analytical expressions derived from relevance theory. This latter is grounded on the assumption that human cognition tends to maximize relevance, as a property of inputs for a human mind, and it can be categorized in perceptions and communications. This theory can be thus used to understand how readers can grasp writers’ underlying concepts from a text, i.e. how an individual pays attention to terms considered relevant [11]. Relevance is thus intended as the combination of two factors: (i) the cognitive effects of the input (the way new inputs interact with the existing context of assumptions), (ii) the efforts needed to process it.
For the purpose of providing measures for these ordinal factors, it is defined the Term Frequency (TF) and the Document Frequency (DF). TF is defined as a count of how frequently a query term appears in any document in the database; DF is the count of how many documents contain the query item. IDF (Inverse Document Frequency) is obtained inverting DF and scaling its value by the number of documents (N) in the database. Consequently, IDF assigns higher importance to authors that are present in the database less frequently, under the assumption that they would be more specific to the searcher’s interest. On the contrary, IDF penalizes those authors, being common in the database, that are inherently less informative for the specific topic at hand.
Following relevance theory, TF is a proxy measure of the cognitive effects on the researcher (the user who performs the literature search), while IDF predicts his/her processing effort. This latter dimension can be also defined as ease of processing, so that high value implies easy information process, and vice versa. In operational terms, running the analysis for authors, TF is the seed author’s co-citation count with the other authors, DF is the total citation count for each of the authors in the database, and N total document records in the database. It can be observed that by definition TF and DF are necessarily equal for the seed author.
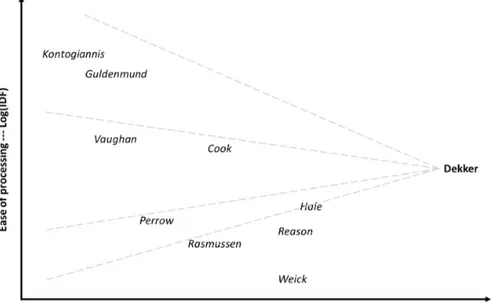
In graphical terms, the Pennant diagram presents respectively on the x-axis the cognitive effects, and on the y-axis the ease of processing. On the horizontal axis, authors with higher co-citation count with the seed are represented closer to the seed: when these authors are read with the seed, the cognitive effects on the reader will be greater. On a vertical axis, the lower an author’s total citation count, the higher that author is placed on the vertical axis: high located authors are supposed to be easier to relate to the seed than low located authors. For example, Figure 5 presents the Pennant diagram referred to Sidney Dekker.
4. DISCUSSION
The analysis performed in this research is explorative by nature. Therefore, this discussion offers just limited perspectives on possible observations that can be gathered from either individual or combined approaches. For example, it can be observed that there are sub-communities of researchers who are not evidently related to traditional REA community. As an example, the literature interest in the work by Madni and Jackson [7] in part offers a substantial alternative to the widely discussed four cornerstones of resilience proposed by Hollnagel (responding, anticipating, learning, monitoring) [12]. However, those authors (see Figure 3) are
not actively involved in the strongly rooted REA community. Similarly one of the most productive authors in the field, i.e. Azadeh (along with his colleagues), remains unconnected from the rest of the community (see Figure 3). Despite the major bridges represented by Hollnagel and Woods, who allows connections among European, US, and south-American (mainly Brasilian) researchers, multiple authors worldwide, and their associated labs, remain disconnected from the community.
Figure 6. Pennant diagram for Dekker (qualitative thresholds).
From the average years of the authors included in the analysis, it is also possible to extend such reflections over years, discovering (e.g.) which are the most recent collaborations, or those that are well-consolidated.
Extending the analysis to Pennant diagrams analysis, from Figure 6, it is possible to empirically gather observations about authors positioning with respect to other main authors. On the top part of the graph, there are authors with few citations in the database, and consequently more specifically related to Dekker. Therefore, extracting relationships after reading together the works authored by Kontogiannis, or Guldenmund with Dekker’s research, it should be easier than finding correspondence with Perrow’s, Rasmussen’s, Hale’s, or Reason’s research. About the former authors: Kontogiannis works on modelling aspects following a human factor and cognitive engineering perspective, Guildenmund works more generally on safety culture. On the contrary, Perrow, Rasmussen, Hale and Reason, even if largely cited with Dekker (as proved by the closeness on the x-axis), are largely cited in the database even without Dekker (low positioning on the y-axis) making not obvious their specific thematic relationships. As a further clarification, in relative terms, Perrow’s positioning on the left side of the diagram implies a minor number of co-citations with Dekker. The middle sector, occupied by Cook and Vaughan depicts those authors with a similar number of citations with the author seed in the database. As such, these authors can be considered peers of the seed. What is thus the advantage of a Pennant diagram in a literature review? Pennant diagrams are here developed to support - or even inspire - explorative research questions, such as: is an author linked to another one? Which are the closer authors to a seed author? A Pennant may enforce or eliminate some assumptions, even leading to new conclusions, driving the user at prioritizing the analysis of specific subset of documents, with the ultimate purpose of reducing the cognitive efforts for such tasks [10].
Currently, only 10% of documents are published open access, which is not a surprising number if compared with other science fields. Nevertheless, since the topics of this field are largely oriented to industrial practices, it becomes crucial the role of open documents to spread academic results among community of practitioners. Currently REA conference proceedings in Scopus are partly indexed, i.e. chapters of books coming from selected conference papers, or articles selected as contributions in a 2015 special issue of Reliability Engineering and System Safety. Starting from a bibliometric analysis of these contributions, it is worthy noticing that the 2015 special issue manuscripts have been largely cited in literature with 368 citations since 2015, 33.5 average citations per document.
Similar exemplar discussions motivate few additional questions.
For example, it remains open to discussion if there might be the chance (or the need) to consider the development of a journal more specifically dedicated to Resilience Engineering community, possibly with open access publications accessible by practitioners, may be to be linked somehow to REA memberships. Should this journal cover topics in both cognitive, engineering and social aspects of the field, being a means of connection for different audiences (cf. Figure 5)?
Focusing on the keywords analysis, it seems that there is an increasing trend of analysis focused on risks, and relative quantitative or simulation models (see more recent keywords in Figure 4). Is this a chance to enlarge the topics of Resilience Engineering in the specific attempt to address open challenges about quantifiability and data analysis, even considering recent paradigms (cf. e.g. Industry 4.0 [13])?
Combining these reflections, with the analysis of invisible colleges, what could be the role of REA to empower multi-disciplinary collaborations, which have been acknowledged [14] to be crucial for the future of Resilience Engineering itself?
5. CONCLUSIONS
This paper presents some scientometrics analysis for exploring a literature field. It has to be noted that, for such analyses, it is required to have bibliometric data in a structured format. As such, Scopus has been adopted as the main reference. Consequently, not-indexed conference proceedings and other type of grey literature have not been included in the analyses, limiting somehow the scope of the analysis itself.
Furthermore, the analysis of invisible colleges relied here only on co-authorship. While this assumption remains somehow significant as a first layer of analysis, it has to be noted that further metrics could be considered (e.g., bibliographic relationships, social interactions), possibly to be uncover by questionnaires submitted to main authors for detecting informal collaborations.
Lastly, in an attempt to support future researchers in developing analysis to discover such trends, data and relationships, the authors designed and published openly a summary dynamic dashboard1. The dashboard updated regularly (starting from April 2019) is intended to be a basis for bibliographic data even for those users who do not have access to academic databases, providing updated results with respect to those available in this paper.
As a final summary note, the authors of this manuscript want to emphasize that scientometrics, besides the large positive advantages, can at best only hints for researchers, being ancillary to document reading, not substitutes for it.
REFERENCES
[1] C. S. Holling, “Engineering resilience versus ecological resilience,” Eng. within Ecol.
constraints, pp. 31–43, 1996.
[2] S. Dekker, “Resilience engineering: Chronicling the emergence of confused
consensus,” in Resilience Engineering: Concepts and Precepts, E. Hollnagel, D. D. Woods, and N. Leveson, Eds. Ashgate Publishing, Ltd., 2006, pp. 77–94.
[3] W. W. Hood and C. S. Wilson, “The literature of bibliometrics , scientometrics , and informetrics,” Scientometrics, vol. 52, no. 2, pp. 291–314, 2001.
https://doi.org/10.1023/A:1017919924342
[4] Elsevier, “Scopus, an eye on global research,” 2018.
[5] N. J. van Eck and L. Waltman, “Software survey: VOSviewer, a computer program for bibliometric mapping,” Scientometrics, vol. 84, no. 2, pp. 523–538, 2010.
https://doi.org/10.1007/s11192-009-0146-3
[6] I. Borg and P. Groenen, Modern Multidimensional Scaling: Theory and Applications, vol. 94, no. 445. Springer Science, 2006.
[7] A. M. Madni and S. Jackson, “Towards a conceptual framework for resilience engineering,” IEEE Syst. J., vol. 3, no. 2, pp. 181–191, 2009.
https://doi.org/ 10.1109/JSYST.2009.2017397
[8] D. D. Woods, “Four concepts for resilience and the implications for the future of resilience engineering,” Reliab. Eng. Syst. Saf., vol. 141, 2015.
https://doi.org/10.1016/j.ress.2015.03.018
[9] D. Crane, “Social structure in a group of scientists: a test of the ‘invisible college’ hypothesis,” Am. Sociol. Rev., vol. 34, no. 3, pp. 335–352, 1969.
https://doi.org/ 10.2307/2092499
[10] H. D. White, “Co-cited author retrieval and relevance theory: examples from the humanities,” Scientometrics, vol. 102, no. 3, pp. 2275–2299, 2014.
https://doi.org/10.1007/s11192-014-1483-4
[11] D. Wilson, “Relevance and the interpretation of literary works,” Univ. Coll. London
Work. Pap. Linguist., vol. 23, pp. 69–80, 2011.
[12] E. Hollnagel, “The four cornerstones of resilience engineering,” in Resilience
Engineering Perspectives. Volume 2: Preparation and restoration, C. P. Nemeth, E.
Hollnagel, and S. Dekker, Eds. Ashgate Publishing, Ltd., 2009, pp. 117–134.
[13] H. Lasi, P. Fettke, H.-G. Kemper, T. Feld, and M. Hoffmann, “Industry 4.0,” Bus. Inf.
Syst. Eng., vol. 6, no. 4, pp. 239–242, 2014. https://doi.org/10.1007/s12599-014-0334-4
[14] R. Patriarca, J. Bergström, G. Di Gravio, and F. Costantino, “Resilience engineering: Current status of the research and future challenges,” Saf. Sci., vol. 102, pp. 79–100, 2018. https://doi.org/10.1016/j.ssci.2017.10.005
APPENDIX 1.
Table 1. Top 10 journal papers by total count of citations. Update March 2019.
Authors Title Year Source Document Type #Citations #Citations/year
Madni A.M.,
Jackson S. Towards a conceptual framework for resilience engineering 2009 IEEE Systems Journal
Article 183 18.30 Woods D.D. Four concepts for resilience and
the implications for the future of resilience engineering 2015 Reliability Engineering and System Safety Article 106 26.50 Dinh L.T.T., Pasman H., Gao X., Mannan M.S.
Resilience engineering of industrial processes: Principles and contributing factors 2012 Journal of Loss Prevention in the Process Industries Article 92 13.14
Zhang W.J., Lin Y. On the principle of design of resilient systems - application to enterprise information systems
2010 Enterprise Information Systems
Article 91 10.11 Sheridan T.B. Risk, human error, and system
resilience: Fundamental ideas 2008 Human Factors Review 90 8.18 Costella M.F.,
Saurin T.A., de Macedo Guimarães L.B.
A method for assessing health and safety management systems from the resilience engineering perspective
2009 Safety
Science Article 83 8.30 Hollnagel E. Prologue: The scope of resilience
engineering 2011 Resilience Engineering in Practice: A Guidebook
Editorial 73 9.13
Steen R., Aven T. A risk perspective suitable for
resilience engineering 2011 Safety Science Article 72 9.00 Davoudi S., Brooks
E., Mehmood A. Evolutionary Resilience and Strategies for Climate Adaptation 2013 Planning Practice and Research
Article 69 11.50 Ip W.H., Wang D. Resilience and friability of
transportation networks: Evaluation, analysis and optimization
2011 IEEE Systems Journal
Table 2. TOP 10 journal papers by average count of citations per year. Update March 2019.
Authors Title Year Source Document Type #Citations #Citations/year
Woods D.D. Four concepts for resilience and the implications for the future of
resilience engineering 2015 Reliability Engineering and System Safety Article 106 26.50 Patriarca R., Bergström J., Di Gravio G., Costantino F.
Resilience engineering: Current status of the research and future
challenges 2018 Safety Science Review 26 26.00 Madni A.M.,
Jackson S. Towards a conceptual framework for resilience engineering 2009 IEEE Systems
Journal Article 183 18.30 Righi A.W., Saurin
T.A., Wachs P.
A systematic literature review of resilience engineering: Research areas and a research agenda proposal 2015 Reliability Engineering and System Safety Review 63 15.75 Patriarca R., Di Gravio G., Costantino F.
A Monte Carlo evolution of the Functional Resonance Analysis Method (FRAM) to assess performance variability in complex systems
2017 Safety Science Article 29 14.50 Bergström J., Van
Winsen R., Henriqson E.
On the rationale of resilience in the domain of safety: A literature
review 2015 Reliability Engineering and System Safety Article 55 13.75 Dinh L.T.T., Pasman H., Gao X., Mannan M.S.
Resilience engineering of industrial processes: Principles and
contributing factors 2012 Journal of Loss Prevention in the Process Industries Article 92 13.14 Davoudi S., Brooks
E., Mehmood A. Evolutionary Resilience and Strategies for Climate Adaptation 2013
Planning Practice and Research Article 69 11.50 Wróbel K., Montewka J., Kujala P.
Towards the assessment of potential impact of unmanned vessels on maritime transportation safety 2017 Reliability Engineering and System Safety Article 23 11.50
Zhang W.J., Lin Y. On the principle of design of resilient systems - application to
enterprise information systems 2010
Enterprise Information