http://www.scirp.org/journal/psych ISSN Online: 2152-7199
ISSN Print: 2152-7180
Assessing Exposure to Bullying through Digital
Devices in Working Life: Two Versions of a
Cyberbullying Questionnaire (CBQ)
Sandra Jönsson
1, Tuija Muhonen
1, Rebecka Cowen Forssell
1, Martin Bäckström
2 1Centre for Work Life Studies, Malmö University, Malmö, Sweden2Department of Psychology, Lund University, Lund, Sweden
Abstract
The aim of this study is two folded: 1) to analyze the reliability and validity of a cyberbullying behaviour questionnaire (CBQ) in working life and 2) to ana-lyze the reliability and validity of a short version of a cyberbullying behaviour questionnaire (CBQ-S) in working life. A total of 3371 working adults (MAge =
49.85 years) in Sweden, and 238 (MAge = 35.61 years) in the USA participated
in the study. The results of the Exploratory Structural Equation Modeling (ESEM) showed that the one-factor model had an excellent fit to data, and Cronbach’s alpha indicates that both scales are reliable. In addition, the crite-rion validity of the scales was demonstrated by significant correlations with the following theoretically relevant concepts: wellbeing, work engagement and intention to quit. The results of the study support the use of the CBQ and CBQ-S as reliable and valid measures of cyberbullying behaviour in working life.
Keywords
Cyberbullying Behaviour, Working Life, Psychometric Properties
1. Introduction
Communication over the Internet has become a part of everyday life. Approx-imately 82% of the Swedish population between 26 and 65 years of age go online everyday (Findahl, 2014). The development of portable devices such as laptops, smartphones, tablet computers, together with the increasing access to Wi-Fi enables people to go online and be connected anywhere, at any time. Even com- munication in workplaces increasingly takes place electronically, not only through e-mails and text messages, but also through social media such as Facebook,
How to cite this paper: Jönsson, S., Mu- honen, T., Forssell, R. C., & Bäckström, M. (2017). Assessing Exposure to Bullying through Digital Devices in Working Life: Two Versions of a Cyberbullying Question-naire (CBQ). Psychology, 8, 477-494.
https://doi.org/10.4236/psych.2017.83030
Received: January 2, 2017 Accepted: February 24, 2017 Published: February 27, 2017 Copyright © 2017 by authors and Scientific Research Publishing Inc. This work is licensed under the Creative Commons Attribution International License (CC BY 4.0).
http://creativecommons.org/licenses/by/4.0/
Twitter, social forums and digital communities.
Digital communication that has harassing features has been labeled as cyber-bullying or online harassment (Wolak, Mitchell, & Finkelhor, 2007). Whereas cyberbullying refers to online negative acts that are repeated over time, online harassment relates to more unique, once-only acts or behaviour.
Cyberbullying among children and adolescents is a relatively well-known phenomenon. Several studies have been carried out among youngsters (Beran, 2005; Erdur-Baker, 2010; Slonje & Smith, 2008), while the phenomenon appears to be virtually unexplored among adults in working life (Bartlett & Bartlett, 2011; Göransson, Näswall, & Sverke, 2011; Privitera & Campbell, 2009). Yet, there are indications that online negative acts do not apply only to children and adolescents in school environment, but are something that also occur at the workplace (Lim & Teo, 2009; Privitera & Campbell, 2009; Sprigg, Axtell, Coyne, & Farley, 2012). Due to the limited number of studies of cyberbullying among working adults, we refer in our literature review to studies conducted among youngsters/adolescents.
1.1. Cyberbullying and Face-to-Face Bullying
Today, there is an ongoing debate as to what extent cyberbullying is the same or a different phenomenon from face-to-face bullying (Slonje & Smith, 2008). When it comes to defining face-to-face workplace bullying, most researchers agree that 1) the negative acts are conducted repeatedly and systematically over time and 2) the individuals exposed to the acts have difficulties defending themselves (Ei-narsen, Hoel, Zapf, & Cooper, 2011). In the area of cyberbullying among youngsters, the following definition has been used: “an aggressive intentional act carried out by a group or individual, using electronic forms of contact, repeat-edly and over time against a victim who cannot easily defend him or herself”
(Smith, Mahdavi, Carvalho, Fisher, Russel, & Tippett, 2008: p. 376). In some parts of the literature, it has been suggested that cyberbullying is just an exten-sion of face-to-face bullying and that the primary difference is that the negative acts have found new channels through digital devices (Olweus, 2013). On the other hand, cyberbullying has also been suggested to be a different phenomenon from face-to-face bullying; that the behaviors, the nature, and consequences of cyberbullying are different from face-to-face bullying (e.g. Runions, Shapka, Dooley, & Modecki, 2013; Wang, Nansel, & Iannotti, 2011).
Cyberbullying behaviors can be communicated via text or images through different digital media. Their common denominators are that they can be easily stored, shared, and viewed repeatedly. Among special characteristics of cyber-bullying are high accessibility, large potential audience, and the anonymity and invisibility of the perpetrators (Kowalski, Giumetti, Schroder, & Lattaner, 2014; Slonje & Smith, 2008). High accessibility through digital devices makes it diffi-cult to avoid the negative acts since the bullied individual can be targeted outside the workplace and after office hours. The negative acts can continue, or even be-gin, when the workday is actually over. As people are continuously connected to
the Internet, the victims of online harassment can be targeted whenever and wherever, making them more vulnerable, since there is no “safe haven.” On so-cial media the online negative acts can be shared and viewed several times by the audience. This in turn generates questions about what is to be considered as re-petition in cyberbullying (Slonje & Smith, 2008). For example, if a picture or a video clip is uploaded to a particular webpage, it could be argued that every hit on that webpage could be counted as repetition. Further, not seeing the facial and bodily responses of the target tends to decrease feelings of empathy (Ko-walski et al., 2014; Slonje & Smith, 2008). It can be assumed that this encourages the perpetrator to engage in gradually more severe negative acts. Cyberbullying also involves a certain amount of anonymity. By using pseudonyms, or, hijack-ing someone’s identity online, the perpetrator can send harasshijack-ing messages without revealing his/her identity.
Previous research shows extensive variation in the prevalence of workplace bullying both between and within countries (Agervold, 2007; Nielsen et al., 2009). While Scanidinavian countries show a prevalence rate between 3.5% and 16% (Einarsen & Skogstad, 1996; Mikkelsen & Einarsen, 2001) a Turkish study reported the prevalence of bullying among white-collar workers as 51% (Bilgel, Aytac, & Bayram, 2006). The varitation the rates of prevalence have been ex-plained with reference to cultural differences as well as methodological differ-ences (Nielsen et al., 2009). The limited amount of studies investigating cyber-bullying in working life indicate a variety in prevalence rates, ranging from 9% to 21% (Baruch, 2005; Brack & Caltabiano, 2014; Sprigg, Axtell, Coyne, & Farley, 2012), and a methodological inconsitency in measuring exposure (Forssell, 2016).
Studies of gender differences in victimization concerning face-to-face work- place bullying have shown contradictory results. An analysis of 53 studies showed that 62.5% of victims were women (Hoel & Vartia; Zapf, Escartin, & Einarsen, 2011) but several other studies indicate that men and women’s exposure to bul-lying has a more equal distribution (Einarsen et al., 2011; Leymann, 1996; Note-laers, Vermunt, Baillien, Einarsen, & Witte, 2011). With regard to the type of bullying behaviors, there are indications that women more often engage in social manipulation, e.g. affecting communication and social reputation, whereas men’s bullying is focused on the targeted person’s performance at work (Salin & Hoel, 2013). If there are gender differences when it comes to cyberbullying remains yet to be investigated.
As regards the consequences of face-to-face workplace bullying, it is clear that in addition to the suffering of the victim it effects both the organization and the society. For the individual, workplace bullying has proven to be related to ad-verse health effects (Zapf & Einarsen, 2001). The organizational consequences include declining efficiency, reduced creativity, increased absenteeism and staff turnover (Göransson et al., 2011). In addition, a meta-analysis of the outcomes of workplace bullying, Nielsen and Einarsen (2012) found that exposure to bul-lying is associated with both job-related and health- and well-being-related
out-comes, such as mental and physical health problems, symptoms of post-trau- matic stress, burnout, increased intentions to leave, and reduced job satisfaction and organizational commitment. Contrary to face-to-face bullying, the conse-quences of cyberbullying in working life have not yet been studied to a greater extent, but its impact can be assumed to be similar (West, Foster, Levin, Edmi-son, & Robibero, 2014).
1.2. Measuring Face-to-Face Bullying and Cyberbullying
When it comes to measuring face-to-face bullying, different kinds of question-naires have been used (Nielsen & Einarsen, 2012). One of the most frequently used (at least in a European context) is the Negative Acts Questionnarie-re- vised (NAQ-R) developed by (Einarsen et al., 2009). The NAQ-R consists of 22 items that are divided into three different factors; work-related bullying, per-son-related bullying and physically intimidating bullying.
Since cyberbullying behavior in working life is a relatively new phenomenon, there are a limited number of studies where questionnaires actually have been used. Tokunaga (2010) stresses the fact that while several instruments to access cyberbullying have been developed since 2004, there is nevertheless a lack of knowledge about their psychometric properties. In addition, nearly all studies have been focusing on either middle school or adolescence (Berne et al., 2012). According to Tokunaga (2010), the most pervasive methodological drawback in cyberbullying research is related to the varying conceptualization of cyberbully-ing. The inconsistent use of operational measures between studies is equally as troubling as the absence of a universal cyberbullying definition.
Tokunaga (2010) implies that researchers in the area of cyberbullying among youngsters tend to develop their own instrument without providing a rationale for its necessity or superiority over other scales already proposed. Cyberbullying occurrence is most frequently operationalized in the form of one- or two-item measures based on dichotomous choice (yes/no responses), following a supplied definition of face-to-face bullying, cyberbullying, or both (Tokunaga, 2010). As most of the studies have focused on children and adolescents there is a lack of research about cyberbullying among adults in working life (Berne et al., 2013).
In the few studies focusing on cyberbullying among adults, scales that were originally developed to measure face-face bullying such as NAQ-R has been modified in order to measure the aspects of cyberbullying (Privitera & Campbell, 2009; Sprigg et al., 2012). In an exploratory studyby Sprigg et al. (2012) with the aim of developing a cyberbullying negative act questionnaire NAQ-R-items were rated by three subject-matter experts regarding the extent to which they agreed that each item could be enacted over various electronic media: 1) Text messag-ing, 2) Pictures/photos or video clips, 3) Phone calls, 4) Email, 5) Chat rooms, 6) Instant messaging, 7) Websites. These seven electronic media were included as they were identified by Smith et al. (2008) as the most common media that per-petrators used when engaging in cyberbullying behaviors. In order to find out how cyberbullying behaviours in working life are expressed, a study among
working adults in Sweden was conducted (Forssell, 2014). The study included an online questionnaire that consisted of 12 open-ended questions: background questions (gender, profession, and supervisory position), experience of harass-ment via digital media by colleagues, supervisors, customer/client, and the expe-rience of witnessing cyberbullying behavior. The open-ended questionnaire identified 11 different types of cyberbullying behaviors.
As described above, there is little research concerning online cyberbullying in working life and conscequently there is a lack of available, reliable and valid questionnaires/scales. Thus, we argue that there is a need for at least two differ-ent types of instrumdiffer-ents. One that can be used in studies where the sole focus is on cyberbullying behavior in working life and a modified shorter version that can easily be used in conjunction with other work environment scales.
The aim of this study is two folded: 1) to analyze the reliability and validity of a cyberbullying behaviour questionnaire (CBQ) in working life and 2) to analyze the reliability and validity of a short version of a cyberbullying behaviour ques-tionnaire (CBQ-S) in working life.
2. Method
As we wanted to avoid that the reliability and validity analyses of the CBQ and CBQ-S would not apply only to Swedish worklife context, the data was gathered both in Sweden and the USA.
2.1. Participants and Procedure in Sweden
A total of 3371 individuals completed the CBQ, 49% of the participants were women and the mean age was 50 years (SD = 9.63). A majority (60%) had uni-versity education and were working full-time (82%). Also, a majority (73%) re-ported that they used digital tools (computer, mobile phone, iPad etc.) very often or always at their work.
The data were collected by TNS Sifo, a public opinion poll and market re-search company. TNS Sifo has an online web panel consisting of a nationally representative random sample of 140,000 people aged 16 years or older. The questionnaire was distributed to a random sample of individuals resident in Sca-nia, Southern Sweden aged between 25 and 65.
The data was collected between 17 April and 20 May 2014. Altogether 3 885 individuals responded but since the aim of the study was to assess cyberbullying behaviour at work, individuals who had been unemployed during the last six months (n = 514) were excluded from the study. The total number of partici-pants in the Swedish sample was therefore 3371 giving a response rate of 42%.
2.2. Participants and Procedure in the USA
The English version of the CBQ was distributed through Amazon’s Mechanical Turk from 15 September to 16 October 2014. Selection criteria were that the respondents had to be US citizens and had to have demonstrated a high degree of accuracy in earlier surveys (what is called Masters distinction). Altogether 240
responses were received after four weeks. Two of the respondents were excluded from the sample since they had not been working during the last six months. The mean age was 36 years (SD = 10.13), and 49% of the participants were women. A majority of the respondents (68%) had a university education and 31% had a supervisory position.
2.3. Measures
2.3.1. The Cyberbullying Behaviour Questionnaire (CBQ and CBQ-S)
As described earlier, there are little research in the area of measuring cyberbul-lying (both among children and among adults). In order to develop a question-naire measruing cyber bullying, an existing measurement of face-to-face bully-ing, the NAQ-R (Einarsen, Hoel, & Notelaers, 2009; Strandmark, Nordström, Wilde Larsson, & Rystedt, 2013), a preliminary questionnaire of cyberbullying, the Cyber Negative Acts Questionnaire (Sprigg et al., 2012), and the results of the study by Forssell (2014) functioned as the basis of the CBQ (see Table 1).
Table 1. Items in the CBQ (CBQ-S items in bold).
How often during the last six months has any of the following occurred:
1. Your supervisor/colleagues are not responding to your e-mails or text messagesa,b 2. Your work performance has been commented upon in negative terms on the Internetb,c 3. Rude messages have been sent to you via digital mediac
4. Persistent criticism of your work or performance has been made against you via digital mediaa 5. Necessary information has been withheld making your work more difficult
(e.g. being excluded from e-mail lists)a,b,c
6. Aggressively worded messages (e.g. capital letters, bold style or multiple exclamation marks) have been sent to you via e-mail, text messages or the likeb
7. Threatening personal messages have been sent to you via digital mediaa,b 8. Allegations about you have been made on the Interneta
9. Threatening messages about your friends/your family have been sent to you via digital mediac
10. Others have commented on the Internet that you should quit your worka 11. Attacks against you as a person, your values or your personal life have been made on digital mediac
12. Your computer identity has been hijackedc
13. Gossip or rumors about you have been spread on the Interneta
14. Extracts from your messages have been copied so that the meaning of the original message is distortedb
15. Offensive photos/videos of you have been posted on the Internetc
16. Jokes about you have been spread on the Internet or via e-mail to several recipientsa 17. Viruses have intentionally been sent to your e-mail addressc
18. Your mistakes or errors at work are repeatedly commented about in e-mails, text messages, or the likea,c
19. False statements about you have been spread on the Interneta
20. Colleagues have excluded you from the social community online (e.g. Facebook, Twitter)a
The CBQ consists of 20 items covering a wide range of work-related cyberbully-ing behaviour (see Table 1). The CBQ-S consists of seven items from the CBQ (see Table 1 marked in bold).
This instruction was given to the respondents: “The following behaviours are often seen as examples of negative behaviour in the workplace that may occur via the use of technology. When responding consider every act in relation to these eight types of technologies: Text messaging; pictures/photos or video clips, phone calls; email; chat rooms; instant messaging; websites; and social network-ing websites (e.g. Facebook, Twitter, YouTube).
“Over the last six months, how often have you been subjected to the following negative acts related to your work through different forms of technology?”
The respondents rated the items on a five-point scale, 1 = never, 2 = now and then, 3 = monthly, 4 = weekly, 5 = daily (Einarsen et al., 2009; Sprigg et al., 2012). The items in the questionnaire were in Swedish, but they were translated into English for the US sample, and thereafter back-translated to ensure the cor-rect wording of them.
In order to conduct a criterion validity test, the following measurement were included. These measurement have in research shown a prior relationship with face-to-face bullying (Nielsen and Einarsen, 2012).
Wellbeing was measured by General Health Questionnaire 12 (GHQ-12) originally developed by Goldberg (1972), and a Swedish version developed by Sconfienza (Sconfienza, 1998). A sample item is: “I have been able to face up my problems.” The respondents rated the items on a four-point scale from 1 (=Disagree very much) to 4 (=Agree very much). Cronbach’s alpha was 0.76 in the Swedish sample and 0.95 in the US sample.
Work engagement was assessed by a short form of the Utrecht Work En-gagement Scale (UWES-9) (Schaufeli, Bakker, & Salanova, 2006). An example is: “I am enthusiastic about my job.” The responses were rated on 7-point scale from 1 (=never) to 7 (=always). Cronbach’s alpha was .95 in Sweden and 0.96 in the US.
Intention to quit was measured by one item: “How often do you consider looking for work somewhere else?” (Berthelsen, Westerlund, & Söndergård, 2014; Pejtersen, Kristensen, Borg, & Bjorner, 2010). Ratings were made on a 5-point scale from 1 (=very seldom) to 5 (=very often).
2.3.2. Analyses
To investigate the psychometric evaluation of CBQ and CBQ-S, four different kinds of statistics were calculated. Descriptive statistics, mean, SD for the total group and also separately for men and women. Exploratory Structural Equation Modeleling (ESEM) were conducted to test the number of factors and their loadings on items. It was based on estimations using the MPlus software (Muthén & Muthén, 2007). To estimate the reliability of the scales, ordinal alpha was es-timated with R-program (Gardemann, Ghun, & Zumbo, 2012) and last, to ana-lyze criterion validity, correlations between the scale and the theoretically rele-vant concepts (wellbeing, work engagemant, and intention to quit) were
con-ducted. The distribution of CBQ and CBQ-S was very skewed, therefore all sta-tistical test using CBQ and CBQ-S were based on the robust estimations (MLR) in the MPlus program (ESEM was estimated with WLSMV that also took care of skewed distributions).
3. Results
3.1. CBQ
3.1.1. Means and Standard Deviations of the CBQ
Table 2 illustrates the means and standard deviations for the individual items, the totals for all participants and for men and women respectively, for both the Swedish and the US sample. As regards the Swedish sample, the robust estima-tion showed a significant difference between men (M = 1.63, SD = 2.89) and women (M = 1.27, SD = 2.55) concerning the total score of perceived online negative acts; (ΔM/S.E = 0.036/0.09 = 4.12, p < 0.001). The result indicates that men were more exposed to cyberbullying behaviour than women in Sweden. However, no significant gender differences were found in the US sample con-cerning the total score of perceived online negative acts: men (M = 4.85, SD = 5.67) and women (M = 3.66, SD = 5.27), ΔM/S.E. = −0.120/0.71 = 1.68, p = 0.092).
3.1.2. Exploratory Structural Equation Modeleling (ESEM)
To test the factor structure of the cyber bullying questionnaire we used ESEM. To remedy the very obvious skewness of items, we defined them as ordered cat-egories and used Weighted Least Square (WLSMV) for the estimation. In addi-tion, because some (see Table 3) of the items lacked ratings on the two highest rating categories, we reduced the number of categories from 5 to 3 by collapsing the three highest rating categories into a single category. The whole rating scale was also moved by 1 point with a new range from 0 to 2. The value 0 corres-ponded better the rating “never”. The analysis started with the one-factor model, since this is the most parsimonous. It was found that this model had excellent fit to the data; χ2(170) = 986.7, p < 0.001, CFI = 0.97 and RMSEA = 0.037.
Standar-dized loadings (see Table 4) were very high for most of the items, the five items with lowest loadings were #1, #5, #12, #17, and #20, but all except #17 had load-ings that were above 0.50. We also tested a model with fewer categories by col-lapsing the five highest categories into a single category (0 and 1); this did not influence the results of the ESEM estimations. Since the fit for the one-factor model was so good we did not test other models with a higher number of factors. The same ESEM model was used to test the homogeneity of the scale from the US sample. In this sample too, the highest three categories were used very rarely (see Table 3), and therefore they were collapsed into one and the rating scale moved by one point for a new range of 0 to 2. It was found that the one-factor ESEM model had a excellent fit to the data, χ2(170) = 446.2, CFI = 0.98 and
RMSEA = 0.083. The loadings were very high for all items (0.61 and above) ex-cept for two items (#1 and #17) that were 0.48 and 0.32 (see Table 5). The latter
Table 2. Means and standard deviations of CBQ for totals, individual items, for men and women separately both for the Swedish and the US sample.
CBQ/CBQ-S
Total Men Women
M SD M SD M SD Sweden CBQ-Total 1.46 2.60 1.63 2.89 1.27 2.25 CBQ-1 0.46 0.69 0.48 0.71 0.44 0.67 CBQ-2 0.07 0.29 0.07 0.30 0.06 0.28 CBQ-3 0.09 0.32 0.10 0.33 0.08 0.30 CBQ-4 0.05 0.26 0.06 0.27 0.05 0.25 CBQ-5 0.16 0.42 0.18 0.44 0.14 0.40 CBQ-6 0.14 0.38 0.15 0.40 0.12 0.36 CBQ-7 0.03 0.19 0.03 0.20 0.03 0.18 CBQ-8 0.03 0.18 0.03 0.20 0.02 0.16 CBQ-9 0.02 0.17 0.02 0.18 0.02 0.16 CBQ-10 0.01 0.14 0.02 0.16 0.01 0.11 CBQ-11 0.04 0.23 0.05 0.24 0.04 0.21 CBQ-12 0.02 0.16 0.03 0.18 0.02 0.14 CBQ-13 0.03 0.18 0.03 0.19 0.02 0.15 CBQ-14 0.03 0.19 0.04 0.21 0.03 0.17 CBQ-15 0.01 0.11 0.01 0.13 0.01 0.09 CBQ-16 0.01 0.11 0.02 0.13 0.00 0.07 CBQ-17 0.15 0.42 0.20 0.48 0.10 0.34 CBQ-18 0.05 0.23 0.05 0.25 0.05 0.21 CBQ-19 0.03 0.18 0.03 0.20 0.02 0.15 CBQ-20 0.03 0.17 0.03 0.17 0.03 0.17 US CBQ-Total 4.22 5.47 4.85 5.67 3.66 5.27 CBQ-1 0.86 0.68 0.83 0.65 0.89 0.71 CBQ-2 0.15 0.44 0.20 0.50 0.11 0.37 CBQ-3 0.26 0.54 0.31 0.60 0.22 0.47 CBQ-4 0.15 0.45 0.16 0.43 0.15 0.48 CBQ-5 0.51 0.66 0.51 0.65 0.49 0.66 CBQ-6 0.47 0.70 0.61 0.76 0.35 0.62 CBQ-7 0.11 0.39 0.15 0.44 0.08 0.32 CBQ-8 0.13 0.43 0.22 0.54 0.04 0.27 CBQ-9 0.06 0.32 0.09 0.40 0.03 0.22 CBQ-11 0.13 0.35 0.17 0.40 0.08 0.28 CBQ-10 0.10 0.37 0.16 0.43 0.05 0.29 CBQ-12 0.07 0.28 0.06 0.24 0.08 0.32 CBQ-13 0.17 0.44 0.25 0.51 0.10 0.36 CBQ-14 0.16 0.44 0.20 0.44 0.12 0.43 CBQ-15 0.04 0.24 0.03 0.18 0.05 0.29 CBQ-16 0.10 0.35 0.11 0.39 0.08 0.31 CBQ-17 0.20 0.51 0.19 0.49 0.22 0.54 CBQ-18 0.14 0.39 0.12 0.33 0.16 0.45 CBQ-19 0.17 0.45 0.20 0.48 0.14 0.42 CBQ-20 0.28 0.54 0.30 0.56 0.25 0.52
Table 3. Frequency (%) of responses in the Swedish and US sample, items in bold re- presents item in the short scale.
CBQ/CBQ-S
Never Now and
then Monthly Weekly Daily Missing Sweden CBQ-1 65.3 23.1 3.7 4.7 3.0 0.2 CBQ-2 92.1 4.5 0.5 0.3 0.2 2.4 CBQ-3 91.7 6.4 0.6 0.3 0.1 0.9 CBQ-4 94.7 3.4 0.4 0.2 0.2 1.0 CBQ-5 85.3 11.8 1.4 0.6 0.1 0.8 CBQ-6 86.7 10.9 1.0 0.3 0.1 1.0 CBQ-7 96.6 2.3 0.2 0.1 0.0 0.8 CBQ-8 96.4 2.3 0.1 0.1 0.0 1.1 CBQ-9 96.9 1.8 0.2 0.0 0.0 1.0 CBQ-10 97.8 1.0 0.2 0.0 0.0 1.0 CBQ-11 95.8 3.5 0.1 0.2 0.1 0.2 CBQ-12 97.1 2.3 0.1 0.0 0.0 0.5 CBQ-13 97.2 2.2 0.1 0.1 0.0 0.4 CBQ-14 96.1 3.1 0.1 0.0 0.0 0.7 CBQ-15 98.5 0.8 0.0 0.0 0.1 0.7 CBQ-16 98.3 0.9 0.1 0.0 0.0 0.7 CBQ-17 86.4 10.5 1.3 0.8 0.2 0.8 CBQ-18 94.6 4.4 0.2 0.0 0.0 0.8 CBQ-19 96.9 2.2 0.1 0.1 0.0 0.7 CBQ-20 96.7 2.5 0.1 0.0 0.0 0.7 US CBQ-1 30.7 51.3 7.1 8.4 1.3 1.3 CBQ-2 85.7 9.2 1.7 0.8 0.4 2.1 CBQ-3 77.3 16.8 1.7 2.9 0.0 1.3 CBQ-4 87.4 7.1 2.1 1.7 0.0 1.7 CBQ-5 58.0 32.8 6.7 1.7 0.4 0.4 CBQ-6 63.9 23.5 7.6 4.2 4.2 0.8 CBQ-7 90.3 5.9 1.3 1.3 0.0 1.3 CBQ-8 90.3 5.0 2.5 1.3 0.0 0.8 CBQ-9 95.0 2.1 0.8 1.3 0.0 0.8 CBQ-10 92.0 5.9 0.8 1.3 0.0 0.0 CBQ-11 87.8 11.8 0.0 0.4 0.0 0.0 CBQ-12 94.1 5.0 0.8 0.0 0.0 0.0 CBQ-13 84.0 12.2 1.3 1.3 0.0 1.3 CBQ-14 87.0 9.7 2.5 0.4 0.0 0.4 CBQ-15 96.2 2.5 0.4 0.4 0.0 0.0 CBQ-16 91.6 6.3 0.4 1.3 0.0 0.0 CBQ-17 84.9 10.1 2.5 1.7 0.8 0.0 CBQ-18 86.6 10.5 0.8 0.8 0.0 1.3 CBQ-19 85.3 10.9 2.1 0.8 0.0 0.8 CBQ-20 76.5 18.5 3.8 0.8 0.0 0.4
487
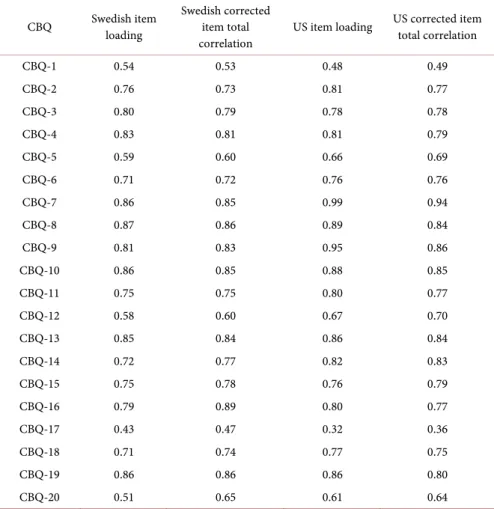
Table 4. Item loadings and corrected item total correlations.
CBQ Swedish item loading Swedish corrected item total
correlation US item loading
US corrected item total correlation CBQ-1 0.54 0.53 0.48 0.49 CBQ-2 0.76 0.73 0.81 0.77 CBQ-3 0.80 0.79 0.78 0.78 CBQ-4 0.83 0.81 0.81 0.79 CBQ-5 0.59 0.60 0.66 0.69 CBQ-6 0.71 0.72 0.76 0.76 CBQ-7 0.86 0.85 0.99 0.94 CBQ-8 0.87 0.86 0.89 0.84 CBQ-9 0.81 0.83 0.95 0.86 CBQ-10 0.86 0.85 0.88 0.85 CBQ-11 0.75 0.75 0.80 0.77 CBQ-12 0.58 0.60 0.67 0.70 CBQ-13 0.85 0.84 0.86 0.84 CBQ-14 0.72 0.77 0.82 0.83 CBQ-15 0.75 0.78 0.76 0.79 CBQ-16 0.79 0.89 0.80 0.77 CBQ-17 0.43 0.47 0.32 0.36 CBQ-18 0.71 0.74 0.77 0.75 CBQ-19 0.86 0.86 0.86 0.80 CBQ-20 0.51 0.65 0.61 0.64
Table 5. Correlations between CBQ, work engagement, wellbeing, and intention to quit.
Measure 1 2 3 4
1. CBQ - −0.10 −0.30** 0.20* 2. Work engagement −0.10** - 0.55** −0.61**
3. Wellbeing −0.21** 0.55** - −0.44** 4. Intention to quit 0.19** 0.49** −0.46** -
Note: *p < 0.01, **p < 0.001. Swedish sample below the diagonal, US sample above the diagonal.
fit indices were above the recommended level for a good fit, but since the CFI was very close to 1, it is suggested that almost all of the covariance between the items could be explained by one single factor1.
3.1.3. Reliability of the CBQ
To calculate the reliability of the scale we used the R-program (Gardemann, Ghun, & Zumbo, 2012) and the psych-package to first calculate a polychoric correlation matrix. Based on this matrix we calculated alpha, which was found to be 0.96, suggesting the scale to be very reliable. The corrected scale item correla-tions (see Table 4) were very similar to the loadings from the ESEM.
1We made a configural invariance testing and found that the two samples did not differ much p > 0.001.
Regarding the US sample of the inventory, the alpha, based on the polychoric correlation matrix, was 0.96, suggesting this version to be as reliable as the orig-inal Swedish questionnaire.
3.1.4. Criterion Validity of the CBQ
To measure the criterion validity correlation coefficients based on robust esti-mations between CBQ and scales measuring work engagement, wellbeing and intentions to quit were estimated (see Table 5). The results showed that cyber-bullying behaviour correlated negatively with work engagement and wellbeing. There was a positive correlation between cyberbullying behaviour and intention to quit. CBQ had a negative correlation with wellbeing and a positive correlation with intention to quit in the US sample. The results were similar for both sam-ples, except that the correlation between CBQ and work engagement was not significant for the US sample.
3.2. CBQ-S
We created the short scale by selecting items based on two criteria, first that the items substantly contributed to the variation of the scale, and second that the items represented the core of cyberbulling.
Table 3 includes the frequency of responses in the Swedish and US sample to each rating category for all items. It is obvious that the most common respons was “never” of the behavior. For some of the items, hardly no one revealed that they had experienced the behavior.
To select in accordance with the first criteria, items were selected if they con-tributed substantially in a regression analysis, having the total scale as dependent and all the items as independents. Among those items having a high regression weights we seleted a subset that represented the largest range of behaviors. The short set consists of seven items (see bold in Table 1). They represented 95.1% of the variance of a scale consisting of all 20 items included in the first version.
3.2.1. Means and Standard Deviations of the CBQ-S
See Table 6 for means and standard deviations. As regards the Swedish sample, there was a small but significant difference between men (M = 1.19, SD = 1.92) and women (M = 1.03, SD = 1.71) concerning the total score of perceived online negative acts, (ΔM/S.E. = −0.16/0.05 = 3.08, p = 0.002). The result indicates that men were somewhat more exposed to cyberbullying behaviour than women in Sweden. However, no gender differences were found in the US sample concern-ing the total score of perceived cyberbullyconcern-ing behaviour: men (M = 2.74, SD = 3.56) and women, ΔM/S.E. = −0.52/0.33 = 3.08, p = 0.107, but note that the trend is the same and that the US sample is much smaller.
3.2.2. Exploratory Structural Equation Modeleling (ESEM) of the CBQ-S
When conducting the ESEM for the CBQ-S, the same preliminary adjustements as with the CBQ were made. The three highest rating categories were collapse into one and the whole rating scale was moved by one point for a new range 0 to
Table 6. Means and standard deviations of CBQ-S for totals, individual items, for men and women separately both for the Swedish and the US sample.
CBQ-S M SD M SD M SD Sweden CBQ-total 0.96 1.51 1.03 1.60 0.88 1.42 CBQ-1 0.46 0.69 0.48 0.71 0.44 0.67 CBQ-2 0.07 0.29 0.07 0.30 0.06 0.28 CBQ-3 0.09 0.32 0.10 0.33 0.08 0.30 CBQ-5 0.16 0.42 0.18 0.44 0.14 0.40 CBQ-6 0.14 0.38 0.15 0.40 0.12 0.36 CBQ-9 0.02 0.17 0.02 0.18 0.02 0.16 CBQ-19 0.03 0.18 0.03 0.20 0.02 0.15 US CBQ-total 2.47 2.25 2.74 2.74 2.22 2.26 CBQ-1 0.86 0.68 0.83 0.65 0.89 0.71 CBQ-2 0.15 0.44 0.20 0.50 0.11 0.37 CBQ-3 0.26 0.54 0.31 0.60 0.22 0.47 CBQ-5 0.51 0.66 0.51 0.65 0.49 0.66 CBQ-6 0.47 0.70 0.61 0.76 0.35 0.62 CBQ-9 0.06 0.32 0.09 0.40 0.03 0.22 CBQ-19 0.17 0.45 0.20 0.48 0.14 0.42
2. Here, it was found that a one-factor CFA model had excellent fit to the data; χ2(14) = 124.9, CFI = 0.96 and RMSEA = 0.048. Standardized loadings (see
Ta-ble 7) were high. All items had a very high loading above 0.73 except for two items (#1 and #5) that had a loading of 0.55 and 0.56. Even if the fit was excellent we consulted the modification indices and found that one correlation between the error of item 1 and item 5 was high, χ2(1) = 90.8. We added this correlation
to the model and found that the correlation was moderate in size (stdxy = 0.338) and that the new model was significantly better, Santora Bentler corrected dif-ference in χ2(1) was 53.5, p < 0.001. Since we now had almost perfect fit we did
not test models with more factors. The content of the items were similar as both mentioned e-mail, a possible casue of this correlation.
The same ESEM was used to test the homogeneity of the scale from the US sample. In this sample too, the highest three categories were used very rarely, and therefore they were collapsed into one and the rating scale moved by one point for a new range of 0 to 2. It was found that the one-factor ESEM model had a excellent fit to the data, χ2(14) = 32.3, CFI = 0.97 and RMSEA = 0.074
(probability = 0.108 that RMSEA ≤ 0.05). The standardized loadings were high for all items (0.71 and above), the lowest was 0.50 for item 1. Also in the US sample the correlation between item 1 and item 5 was significant, when added to the model the corrected difference in χ2(1) was 9.77, p = 0.002, CFI = 0.99, and
RMSEA = 0.054. Given this very close fit we did not test for more factors.
3.2.3. Reliability of the CBQ-S
Table 7. CBQ-S Item loadings and corrected item total correlations.
CBQ-S item loading Swedish Swedish corrected item total correlation
English item loading
English corrected item total
correlation CBQ-1 0.56 0.59 0.50 0.53 CBQ-2 0.75 0.68 0.71 0.73 CBQ-3 0.85 0.83 0.82 0.79 CBQ-5 0.55 0.61 0.59 0.65 CBQ-6 0.78 0.75 0.83 0.78 CBQ-9 0.74 0.74 0.96 0.85 CBQ-19 0.75 0.75 0.73 0.86
Ghun, & Zumbo, 2012) and the psych-package to first calculate a polychoric correlation matrix. Based on this matrix we calculated alpha, which was found to be .88, suggesting the scale to be very reliable. The corrected scale item correla-tions (see Table 7) were very similar to the loadings from the CFA.
Regarding the US sample of the inventory, the alpha, based on the polychoric correlation matrix, was 0.88, suggesting this version to be as reliable as the orig-inal Swedish questionnaire.
3.2.4. Criterion Validity of the CBQ-S
To measure the criterion validity correlation coefficients based on a robust mod-el between CBQ-S and wmod-ellbeing, work engagement, and intentions to quit were estimated.
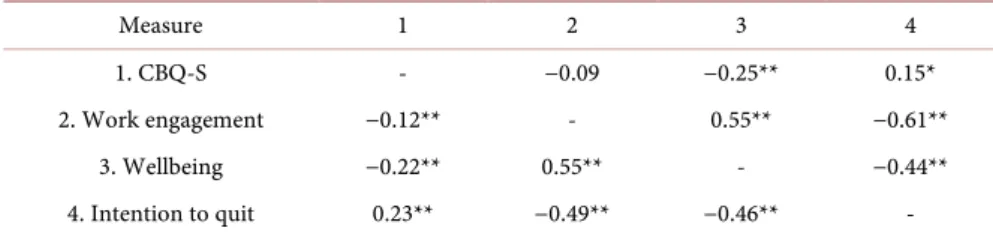
The results showed that in the Swedish sample (see Table 8) cyberbullying behaviour correlated negatively with work engagement and wellbeing, in addi-tion there was a positive correlaaddi-tion between cyberbullying behaviour and inten-tion to quit. The results were similar for both versions of the quesinten-tionnaire but only the correlation between CBQ-S and work wellbeing and intention to quit was significant for the US sample.
4. Discussion
Communication in today’s workplaces takes place to a greater extent electroni-cally, which has given rise to a new phenomenon, cyberbullying behavior in working life. Even though cyberbullying among children and adolescents has been studied and measured in several studies, there is lack of research assessing this behavior among adults in work life. The aim of this study was to analyze the reliability and validity of the scales CBQ and CBQ-S that assess cyberbullying behaviour in working life. Since there is no existing reliable scale measuring work-related cyberbullying behavior, as far as we know, the results of the study can be regarded as promising. The analyses of the scales were successful in that a one-factor model had excellent fit to the data and that Cronbach’s alpha showed that both scales were reliable in both the Swedish and US sample. In addition, criterion validity was found as both CBQ and CBQ-S correlated significantly
Table 8. Correlations between CBQ-S, work engagement, wellbeing, and intention to quit. Measure 1 2 3 4 1. CBQ-S - −0.09 −0.25** 0.15* 2. Work engagement −0.12** - 0.55** −0.61** 3. Wellbeing −0.22** 0.55** - −0.44** 4. Intention to quit 0.23** −0.49** −0.46** -
with theoretically relevant concepts; wellbeing, work engagement and intention to quit in the Swedish sample. Same criterion validity was found for the US ex-cept for the relationship with work engagement.
It seems therefore that the impact of cyberbullying is similar to that of face- to-face bullying (West et al., 2014).
The two scales can be used in somewhat different ways. If the aim is capture the broad aspect of cyberbullying behavior then the CBQ scale is recommended. The CBQ scales consist of 20 items that cover a wider range of different types of cyberbullying behaviors. If individual subjects are investigated, these 20 items could be used as a check-list of different kind of cyberbullying behavior. The short version consists of as few as seven items, but likewise, this scale encom-passed most of the variability. The CBQ-S would be most useful when combined with other scales measuring work environment. The CBQ-S with its seven items is more easily implemented with other battery of questionnaires do to its less time consuming nature. It is important to note though that this version does not include all types of cyberbullying behavior, in this respect the CBQ with its 20 items is more comprehensive.
There are some strengths and limitations of the study that need to be ad-dressed. One strength of this study is that one of the samples was a random sample of individuals resident in Scania, Southern Sweden. This is relevant since the scale has been related to organizational aspects such as work engagement and intention to quit. If the sample had been drawn from only one or a couple of organizations, the results of the study would have been more difficult to gene-ralize to different organizational settings. A limitation of the study is that the US sample was somewhat limited in size and did not include the same questions about the demographic variables as the Swedish questionnaire and cannot be regarded as representative, but the American scale resulted in a similar factor structure. On the other hand, it is not possible to draw any conclusions on dif-ferences between Sweden and USA in number of cyberbullying behaviors expe-rienced, the two samples are too different for such comparisons. The results in-dicate that men were somewhat more exposed to cyberbullying behavior than women in the Swedish sample, whereas no gender difference was found in the US sample. In order to understand these results, further studies focusing on qua-litative aspects of online harassment need to be conducted. Another limitation is that fact that we only had a limited number of scales that could be used for the validation of CBQ and CBQ-S. In this study, we chose to work with concepts that have been used for validity tests in studies of face-to-face workplace
bully-ing. In future studies, other concepts and scales can be added in relation to the validity tests.
Acknowledgements
This research was supported by a grant from Swedish Research Council for Health, Working Life and Welfare (Forte). DNR: 2012-0230.
Competing Interest
The authors declare that they have no competing interests in publishing this ar-ticle.
Ethics and Consent
The study was approved by the Regional Ethical Review Board, Lund, Southern Sweden (2012/619).
References
Agervold, M. (2007). Bullying at Work: A Discussion of Definitions and Prevalence, Based on an Empirical Study. Scandinavian Journal of Psychology, 48, 161-172. https://doi.org/10.1111/j.1467-9450.2007.00585.x
Bartlett, J. E., & Bartlett, M. E. (2011). Workplace Bullying: An Integrative Literature Re-view. Advances in Developing Human Resources, 13, 69-84.
https://doi.org/10.1177/1523422311410651
Baruch, Y. (2005). Bullying on the Net: Adverse Behavior on Email and Its Impact.
Information & Management, 42, 361-371. https://doi.org/10.1016/j.im.2004.02.001 Beran, T., & Li, Q. (2005). Cyber-Harassment: A Study of a New Method for an Old
Be-havior. Journal of Educational Computing Research, 32, 265-277. https://doi.org/10.2190/8YQM-B04H-PG4D-BLLH
Berne, S., Frisén, A., Schultze-Krumbholz, A., Scheithauer, H., Naruskov, K., Luik, P., et al. (2013). Cyberbullying Assessment Instruments: A Systematic Review. Aggression and Violent Behavior, 18, 320-334. https://doi.org/10.1016/j.avb.2012.11.022
Berthelsen, H., Westerlund H., & Söndergård, T. (2014). Copenhagen Psychosocial Ques-tionnaire II (COPSOQ II)—En preliminär validering av den svenska versionen Stress-forskningsinstitutets rapportserie, Stockholms universitet. (Submitted)
Bilgel, N., Aytac, S., & Bayram, N. (2006). Bullying in Turkish White-Collar Workers.
Occupational Medicine, 56, 226-231. https://doi.org/10.1093/occmed/kqj041
Brack, K., & Caltabiano, N. (2014). Cyberbullying and Self-Esteem in Australian Adults.
Cyberpsychology, 8. https://doi.org/10.5817/CP2014-2-7
Einarsen, S., & Skogstad, A. (1996). Bullying at Work: Epidemiological Findings in Public and Private Organizations. European Journal ofWork and OrganizationalPsychology, 5, 185-201. https://doi.org/10.1080/13594329608414854
Einarsen, S., Hoel, H., & Notelaers, G. (2009). Measuring Exposure to Bullying and Ha-rassment at Work: Validity, Factor Structure and Psychometric Properties of the Nega-tive Acts Questionnaire-Revised. Work & Stress, 23, 24-44.
https://doi.org/10.1080/02678370902815673
Einarsen, S., Hoel, H., Zapf, D., & Cooper, C. L. (2011). The Concept of Bullying and Ha-rassment at Work: The European Tradition. In S. Einarsen, H. Hoel, D. Zapf, & C. L. Cooper (Eds.), Bullying and Harassment in the Workplace: Developments in Theory,
Research, and Practice (2nd Ed., pp. 3-39).
Erdur-Baker, Ö. (2010). Cyberbullying and Its Correlation to Traditional Bullying, Gender and Frequent and Risky Usage of Internet-Mediated Communication Tools.
New Media & Society, 12, 109-125. https://doi.org/10.1177/1461444809341260 Findahl, O. (2014). Swedes and the Internet. http://en.soi2014.se
Forssell, R. (2014). Cyberbullying in Work Life.
Forssell, R. (2016). Exploring Cyberbullying and Face-to-Face Bullying in Working Life- Prevalence, Targets and Expressions. Computers in Human Behavior, 58, 454-460. https://doi.org/10.1016/j.chb.2016.01.003
Gardemann, A. M., Ghun, M., & Zumbo, B. D. (2012). Estimating Ordinal Reliability for Likert-Type and Ordinal Item Response Data: A Conceptual, Empirical, and Practical Guide. Practical Assessment, Research & Evaluation, 17, 1-13.
Goldberg, D. (1972). The Detection of Psychiatric Illness by Questionnaire: A Technique for the Identification and Assessment of Non-Psychotic Psychiatric Illness. London: Oxford University Press.
Göransson, S., Näswall, K., & Sverke, M. (2011). Kunskapsöversikt: Psykologiska pers-pektiv på hot och våld i arbetslivet. Stockholm: Arbetsmiljöverket.
Kowalski, R. M., Giumetti, G. W., Schroder, A. N., & Lattaner, M. R. (2014). Bullying in the Digital Age: A Critical Review and Meta-Analysis of Cyberbullying Research among Youth. Psychological Bulletin, 140, 1073-1137.
https://doi.org/10.1037/a0035618
Leymann, H. (1996). The Content and Development of Mobbing at Work. European
Journal of Work and Organizational Psychology, 10, 165-184. https://doi.org/10.1080/13594329608414853
Lim, V. K. G., & Teo, T. S. H. (2009). Mind Your E-Manners: Impact of Cyber Incivility on Employees’ Work Attitude and Behavior. Information & Management, 46, 419-425. https://doi.org/10.1016/j.im.2009.06.006
Mikkelsen, E. G., & Einarsen, S. (2001). Bullying in Danish Work-Life: Prevalence and Health Correlates. European Journal of Work and Organizational Psychology, 10, 393- 413. https://doi.org/10.1080/13594320143000816
Muthén, L. K., & Muthén, B. O. (2007). Mplus User’s Guide (6th ed.). Los Angeles, CA: Muthén & Muthén.
Nielsen, M. B., & Einarsen, S. (2012). Outcomes of Exposure to Workplace Bullying: A Meta-Analytic Review. Work & Stress, 26, 309-332.
https://doi.org/10.1080/02678373.2012.734709
Nielsen, M. B., A. Skogstad, A., Matthiesen, S. B., Glasø, L., Aasland, M. S., & Notelaers, G. (2009). Prevalence of Workplace Bullying in Norway: Comparisons across Time and Estimation Methods. European Journal of Work and Organizational Psychology, 18,
81-101. https://doi.org/10.1080/13594320801969707
Notelaers, G., Vermunt, J. K., Baillien, E., Einarsen, S., & Witte, H. D. (2011). Exploring Risk Groups and Risk Factors for Workplace Bullying. Industrial Health, 49, 73-88. https://doi.org/10.2486/indhealth.MS1155
Olweus, D. (2013). School Bullying: Development and Some Important Challenges. An-nual Review of Clinical Psychology, 9, 751-780.
https://doi.org/10.1146/annurev-clinpsy-050212-185516
Pejtersen, J. H., Kristensen, T. S., Borg, V., & Bjorner, J. B. (2010). The Second Version of the Copenhagen Psychosocial Questionnaire. Scandinavian Journal of Public Health, 38, 8-24. https://doi.org/10.1177/1403494809349858
Privitera, C., & Campbell, M. A. (2009). Cyberbullying: The New Face of Workplace Bul-lying? Cyber Psychology & Behavior, 12, 395-400.
https://doi.org/10.1089/cpb.2009.0025
Runions, K., Shapka, J. D., Dooley, J., & Modecki, K. (2013). Cyber-Aggression and Vic-timization and Social Information Processing: Integrating the Medium and the Mes-sage. Psychology of Violence, 3, 9-26. https://doi.org/10.1037/a0030511
Salin, D., & Hoel, H. (2013). Workplace Bullying as a Gendered Phenomenon. Journal of Managerial Psychology, 3, 235-251. https://doi.org/10.1108/02683941311321187 Schaufeli, W. B., Bakker, A. B., & Salanova, M. (2006). The Measurement of Work
En-gagement with a Short Questionnaire a Cross-National Study. Educational and Psy-chological Measurement, 66, 701-716. https://doi.org/10.1177/0013164405282471 Sconfienza, C. (1998). Mätning av psykiskt välbefinnande bland ungdomar i Sverige
Användningen av GHQ-12. Arbete och Hälsa 22.
Slonje, R., & Smith, P. K. (2008). Cyberbullying: Another Main Type of Bullying? Scan-dinavian Journal of Psychology, 49, 147-154.
https://doi.org/10.1111/j.1467-9450.2007.00611.x
Smith, P. K., Mahdavi, J., Carvalho, M., Fisher, S., Russell, S., & Tippett, N. (2008). Cy-berbullying: Its Nature and Impact in Secondary School Pupils. Journal of Child Psy-chology and Psychiatry, 49, 376-385. https://doi.org/10.1111/j.1469-7610.2007.01846.x Sprigg, C., Axtell, C., Coyne, I., & Farley, S. (2012). Punched from the Screen:
Cyberbul-lying in the Workplace.
Strandmark, M., Nordström, G., Wilde Larsson, B., & Rystedt, I. (2013). Negativt be-teeende på arbetsplatsen. Svensk översättning av NAQ (Negative Acts Questionnaire), Karlstad: Karlstads Universitet.
Tokunaga, R. S. (2010). Following You Home from School: A Critical Review and Syn-thesis of Research on Cyberbullying Victimization. Computers in Human Behavior, 26,
277-287.https://doi.org/10.1016/j.chb.2009.11.014
Wang, J., Nansel, T. T., & Iannotti, R. J. (2011). Cyber and Traditional Bullying: Differen-tial Association with Depression. Journal of Adolescent Health, 48, 415-417.
https://doi.org/10.1016/j.jadohealth.2010.07.012
West, B., Foster, M., Levin, A., Edmison, J., & Robibero, D. (2014). Cyberbullying at Work: In Search of Effective Guidance. Laws, 3, 598-617.
https://doi.org/10.3390/laws3030598
Wolak, J., Mitchell, K. J., & Finkelhor, D. (2007). Does Online Harassment Constitute Bullying? An Exploration of Online Harassment by Known Peers and Online-Only Contacts. Journal of Adolescent Health, 41, 51-58.
https://doi.org/10.1016/j.jadohealth.2007.08.019
Zapf, D., & Einarsen, S. (2001). Bullying in the Workplace: Recent Trends in Research and Practice—An Introduction. European Journal of Work and Organizational Psychology, 10, 369-373.https://doi.org/10.1080/13594320143000807
Zapf, D., Escartín, J., Einarsen, S., Hoel, H., & Vartia, M. (2011). Empirical Findings on Prevalence and Risk Groups of Bullying in the Workplace. In S. Einarsen et al. (Eds.),
Bullying and Harassment in the Workplace: Developments in Theory, Research and Practice (pp. 75-105). New York: Taylor & Francis Group.