Nr 191 - 1993
Laboratory fatigue properties compared with field erformance
Lennart Djärf and Safwat F. Said
Prepared for presentation at the Sth Eurobitume Conference, Stockholm 1993
VTI särtryck
Nr 191 - 1993
Laboratory fatigue properties compared with field performance
Lennart Djärf and Safwat F. Said
Prepared for presentation at the Sth Eurobitume Conference, Stockholm 1993 div Väg-och Trafik-WInstitutet ISSN 1102-626X
Acknowledgement
The auther's wishes to thank the Department of Highway Engineering at the Swedish Road Administration for their financing of this project.
LABORATORY FATIGUE PROPERTIES COMPARED WITH FIELD PERFORMANCE
DJÄRF, LENNART SAID, SAFWAT F.
Swedish Road and Traffic Research Institute Sweden
ABSTRACT
One of the important parameters in analytic pavement design is fatigue character of bitumen bound layers. In this study an at-tempt has been made to correlate the fatigue properties found in the laboratory to field based fatigue criteria.
In order to develop a fatigue criterion, which is applicable to Swedish conditions, three to six kilometres long sections have been chosen from twelve new constructed roads. These sections have been controlled through deflection measurements by FWD, vehicle classification counts and manual distress surveys. Twenty cores per section have been drilled from ten sections for fatigue testing at the laboratory. These cores (from road-base mixtures) have been studied at two different temperatures using Indirect Tensile Method.
The fatigue properties are expressed as the relationship be-tween strain and number of repeated loading. The primary re-sults of this study show a good correlation between laboratory fatigue curves and field based fatigue criteria through slopes of curves.
LES CARACTERISTIQUE DE FATIGUE DECOUVERTES EN LABORATOIRE COM-PARE AUX OBSERVATIONS EN PLACE
DJÄRF, LENNART SAID, SAFWAT F.
Institut Suédois de recherches routiéres et de la circulation Suéde
RESUME
Un des paramétres importants en dimensionnement analytique de chaussées est celui des caractéristique de fatigue des couches å liaison bitumineuse. Dans la présente étude, on a essayé de faire correspondre les caractéristiques de fatigue découvertes en laboratoire aux critéres de fatigue observés en place.
Afin de développer un critére de fatigue qui soit applicable aux conditions suédoises, des sections de route de trois å six kilométres de long ont été choisies parmi de 12 route récemment construites. Ces sections ont été contrölées par des mesures de déflexion, des recensements de classification de véhicules et des contröles visuels. 20 carottes ont été percés par section å partir de 10 sections pour des tests de fatigues en labora-toire. Ces carottes (de målanges de couche de base) ont été etudiés å deux temperatures différentes å 1'aide de deux méåthodes différentes de traction indirecte.
Les caractéristiques de fatigue sont exprimées comme la re-lation entre la contrainte et le nombre de chargements répétés. Les premiers résultats de cette étude indiquent une bonne
corrélation entre les courbes de fatigue trouvées en labora-toire et les pentes de courbes du critére de fatigue observé en place.
Djärf, Lennart Laboratory Fatigue Properties Com-Said, Safwat F. pared with Field Performance
LABORATORY FATIGUE PROPERTIES COMPARED WITH FIELD PERFORMANCE
DJÄRF, LENNART SAID, SAFWAT F.
Swedish Road and Traffic Research Institute Sweden
1. INTRODUCTION
Asphalt strain criteria existing today are mostly developed for asphalt mixes with considerably larger binder volumes and higher binder stiffnesses than those used in typical bitumen base
courses in Sweden. Normally a bituminous base course in Sweden contains a binder of Bl80 type, a binder content of 3.7 to 4.2% by weight and a void ratio in average of 8%.
In view of this, a need has been perceived for development of an asphalt strain criterion applicable to Swedish hot mix base courses and Swedish climatic conditions.
2 . METHODOLOGY
To solve the task described above, road sections with lengths between 3 and 7 kilometres and varying conditions (subgrade soils, "cuts" and "fills", climate etc.) on twelve newly con-structed roads have been selected for observation. The sections are located in areas with freezing index varying between 2400 and 19000*C x h (75000 to 600000*F x h). This means that climate zones with both freeze-thaw cycles and stable winter climate are included in the material.
Djärf, Lennart Laboratory Fatigue Properties Com-Said, Safwat F. pared with Field Performance
take place in a regular manner:
deflection measurements by FWD (first and second year) manual distress identification
- uneveness and rut depth measurement s traffic counts (vehicle classification)
Since the aim is to develop a fatigue criterion (cracking), measurements of uneveness and rut depth are considered as supp-lementary information.
The vehicle classification traffic counts provide information on the number of heavy vehicles and their axle configuration.
Transformation of the heavy traffic to equivalent standard loads is done by using axle load measurements performed on roads with similar traffic characteristics. In quantifying the traffic load, correction is applied to the relative damage of front axles, wide base tyres (estimated frequency) and tandem axles
("the tandem effect"). Tridem axles are relatively unusual in Sweden and are therefore treated as three single axles. When applying correction, it is assumed that a front axle of 70 kN, an axle of 80 kN with wide base tyres and a tandem axle of 180 kN are each equivalent to a 100 kN loaded singel axle equipped with dual tyres.
On each road section, twenty cores have been extracted in order to determine the actual layer thicknesses and to perform labo-ratory tests for quantifying stiffness and fatigue
charac-teristics at different temperatures and strain levels. The cores will also be used to determine actual binder and void contents.
Djärf, Lennart Laboratory Fatigue Properties Com-Said, Safwat F. pared with Field Performance
3 . ILLUSTRATION OF THE FIELD PART
Deflection, (using a KUAB Falling Weight Deflectometer), is measured at the centre of loading and at distances of 300, 600 and 900 mm from this point. To calculate the tensile strain in-duced in the bitumen base course, use was made of a regression formula developed by Jansson 1985 (1) relating strain to
deflection basin, including the thickness of the asphalt layer. The relationship used in this study has the following mathe-mat ical form:
f (dj, d5, d;, th,) where
horisontal tensile strain in the bitumen base n
Ehn
dj, d,, d; = deflection at centre of loading and at distances of 300 and 600 mm from this point
th; total thickness of bituminous layers
Deflection measurements have been performed in both spring, summer and autumn (in general, all deflection measurements used within the scope of this project were made before any distress occurred). It has thus been found that the level of strain as a rule is relatively independent of season. This facilitates eva-luation since it is not necessary to make a more or less fine subdivision of the season. However, it should be pointed out that the variation in asphalt layer thicknesses is relatively narrow - between 75 and 130 mm - i.e. the selection contains not very thin nor very thick (by international comparison) asphalt layers. Neither are the latter interesting from the aspect of fatigue in Swedish conditions, since for obvious reasons they are to be found on roads with very high traffic volumes. On this part of the road system, rutting caused by studded tyres is the decisive reason for maintenance measures.
Djärf, Lennart Laboratory Fatigue Properties Com-Said, Safwat F. pared with Field Performance
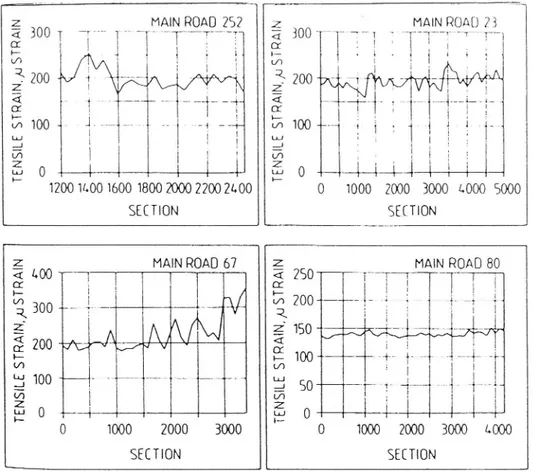
Figure 1 shows examples of the variation in calculated tensile strain on four main roads. In all cases, the total thickness of bituminous layers is about 80 mm. At the top left, there is a 1250 m section from a road with relatively low traffic volume.
Z 4904 --;, __NON ROAD
252? Z
--;
- _NRORO23
&
1
l
T
1
"T* T_ C
5,3
7
f
ose
[/W
ble
~
720
Mq NjaaANA] 2 200
-&
fo to
t ~+
&
ir 100 +- + Je ofc cope
R 100
-us
i
i
å
a
%") | j : Va 22 0 l 1 | å ( 1200 1400 1600 1800 2000 2200 2400 0 1000 2000 3000 4000 5000 C SECTION o SECTION Z MAIN ROAD 67 z& 1.00 ; 2 299 - MALIN ROATD 80_
+- i kt 1 1 i > i h/ 200 def- --2 - boc | < A~-|-~ /\/Au/ E m sT- vs -- 1 e 200 X V Y & f i i H - 100 o v 199 v m l åå 2 50 j_ t © 0 © 0 j | 0 1000 2000 3000 0 1000 2000 3000 4000 SECTION SECTION k
Fiqure 1 Illustration of tensile strain variations in the
bitumen base course on four main roads.
In the area with the highest tensile strain (around section 1400), structural distress occurred after four years. Thus, the estimated number of equivalent loads (100 kN) was only about 100000. The figure at the top right represents a 5 km section of a road that shows some damage after four years. Here, the ten-sile strain is on a comparatively constant level, although no-ticeably uneven. In the bottom left diagram, the very large
Djärf, Lennart Laboratory Fatigue Properties Com-Said, Safwat F. pared with Field Performance
variations in strain are due to construction problems on the second half of the stretch (very soft subgrade) . Otherwise, damage (cracks and deformation) in this case occurred around section 3000 after two years and in a larger extent after three years.
Finally, the diagram at the bottom right is taken from
the,
northernmost road in the selection, i.e. from a climatic zone
with stable winter climate. Here, the level of strain is low and
very even. This is explained by the fact that the subgrade along
almost the whole section consists of a coarser material. So far
load induced damage has occurred only to a very minor extent. On
the other hand, low temperature cracks are relatively frequent.
These in themselves form weak zones in which load-induced
dete-rioration will probably be initiated.
4 .
LABORATORY TESTING
As mentioned before approximately twenty cores per section from
ten test sections have been taken for laboratory studies.
Tests included are determination of air void content, binder
content and type, aggregate grading, layer thicknesses,
stiff-ness modulus and fatigue properties. The primary results of
laboratory tests are presented here.
Tested specimens are from roadbase layer. Recipe of the mixture
meet the specifications and guidelines for road construction
(2) . The bitumen type is B180 and the bitumen content is 4.2
percent by weight. The aggregate size limits of the grading
curve (AG25) are presented in reference 2. The maximum aggregate
size is 25 mm. The air void content should be about 5-10%. The
thickness of tested specimens sawed from field cores varied from
Djärf, Lennart Laboratory Fatigue Properties Com-Said, Safwat F. pared with Field Performance
30 mm up to 67 mm. The range of void content of the specimens were between 3 and 12 percent. The fatigue character of asphalt concrete is influenced by void content. The thickness of the specimens has probably too an effect on fatigue results.
4 . 1 Test method
The Indirect Tensile Test (ITT) has been used in this investi-gat ion for measuring the fatigue properties of roadbase
material. The validity of ITT and description of test method are discussed elsewhere (3). One improvement has been made in this work. The horizontal deformation of the test specimen is sensed by two extensometers instead of one extensometer. The schematic presentation of this fixture is shown in Figure 2. This was im-portant due to relatively high nonhomogenity of cores from bitumen base course.
r
WW
$1
1
Djärf, Lennart Laboratory Fatigue Properties Com-Said, Safwat F. pared with Field Performance
4 . 2 Material testing system
The VTI's universal testing machine from MTS Corporation is a servo-hydaulic system with a closed-10oop control. This system can handle up to six specimens at the same time (Figure 3) . Control of the system and acquisition of data make use of ATS software. Horisontal displacement is sensed by two MTS model No. 632.11lC extensometers with full scale travels of + 3.75 mm.
4 . 3 Test program and fatigue character
Fatigue tests were performed on cored specimens with 100 mm dia-meter. Constant-stress mode has been conducted at two
tem-peratures, +4*C and +15*C. The temperature is maintained within +1*C. Almost nine specimens from each test section were planned
Djärf, Lennart Laboratory Fatigue Properties Com-Said, Safwat F. pared with Field Performance
to be tested at each temperature. The fatigue characteristic is represented by the correlation between initial strain and number of load repetitions.
The fatigue life of each specimen determined from the laboratory test depend on the definition of initial strain and the defi-nition of failure. In earlier investigations the initial strain has been found either from total deformation (4) or from resi-lient deformation (5) .
The total deformation is the maximum deformation under the
loading period, which is composed of the resilient and permanent deformation. However, the resilient deformation is measured at the end of the loading cycle. Figure 4 illustrates both deforma-tions. The two methods of finding out strain give rise to con-tradictory conclusions when expressing the results by strain-number of repeated loads relationships with regard to tempe-rature (5, 6). Figure 5 shows the influence of the total strain and the resilient strain on arrangement of fatigue curves with respect to temperature. A. TD = Total def. RD = Resilient def . PD = Permanent def . C C © E-$2[ob] 0 RD TD PD + ij Time
Djärf, Lennart Laboratory Fatigue Properties Com-Said, Safwat F. pared with Field Performance
Ln it ia l to ta l st ra in (m ic ro s tr ain) 1000 10000 100000 Nurnher of loads 1000000 In it ia l re si li en t st ra in (m ic ro st ra in ) 1000 10000 100000 1 000000 Number of loads
Fiqure 5 Effect of total and resilient strain on fatigue life prediction with respect to temperature.
Fatigue life of specimen predicted in the laboratory has been defined in terms of service life or fracture life. Service life is either the total number of load repetitions applied when the strain versus the number of load applications curve deviates from linearity (7) (it indicates the initiation of hair cracks in the specimen, see Figure 6 curve A) or the total number of load applications required to decrease the initial modulus, nor-mally by 50 percent (7, 8, 9). See Figure 6 curve B. Fracture
life is the total number of load applications that causes a complete fracture of the specimen (curve C). In this work the
Djärf, Lennart Laboratory Fatigue Properties Com-Said, Safwat F. pared with Field Performance
different fatigue life definitions have been evaluated with respect to temperature (Figure 6) .
It is very difficult to detect hair cracks therefore "definition A" is unpractical. The difference between fracture life and service life (50 percent reduction of modulus) is minor with regard to temperature. In this study fracture life is used for predicting fatigue life of the specimens.
c 1000 - 1» C 5 Z 3 -& å 100 + 7 5 D 2 10 + + ; -100 1000 10000 100000 1000000 Number of loads 1000 - +4 C å - A 2 -Z 7 b l 8 £ '3 pe] 10 + + + 4 100 1000 10000 100000 1000000 Number of loads
Figure 6 Fatigue life prediction by A) Crack initiation, B) 50%
reduction of stiffness and C) Fracture of specimen at
+4°C and +15°C.
Djärf, Lennart Laboratory Fatigue Properties Com-Said, Safwat F. pared with Field Performance
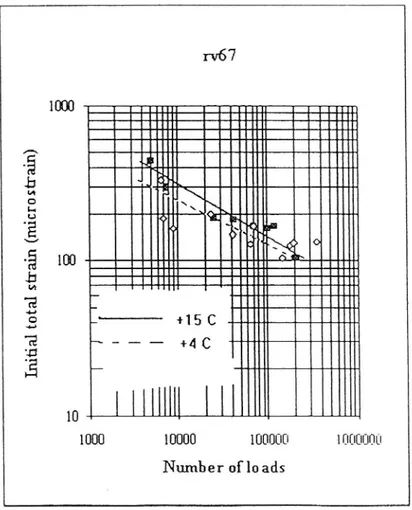
In Figure 7 relationship between total strain and number of load applications at different temperatures for cores from main road
67 (rv 67) is shown. The variation in results within the test section was expected due to high variation of void contents and core thicknesses. On the other hand the results represent the real field conditions. Nevertheless the statistical analysis has shown the significant effect of temperature at 5 percent level for all tested sections until now.
In it ia l to ta l st ra in (m ic ro st ra in ) 1000 10000 100000 10000ONG Number of lo ads
Figure 7 Tensile strain vs. no. of load applications, main road 67 (rv 67) .
Djärf, Lennart Laboratory Fatigue Properties Com-Said, Safwat F. pared with Field Performance
Figure 8 shows the fatigue relations at different temperatures for cores tested up to date from various test sections.
The coefficients of determination at +4*C and +15*C are 0.75 and 0.79 respectively. This partially indicates the variation
between test sections also. However, there are still about 100 cores to be tested. 1000 100 I n i t i a l t o t a l s t r a i n ( m i c r o s t r a i n ) 10 2 1000 10000 --- 100000 1000000 Number of loads
Figure 8 Tensile strain vs. no. of load applications. Cores from bitumen base course layers (AG25) .
5. COMPARISON WITH FIELD PERFORMANCE
In Figure 9 results from the field have been plotted. The strains are calculated from deflection bowls measured in the
Djärf, Lennart Laboratory Fatigue Properties Com-Said, Safwat F. pared with Field Performance
autumn and are representative for a temperature of about +10%C in the bitumen base course layer.
Tensile strain *10-6 FO +3 00 ' l £0 +3 00 ' 1 aj n| in ; o; s u o i p o j d d y 5 0 + 3 0 0 l 9 0 + 3 0 0 l L 0 + 3 0 0 l
Figure 9 Laboratory and field based relations between number of load applications to failure and initial strain level at +10%C. (Number of equivalent 100 kN singel axle loads for the field based relation) .
Djärf, Lennart Laboratory Fatigue Properties Com-Said, Safwat F. pared with Field Performance
The dashed line in the figure represents laboratory testing at +10%*C. The shift factor is about twenty, depending somewhat on which level of load applications one looks for. This is a conse-quence of the different slopes of the curves. However, the
points representing just more than one million load applications in the field curve are observed on a 13 metres wide road. All the other observations are for roads width of 9 metres. Taking account for distribution of traffic across the road on 13 metres cross sections, would decrease slope of the fatigue curve
(decrease the exponent) .
REFERENCES
(1) Jansson, H. Regressionssamband för beräkning av påkänning i asfaltbeläggning ur deflektioner mätta med fallvikt. VTI Notat V190, 1992 (in Swedish) .
(2) Byggnadstekniska föreskrifter och allmänna råd. Vägverket 84 (in Swedish) .
(3) Said, S.F. Tensile and Fatigue Properties of Asphalt Mix-tures using Indirect Tensile Test. Bulletin 8902. Dep. of Highway Engineering. Royal Inst. of Technology, Stockholm 1989.
(4) Deacon, J.A. and Monismith, C.L. Laboratory Flexural Fa-tigue. Testing of Asphalt-concrete with Emphasis on Com-pound-loading Tests. Highway Research Record No. 158, 1967.
(5) Ruth, B.E. and Olson G.K. Creep effects on fatigue Testing of Asphalt Concrete. The Association of Asphalt Paving Technologists, Vol. 46, 1977.
Djärf, Lennart Laboratory Fatigue Properties Com-Said, Safwat F. pared with Field Performance
(6)
(9)
Kim, Y.R., Khosla, N.P. and Kim, N. Effect of Temperature and Mixture Variables on Fatigue Life by Diametral Fatigue Testing. Transportation Research Board, 1991.
Adedimila, A.S. and Kennedy, T.W. Fatigue and Resilient Cha-racteristics of Asphalt Mixtures by Repeated-Load Indisrect Tensile Test. RR 183-5. Univ. of Texas at Austin, 1975.
Van Dijk, W. and Visser, W. The Energy Approach to Fatigue for Pavement Design. The Association of Asphalt Paving Technologists. Vo. 46, 1977.
Bonnaure, F., Huibbers, A.H.J.J. and Boonders, A. A Labora-tory Investigation of the Influence of Rest Periods on Fa-tigue Characteristics of Bituminous Mixes. The Association of Asphalt Paving Technologists, Vol. 51, 1982.