School of Innovation, Design and Engineering
Evaluating Lean Manufacturing Proposals
through Discrete Event Simulation – A Case
Study at Alfa Laval
Master thesis work
30 credits, Advanced level
Product and process development Production and Logistics
Sönke Detjens
Erik Flores
Commissioned by: Alfa Laval Tutor (company): Rebecca Nilsson Tutor (university): Mats Jackson Examiner: Sabah Audo
ABSTRACT
In their strive for success in competitive markets companies often turn to Lean philosophy. However, for many companies Lean benefits are hard to substantialize especially when their ventures have met success through traditional manufacturing approaches. Traditional Lean tools analyze current situations or help Lean implementation. Therefore productions facilities require tools that enhance the evaluation of Lean proposals in such a way that decisions are supported by quantitative data and not only on a gut feeling.
This thesis proposes how Discrete Event Simulation may be used as an evaluation tool in production process improvement to decide which proposal best suits Lean requirements. Theoretical and empirical studies were carried out. Literature review helped define the problem. A case study was performed at Alfa Laval to investigate through a holistic approach how and why did this tool provide a solution to the research questions. Case study analysis was substantiated with Discrete Event Simulation models for the evaluation of current and future state Lean proposals.
Results of this study show that Discrete Event Simulation was not designed and does not function as a Lean specific tool. The use of Discrete Event Simulation in Lean assessment applications requires the organization to understand the principles of Lean and its desired effects. However, the use of traditional static Lean tools such as Value Stream Mapping and dynamic Discrete Event Simulation complement each other in a variety of ways. Discrete Event Simulation provides a unique condition to account for process variability and randomness. Both measurement of and reduction in variability through simulation provide insight to Lean implementation strategies.
(Keywords: Lean, Manufacturing, Lean Tools, Discrete Event Simulation, Value Stream Mapping)
ACKNOWLEDGEMENTS
The authors would like to express their gratitude to Alfa Laval for the opportunity to develop this project. We would like to thank Rebecca Nilsson at the Lean Six Sigma Black Belt, Quality & Environment Department for her support on a professional and personal level.
Special thanks to Jessica Bruch and Mats Jackson at MDH for their guidance and constructive criticism of our work.
Lastly this thesis would not have been realized without the support of the Swedish winter and spring which kept us indoors.
CONTENTS
CONTENTS ... i
LIST OF FIGURES ... III LIST OF TABLES ... IV LIST OF ABBREVIATIONS ... V 1. INTRODUCTION ... 1 1.1 BACKGROUND ... 1 1.2 COMPANY INTRODUCTION ... 2 1.3 PROBLEM FORMULATION ... 3
1.4 AIM AND RESEARCH QUESTIONS ... 4
1.5 PROJECT LIMITATIONS ... 4 2. RESEARCH METHODOLOGY ... 6 2.1 RESEARCH APPROACH ... 6 2.2 RESEARCH METHOD ... 6 2.3 LITERATURE REVIEW... 7 2.4 DATA COLLECTION ... 7 2.5 DATA ANALYSIS ... 9 3. THEORETIC FRAMEWORK ... 10
3.1 LEAN AND ITS TOOLS ... 10
3.1.1 Lean Development ... 10
3.1.2 Lean Implementation ... 11
3.1.3 Tools for Lean Implementation ... 16
3.2 SIMULATION ... 21
3.2.1 Appliance of Simulation ... 21
3.2.2 Information that Simulation Provides ... 22
3.2.3 Systems and System Requirements ... 23
3.2.4 DES and ExtendSim... 24
3.2.5 Steps in Model-building ... 25
3.2.6 Data output validation ... 29
3.3 LEAN AND SIMULATION ... 32
3.3.1 Reason for Fusion ... 32
3.3.2 DES complementing Lean ... 33
4. EMPIRICS ... 35
4.1 ALFA LAVAL AND LEAN ... 35
4.2 THE PRODUCT... 37
4.3 PROCESS DESCRIPTIONS ... 38
4.3.1 Current Process ... 38
4.3.2 Current Process Analysis ... 39
4.3.3 New Proposed Process ... 42
4.3.4 Need for Simulation ... 43
4.4 DISCRETE EVENT SIMULATION APPROACH... 45
4.4.1 Model Data ... 45
4.4.2 Current State Modeling ... 51
4.4.3 Future State Modeling ... 56
5. ANALYSIS ... 60
5.1 COMPARISON OF RESULTS ... 60
5.2 RESEARCH QUESTIONS ... 63
5.2.1 What elements are required for DES to work as a tool to analyze different Lean proposals? ... 63 5.2.2 How do a dynamic tool such as DES and a static tool such as VSM complement
5.2.3 What sort of information can DES provide to the analysis of different Lean
proposals? ... 72
6. DISCUSSION AND CONCLUSIONS ... 76
6.1 CASE STUDY RELATED RECOMMENDATIONS ... 76
6.2 RESEARCH FINDINGS ... 77
6.3 DISCUSSION ... 78
7. REFERENCES ... 80 APPENDICES ... I
LIST OF FIGURES
Figure 1 ALPS logo ... 3
Figure 2 Lean Implementation according to Åhlström ... 14
Figure 3 The Lean implementation cycle according to Hobbs ... 15
Figure 4 Product / Service family grids ... 17
Figure 5 VSM example (Rother & Shook, 2009) ... 17
Figure 6 Takt board (George, Rowlands, Price, & Maxey, 2005) ... 19
Figure 7 Steps in the Kaizen process according to Burton & Boeder (2003) ... 20
Figure 8 Steps in a simulation study (Banks, et al., 2004) ... 28
Figure 9 Example of Data and resulting Histogram... 30
Figure 10 Examples of Graph Distribution ... 30
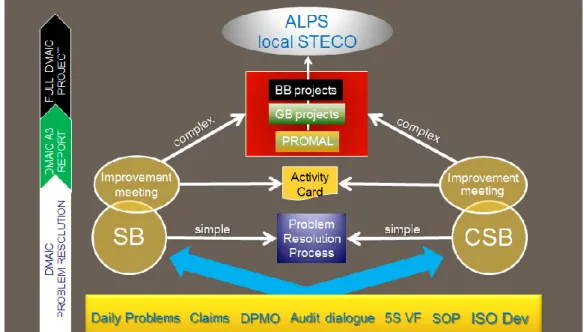
Figure 11 PROMAL project methodology framework ... 36
Figure 12 Liquid separator and separator bowl disc ... 37
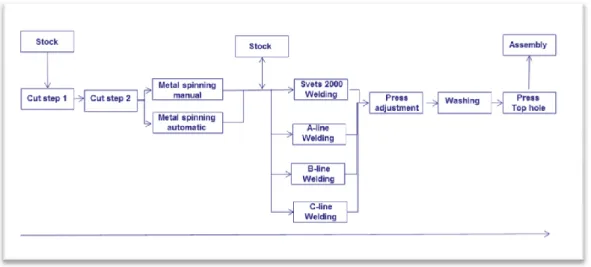
Figure 13 Current bowl disc production process at Cell C6 ... 38
Figure 14 VSM analysis of the current production process ... 39
Figure 15 Balance Load Chart ... 41
Figure 16 The use of spaghetti diagrams helped identify and eliminate muda ... 41
Figure 17 Future bowl disc production process at Cell C6 ... 42
Figure 18 Alternative processes based on Lean principles ... 43
Figure 19 Variables for which models were required to provide a solution for ... 43
Figure 20 Simulation evaluation parameters... 45
Figure 21 Data distribution and quantity split based on VSM analysis ... 46
Figure 22 Unplanned maintenance represented as distribution ... 48
Figure 23 Histogram ... 50
Figure 24 Model complexity increased to meet the project's objectives ... 52
Figure 25 Scenarios of current state model ... 53
Figure 26 Future State Layouts ... 57
Figure 27 Analysis Stages of Future State ... 58
Figure 28 WIP Increase in 2 Shift Current State Model ... 61
Figure 29 WIP Increase in 3 Shift Current State Model ... 62
Figure 30 Organizational Lean Development of Cell C6 Project at Alfa Laval ... 64
Figure 31 Lean Tools vs Lean Principles at Alfa Laval ... 65
Figure 32 Process variability and waste ... 66
Figure 33 Validation process of DES models at Alfa Laval ... 67
Figure 34 Caption Create Block ... 69
Figure 35 Difference of Visualization between VSM and DES ... 71
Figure 36 Queue Statistics ... 71
Figure 37 ExtendSim and VSM Data comparison ... 72
Figure 38 Effects of process variability in DES... 73
Figure 39 Characteristics of Future State Information ... 74
LIST OF TABLES
Table 1 4P´s of Lean according to Liker (2004) ... 13
Table 2 Steps and descriptions in VSM process according to Bicheno (2004) .... 18
Table 3 Comparison of Kaizen and DMAIC processes according to Burton & Boeder (2003)... 20
Table 4 Components of a system (Banks, et al., 2004) ... 23
Table 5 Comparison of Muda and DES ... 34
Table 6 Sample of data acquired through VSM analysis ... 40
Table 7 Variety of production values ... 44
Table 8 Distribution of welded items was randomized based on VSM analysis .. 46
Table 9 Production data with variation of order quantity between products ... 47
Table 10 Evaluation Data ... 49
Table 11 Current Layout and current Demand ... 54
Table 12 Current Layout Future Demand ... 55
Table 13 VSM Volume Selection ... 58
Table 14 Two Shifts Future Demand Movex ... 59
Table 15 Three Shifts Future Demand Movex ... 59
Table 16 Overall Comparison Two Shifts ... 60
Table 17 Overall Comparison Three Shifts ... 60
Table 18 Significance of model variability inclusion ... 66
Table 19 VSM data used for current state model ... 69
Table 20 Waste VSM and Simulation Matrix ... 70
LIST OF ABBREVIATIONS
ALPS Alfa Laval’s Production System
CU Component Units
DES Discrete Event Simulation
DMAIC Define Measure Analyze Improve and Control DPMO Defects Per Million Opportunities
ERP Enterprise Resource Planning
PROMAL Project Management Alfa Laval
SKPU Production Development Steering Committee
SMED Set Up Time Reductions
SU Supply Units
TPM Total Productive Maintenance
TPS Toyota Production System
VSM Value Stream Mapping
1. INTRODUCTION
Production sites and manufacturing facilities around the world have implemented principles of Lean manufacturing to reach levels of efficiency and effectiveness satisfactory for their type of industry. The question many a company faces is not whether Lean manufacturing is a path to travel, but how to evaluate whether Lean proposals of improvement will comply with Lean manufacturing principles while at the same time achieve a company’s desired goals.
This thesis proposes Discrete Event Simulation as an answer to the abovementioned problem. A case study approach is undertaken, and the reasons that led the company to its deciding over Discrete Event Simulation are listed. The problem situation at large is narrowed to a group of research questions that bear direct relation to Lean manufacturing and Discrete Event Simulation. Finally, the chapter defines the scope and limitations of the case study.
1.1 Background
Globalization has come to be one of the prominent features of the current trend of evolution of national economies (Requier-Desjardins, Boucher, & Cerdan, 2003). It links companies and customers all over the world and affects industrial activities including final products and inputs such as raw material, intermediate goods, machinery, finance, technology, as well as human resources (Grossman & Helpmann, 1991). The resulting industrial competitiveness forces companies to value production flexibility more than ever as time-to-market has become critical due to shortened product life cycles and variation in customer demand (Zhang, 2010). To benchmark how to manufacture in a more productive and efficient way under Lean Principles, companies have followed the Toyota Way. (Liker, 2004). The principles of Lean and its documented benefits are enticing. Yet the decision to implement Lean manufacturing is a difficult one because of the substantial differences between traditional production and Lean manufacturing systems in employee management, plant layout, material and information flow systems, and production scheduling/control methods (Detty & Yingling, 2000). There exists a natural resistance to adopt principles that seem to contradict the status quo. Understandably management teams require tools that may provide information regarding the benefits, or lack thereof, of Lean initiatives when compared to traditional methods of production.
If implemented, traditionally Lean initiatives have focused on identifying value adding operations, and waste reduction through the use of tools such as Value Stream Mapping (VSM) that may support the analysis of information and decision making process. VSM is a very effective tool in mapping the current and future state of an organization’s Lean activities. Despite its many benefits VSM may only go so far, and its powers are bounded to technical restrictions such as being time-consuming, its inability to detail dynamic behavior of production processes and to encompass their complexity, have spurred us to turn to simulation (Lian, 2007), or its limitations in calculating variability information that describe system
variations and uncertainty means that more powerful analytical tools are needed (Mahfouz, 2011). Not only is it time consuming to generate a VSM analysis but its outcome might need at least a few months of a continued monitoring to observe the effects of changes and improvements (Hines P. R., 1998).
Tools such as simulation may fill up the void that exists from non-dynamic analysis methods such as VSM. In addition to these benefits, simulation may provide insight into possible outcomes given certain inputs before decisions are made and investments committed. Simulation makes it possible to optimize operations and visualize processes logically or in a virtual environment, outcomes are saved in terms of costs, time, and resources (Heilala, 1999). Thus simulation not only complements Lean concepts but highlights feasible and reasonable initiatives Lean practices.
Early technology adopters viewed simulation as a method of last resort to be employed when everything else had failed (Singh, 2009). The advancement of computer sciences, software access and proficiency in the use of simulation tools by end users has propelled the development of this field. Simulation has witnessed a change of perception in its applicability to the industry, and a refinement is many fields as is the case of Discrete Event Simulation.
Discrete Event Simulation (DES) is used to model systems that are composed of real-world elements and resources that interact when specific events occur. Modeling includes a combination of elements, and a series of logically related activities. All this is organized around events to achieve a specified outcome. Practitioners who engage in DES build comprehensive models of industrial and commercial systems to analyze, design, and document manufacturing, service, and other discrete processes. Whether current operations are modeled or proposed changes are tested, the resulting models make it easy to find operational bottlenecks, estimate throughput, and predict utilization (Imagine That Inc., 2010)
1.2 Company Introduction
Alfa Laval is a leading global supplier of products and solutions for heat transfer, separation and fluid handling though their key products – heat exchangers, separators, pumps and valves. Alfa Laval’s products are used in the manufacturing of food, chemicals, pharmaceuticals, starch, sugar and ethanol, and service the engineering sector, mining industry and water treatment operations. The company is organized into Component Units (CU) and Supply Units (SU) that employ 11,400 people the majority of whom are located in Sweden, Denmark, India, China, the US and France. Alfa Laval is represented in 100 different countries, has over 300 patents, and launches nearly 35 to 40 new products every year.
One of Alfa Laval’s most important sites is its Eskilstuna factory, a Global CU and SU. At its Eskilstuna facility liquid separators are designed, manufactured, assembled, tested and shipped to customers the world over. High quality standards are a rule of law for all the components that make up a separator as the product is custom built for each application.
Amongst a separator’s most critical components are bowl discs, cone shaped metallic artifacts that permit two liquids to be separated from each other through centrifugal forces. The manufacturing of a bowl disc is closer to mass production than any other component in a separator. Bowl discs are produced in cell C6, a small factory in its own right, and encompass the highest volume item in the factory with 75,000 units per year.
Alfa Laval in its acknowledging the importance that quality bestows upon its products has worked with Lean Six Sigma since 2007. In that year the company introduced ALPS (Alfa Laval’s Production System), a production system built upon the philosophies of Lean and Six Sigma. ALPS has been implemented in all factories and distribution centers and is considered the framework for Alfa Laval’s development as a company anywhere from employees’ workplace to global projects.
Based on ALPS, several improvements have been implemented at the Eskilstuna factory such as: new machine investments, introduction of new material flows, SMED (set up time reductions), 5S and visual factory. When new volume forecasts required a production output that exceeded the current capacity of bowl disc production, ALPS was used to provide a solution. The situation of cell C6 was critical; with an increase in demand C6 would become the factory’s production bottleneck. Therefore, management decided to start up a project that would increase capacity and improve quality of cell C6 based on Lean principles.
1.3 Problem Formulation
The concept of Lean production and the principles that encompass its practice are a topic of immediate interest in a growing sector of industrial practices, as well as in a number of service related sectors. One may wonder as to why this concept has expanded from a very punctual agenda in the automotive industry to an expansive system of practices that have an impact anywhere from food industry to health care to product development.
Clearly Lean concepts and principles touch upon critical aspects of any production process and shed light into universal problems. The Lean operations management design approach focused on the elimination of waste and excess from the tactical product flows at Toyota (the Toyota “seven wastes”) and represented an alternative model to that of capital-intense mass production(Hines P. H., 2004), aspects important to any company whatever its end product or activity may relate to. Companies in search for a competent performance have realized the importance of both principles above.
In today’s global market competitiveness is constantly in management’s list of priorities. Literature is indicative of a correlation between the practice of Lean and competitiveness as suggested by Bhasin (2006). Yet despite its storied past and the track record of success in the Japanese automotive industry Lean has been hard to digest for many a western based company.
It is only understandable that change will draw aversion to a new untried method. For companies that have long relied on traditional approaches to their manufacturing systems, it is often difficult to gain from management the commitment required to implement Lean manufacturing (Abdulmalek, 2007). One reason for this is the difficulty in accurately determining the impact of ‘Lean’ transformations, especially when this requires changes in assets (Lian, 2007). When investment is anticipated and clear-cut results are expected the above practices are no longer sufficient for many management teams.
Therefore productions facilities require tools that enhance the evaluation of Lean proposals in such a way that decisions are supported by quantitative data and not only on a gut feeling. Proposal assessment and evaluation are broad enough areas. This thesis report focuses on the evaluation of Lean proposal in a production context.
1.4 Aim and Research Questions
This thesis proposes DES as a tool to evaluate Lean manufacturing proposals through a production perspective. DES complies with a number of parameters upon which to compare a future production state to the current situation. Although many other methods of simulation exist DES is forwarded a solution as it conforms to many of the characteristics that researchers support are necessary to perform a dynamic evaluation of production processes. The aim of this thesis is to analyze how DES may be used as an evaluation tool in production process improvement to decide which proposal best suits Lean requirements.
This thesis will answer the following questions in support of its research aim: 1. What elements are required for DES to work as a tool to analyze different
Lean proposals?
2. How do a dynamic tool such as DES and a static tool such as VSM complement each other?
3. What sort of information can DES provide to the analysis of different Lean proposals?
1.5 Project Limitations
Lean thinking and its principles are at the core of this thesis. A succinct overview of its practice and development is presented. This thesis does not explore the methodology, principles, or philosophy of Lean thinking. This thesis elaborates on the idea that current tools for Lean evaluation such as VSM, Load Balance Charts, and production runs may not suffice when a future Lean state is to be implemented. This report describes the benefits and limitations of such tools in the production decision making process.
This research takes upon Lean as one possible solution to reach competitiveness. However, the question at hand is not whether a company should or should not become Lean. The question proposed by this research is how may companies undergoing a Lean transformation evaluate whether any given Lean proposal will be beneficial or not to its production process? This thesis seeks to clarify which tools may be of help for companies to decide which Lean option best suits a given set of requirements.
The literature study presented in this report describes simulation as a tool of Lean Production. A number of simulation methodologies are reviewed to elaborate on the span of simulation as a field of study. DES is defined at large and its relation to Lean Production Systems is explained. A relationship between DES and decision making in production systems is drawn. The principles, cycle, characteristics, benefits, and shortcomings of DES are described.
A case study is presented to support the literature review. The case study was limited to a production improvement simulation of two different Lean scenarios when compared to a current regular production state. The total duration of the simulation project was 20 weeks. The simulation results are restricted by data acquisition, study proposals, time, and the project’s scope.
Data acquisition was supported by the use of Alfa Laval’s Enterprise Resource Planning (ERP) system and validated by Planning, Production, and Lean departments. Simulated data was not supported by on site measurements, but all information was validated by process owners. Simulated data was substantiated with information acquired through process owner interviews.
All future state proposals were generated and submitted by the Alfa Laval Lean Six Sigma project group. Ideation, modification, and changes in the simulation of future alternatives were responsibility of Alfa Laval. The simulation’s scope was defined as that of providing a forecasting tool to compare alternative solutions to a current problem. None of the simulated scenarios, or their results, was meant to follow the principles of optimization. All simulated scenarios, outputted data, and analysis were developed through ExtendSim V8.0 Software.
This project makes extensive use of information collected from organizational records. Simulated scenarios, especially those dealing with current states, were built based on data from VSM analyses. VSMs and their data are taken as pieces of information to support the simulated scenarios. An extensive explanation of how to perform a VSM analysis, its elements, and interrelation is beyond the scope of this thesis.
2. RESEARCH METHODOLOGY
This thesis based its research method on both theoretical and empirical studies. A literature review helped define the problem. Tools for problem solving were described through published research and one in particular was chosen as a solution. The reasons as to why this particular tool was selected were substantiated. A case study was carried out to investigate through a holistic approach how and why did this tool provide a solution to the research questions. Finally an evaluation of the solution was made and results were presented.
2.1 Research Approach
A deductive approach was selected to answer the question of whether DES provides a tool for Lean proposal analysis. This thesis considered necessary the reduction of a larger problem to specific areas of analysis. A group of elements were identified in the evaluation of future state Lean proposal implementation when using DES (research question 1). In addition to this a qualitative comparison between Value Stream Mapping, a traditional tool for Lean production assessment, and DES was made (research question 2). Finally a qualitative analysis was performed in regards to how DES can assist in analyzing different Lean proposals (research question 3).
2.2 Research Method
Because an intensive study of a single unit of analysis was pursued with the purpose of understanding a larger concept, the evaluation of Lean manufacturing proposals through DES, a case study method was selected (Gerring, 2004). In addition to this the authors of the study desired a holistic, in-depth investigation (Feagin, Orum, & Sjoberg, 1991). A small degree of control over the elements that Alfa Laval desired to control was prevalent in the study; thereby, a survey or an experimental approach were discarded as research methods. Furthermore, the method required that the research focus on the contemporary phenomena of Lean production principles established by Alfa Laval in relation to the company’s future production context within the realm of their current real-life shortcomings and needs. Finally the case study was preferred as it is closely linked to its answering the questions of “how” and “why” phonomena occur (Yin, 1993). The type of case study selected closely followed the design suggested by Yin (Yin, 1993). A single case study variety was selected to narrate and analyze the case. Information provided by the study is augmented by graphic information (VSM, Balance Load Charts, and simulation analysis). A linear analytical structure was established: relevant literature was reviewed, a DES method was used, simulated data was collected and analyzed, and the conclusions and implications of the findings were established. An explanatory case study strategy was selected as the purpose of the case study was not meant to explore a new field of research. The study focused on how could DES be used to evaluate Lean
manufacturing proposals and the manner in which the research questions interrilate to the study’s aim.
2.3 Literature Review
The literature study shortly introduces the concept of Lean Production and gives a brief background on the subject. Tools used in the evaluation and implementation of Lean proposals were reviewed at length. Characteristics of traditional tools in relation to Lean proposal evaluation were described. The blind spots of such tools were defined, and a need for other tools was established.
Simulation was introduced and an explanation of its application and outputs follows. The literature review then built upon this concepts and narrows the subject of simulation into one of its branches that of DES. DES was scrutinized and a section is devoted to researchers´ proposed steps of the model building process. Finally the elements that make DES a useful tool for Lean implementation were clarified.
Literature review was performed through the use of the Internet databases Google Scholar, Discovery, and DiVA. Searched documents cover a span of time between the years 1989 and 2013 and the most recent publications were emphasized. Concepts used to search for articles included: Principles of Lean Manufacturing, Tools of Lean Implementation, Tools of Lean Evaluation, Simulation, and DES.
2.4 Data Collection
Data was collected from week 4 to week 8 of 2013 at Alfa Laval´s Eskilstuna factory on a daily basis from Monday through Friday between 9.00 am and 5.00 pm. Outputted data from two large groups of tools for Lean implementation were categorized: on the one hand, traditional Lean evaluation tools such as VSM, Balance Load Charts, and production runs; on the other hand, DES. Collected data was qualitative in that the type of information gathered from the two groups of tools was described and compared. Data gathered from simulated scenarios was quantitative in as much as forecasts, averaged production volumes, lead times, and batch sizes were measured and analyzed.
Organizational records were used extensively at the start of the project. Value Stream Map results from previous Alfa Laval studies were used and served two purposes. Firstly, VSM output data provided a general idea of the shortcomings of this tool when faced with evaluating a future Lean manufacturing proposal. Secondly, VSM data was used to build a current state simulation model. Although a current simulation model was not required to meet Alfa Laval´s end goal, it was necessary in term of the authors´ comparing future Lean manufacturing proposals to the current production situation.
Data collection required the authors’ corroborating VSM records with Alfa Laval’s Lean and Six Sigma Manager, Production Manager, and machine operators. Machine cycle, change over, planned maintenance, unplanned
maintenance, machine failure, shift scheduling, stock sizes, and queue lengths were accounted for. VSM data was compared to past production records as well as ERP production parameters. The production process was followed and detailed through a month of onsite observation in which the authors got to know the production process, machine sequence of operations, and most common production deficiencies. Discrepancies between VSM data and ERP parameters were subjected to the authors’ questioning of the Lean, Production, Planning, and Maintenance departments through a series of meetings along the duration of the project.
A key element to the models´ providing reliable output data was the simulation’s accounting for a production schedule. Two production schedules were constructed. A current production schedule fed the current state simulation. A future state production schedule was constructed to comply with Alfa Laval’s volume forecast. In addition to this, future state production schedule met product mix, volume, orders, and machine sequence of operations. These two sets of schedules were divided into two separate groups: VSM production schedule, and real life production schedule. Current and future simulated production schedule through VSM was taken from organizational records. Real life production schedule information was taken from historical production logs. In total 5 weeks of production from a year to date were used. Alfa Laval’s Planning department, through its ERP system, provided information of past production. The relevance of the 5 sampled weeks was verified and validated by the Production Manager and Lean Six Sigma Manager.
Planned and unplanned maintenance was accounted for in all simulated scenarios. Data acquired to feed the model was gathered from two sources: Alfa Laval’s maintenance log, and onsite observation. A thorough examination of the maintenance log was performed. The examination encompassed a year’s time of maintenance events. Irrelevant events were discriminated from the list based on inquiries to maintenance personnel and the Production Manager. Once the maintenance log was narrowed down a distribution was made to account for machine failure’s duration and frequency for all machines involved in the process. On site observation was necessary to measure and confirm the existence of micro disruptions in the process that were not entered into the maintenance log. Micro failures were discussed with and validated by operators, maintenance personnel, Production Management, and Lean Six Sigma Manager. Micro failures were accounted for in all simulated scenarios.
All simulated scenarios were built based on proposals generated by Alfa Laval. Alternative proposals were based on a combination of initiatives that tackled different problem areas within cell C6. Process owners realized the need of their modifying, and in some cases discard, the welding, cleaning, and pressing operations. In the brink of a major investment, management deemed necessary to apply a Lean approach.
A Project Group for cell C6 was deployed to include operators, production technicians, maintenance personnel, project owners, and team managers. The Project Group analyzed the production process for bowl discs separators to meet future volume through Lean principles. In addition to this technical capacities of
new equipment were revised by Production Development Steering Committee (SKPU). The result of a 2012 study yielded alternative processes with a Lean perspective.
Two different future state alternatives for Lean manufacturing were evaluated. Through a series of meetings with the Operations Development and Lean Six Sigma managers a number of parameters were established upon which to measure and analyze modeled data. In these meetings variables relevant to production improvement were set, and the criteria for selecting the best possible scenario were established. A current production state was modeled and its results recorded. A total of 64 different simulated scenarios were generated based on the combination of variables established by Alfa Laval. A winning scenario was selected for each Lean manufacturing alternative and tested with real life production demand. All relevant parameters were recorded and analyzed.
2.5 Data Analysis
Simulation ideation, development, and analysis took place onsite for a period of three months. Alfa Laval´s Lean Six Sigma Manager monitored simulation progress on a weekly basis. Different seniority levels within Alfa Laval validated the results of simulation runs. Simulated results were first discussed and presented to the Operations Development, Production, and Lean Six Sigma managers. These presentations served to validate and demonstrate the reliability of the results of the simulated scenarios when different parameters were modified.
Updates on simulation progress and results were presented on a monthly basis to Alfa Laval’s steering committee. The steering committee consisted of project owners, factory management, union representatives and stake holders. During the course of steering committee presentations the authors were asked to answer questions regarding how Lean proposals affected the production process, and what sort of production problems were to be faced according to the simulation of the Lean manufacturing proposals if such proposals were to be implemented. Final results were presented to Alfa Laval’s steering committee after a period of three months. All modeled scenarios underwent a thorough testing and validating process described in the Empirics chapter of this thesis. Simulated results were limited to a simulation run of 5 production weeks. This shortcoming of the simulation process was discussed with and approved by the Operations Development and Lean Six Sigma managers, and endorsed by Alfa Laval’s steering committee. Validity and credibility of research for the case study was discussed in the Empirics chapter of this report both of which were time and resource consuming processes.
3. THEORETIC FRAMEWORK
This chapter introduces the Lean philosophy and its tools, the basic principles of DES, and ends with a quick look on how these two can come together.
3.1 Lean and Its Tools
Lean encompasses a large body of literature paired with an equally large number of tools to help in its implementation. There are numerous literature reviews that chronicle Lean and its development through the past 70 years. Such a review is beyond the reach of this project. Nonetheless the authors consider Lean’s background an important area of discussion as it is closely linked to competitiveness. Furthermore, Lean directly affects the tools used to implement the Lean philosophy in the context of production processes. Finally the authors consider of great importance the discussion of the available Lean tools, doing so gives insight into the capabilities and shortcomings of these devices when evaluation of Lean proposals is necessary.
3.1.1 Lean Development
Lean has undergone an extensive journey chronicled by numerous researchers. The term “Lean production” was defined in 1990 to describe manufacturing techniques developed over the past 100 years by Toyota Motor Company (Baines, Lightfoot, Williams, & Greenough, 2006). Although the concept of Lean is a recent one, the idea behind its operational and cultural framework is not.
A discussion of Lean production must, at some point, reference the development of Toyota. The two are so closely knit that for many practitioners, Lean production and the Toyota Production System (TPS) are synonymous (Womack & Jones, 1996). TPS was born as a response to the trying needs of an ailing Japanese automaker at the peak of mass production. Faced with a war-torn Japanese economy starved for capital and a meager budget, TPS provided innovative solutions and where each step forward depended on the skill and creativity of shop floor team members (Dennis, 2007).
Initial concept of Lean was more extensively defined and described by five key principles (Womack & Jones, 1996):
1. Specify value – Define value precisely from the perspective of the end customer in terms of the specific product with specific capabilities offered at a specific time.
2. Identify value streams – Identify the entire value stream for each product or product family and eliminate waste.
3. Make value flow – Make the remaining value creating steps flow.
4. Let the customer pull value – Design and provide what the customer wants only when the customer wants it.
In an over simplified way the Lean thinking paradigm differentiates between waste and value within an organization. Womack and Jones (1996) defined waste as any human activity which absorbs resources but creates no value. Value defined as a capability provided to a customer at the right time at an appropriate price, as defined in each case by the customer. Lean thinking in action is the continuous identification and elimination of waste from an organization’s processes, leaving only value added activities (Rother and Shook, 1999).
The focus of Lean is on reducing the wasteful use of resources and applying a holistic approach when dealing with employees, suppliers, and customers (Maleyeff, Arnheiter, & Venkateswaran, 2008). Liker (2004) describes waste (Muda) at length in his book the Toyota Way. The concept of Muda became one of the most important concepts in quality improvement activities primarily originated by Taiichi Ohno’s famous production philosophy from Toyota in the early 1950s (Dahlgaard & Dahlgaard-Park, 2006). Muda is grouped into 8 different forms: overproduction, waiting, unnecessary transport, over processing, excess inventory, unnecessary movement, defects, and unused employee creativity. Close to the concept of Muda is that of Muri – overburdening people or equipment, and Mura – unevenness that results from an irregular production. Together the three M´s (Muda, Mura, and Muri) are necessary for leveling out the work schedule (Liker, 2004). The concept of waste and its effects on the other three M´s has been the subject of numerous research studies.
Waste reduction and value adding have been closely associated. In the view of Dahlgaard (2006) waste is everything that increases cost without adding value for the customer. Waste removal has been viewed as an occurrence that need be eradicated in the value stream for companies to complete value-adding (and non-value adding) processes (Hines & Rich, 1997). Despite its welcomed addition to a process value is not easily defined when taken within a broad perspective. Defining value in the context of a global enterprise whose goal is long-term sustainability offers a challenge. Although these enterprises pay close attention to short-term financial performance, they act in ways that enhance long-term viability (Maleyeff, Arnheiter, & Venkateswaran, 2008).
From the early mention of “Japanese management” practices to the discovery and dissemination of the TPS into the Lean paradigm it became clear the mass production methods proven successful since the early 1900s were being outperformed by the more modern and flexible aspects of Lean production. While Lean is not void of issues and controversy, the benefits appear to outweigh the investment required to transform from traditional mass production operational methods to a Lean thinking paradigm (Stone, 2010).
3.1.2 Lean Implementation
The importance of Lean implementation is supported by both economic and operational factors. Most companies fear that implementing Lean manufacturing is not only costly and time consuming, but also that the implementation of Lean manufacturing is a strategic activity requiring the support of a firm´s infrastructure, human resources management and technology development departments (Achanga, Shehab, Roy, & Nelder, 2006). One might assume that
Lean implementation will not only tie up a company´s capital but also its resources.
Therefore a company that approaches Lean implementation must be aware of the delicate nature of the decisions and actions that take place. Situation that is supported by the research performed by Karim and Arif-Uz-Zaman (2013), the implementation of inappropriate Lean strategy for a given situation can sometimes lead to an increase in waste, cost and production time of a manufacturer. Because of inappropriate selection of Lean strategies, changes may cause disruptions in the very process it meant to improve. Applying Lean strategies incorrectly increases inefficiencies of an organization’s resources and reduced employee confidence in Lean strategies (Marvel & Standridge, 2009). Furthermore, it is not always easy to justify the implementation of a Lean production program due to productivity decreases in the early implementation stages which are strongly discouraged under the traditional management accounting systems (Karlsson & Åhlström, 1996).
Because of the critical nature of Lean implementation, Lean itself is viewed as a top-down strategy in which company strategy often precludes any operational analysis. Instilling proper organizational values, organization learning and employee empowerment systems, continuous improvement programs, and setting up a consistent organization structure as well as management information systems, are essential, mandatory elements of Lean systems (Detty & Yingling, 2000). Anvari et al. (2010) proposed 11 critical success factors (management and leadership, organizational cultures, goals and objectives, problem solving, skills, continuous improvement, financial capabilities, performance measure, change, education and plan) for effective implementation of Lean strategies. An idea further supported by Roos (1990) is that it is first necessary to change employees’ attitudes to quality, in order to attain a material flow containing only value adding operations. Shah and Ward (2003) are in support of the above as they state that Lean concepts require internalization and adaptation to the circumstances of each company.
In assessing changes towards Lean production it is important to make a distinction between the determinants and the performance of a Lean production system. The ultimate goal of implementing Lean production in an operation is to increase productivity, enhance quality, shorten lead times, reduce cost etc. These are factors indicating the performance of a Lean production system. The determinants of a Lean production system are the actions taken, the principles implemented, and the changes made to the organization to achieve the desired performance (Karlsson & Åhlström, 1996).
Literature is diverse in regard to Lean implementation and no one single structured path exists. The success and implementation of any particular management strategy normally depends upon organizational characteristics, which means that all organizations should not or cannot implement a similar set of strategies in their particular case (Shah & Ward, 2003). The diversity in methods is supported by the many approaches found in literature.
Some authors approach the subject of Lean implementation as a linear process in which a first step is perhaps the most important. Roos (1990) considers that quality and the manner in which employees understand this concept is a necessary first step. Material flow and value added operations are a consequence of quality. Storhagen (1993) declares that continuous improvement is the corner stone of implementation, and that process factors that support it such as job rotation and team work are critical. Filippini (1998) on the other hand finds a correlation between product variety and implementation: in high variety implementation is secured through technological initiatives, and in low variety should focus on manufacturing organization.
Within this many tier approach Karim (2013) takes upon Lean implementation as a set of areas of opportunity:
1. Production and Process Details - At the beginning, firms need to define their own systems considering production type, order volume and demand quantity since these indicators are highly related to Lean implementation. 2. Lean Team - Based on company policy, management commitment and
future plan, Lean culture can be initiated by forming a Lean team in the next phase.
3. Performance Variables - A major part of the proposed methodology is to continuously assess performance before and after Lean implementation. In this process, the first step is to measure the current state of the process in terms of productivity, efficiency, effectiveness, VA time ratio and defect rate using different Lean assessment metrics.
Other authors have chosen to describe Lean implementation as a mesh of activities or a cycle. A good start of point to this approach is Liker´s description of how Toyota, the company who first introduced the concept, deals with Lean implementation. No particular principle is described as a central element of implementation; instead, all principles are necessary for Lean manufacturing to exist.
Toyota´s continued success at implementing Lean stems from a deeper business philosophy based on its understanding of people and human motivation (Liker, 2004). Liker offers a four phase model upon which Lean transformation must be referenced called the Four P´s. The 4P model is, to some degree, hierarchical; the higher levels build on the lower levels. Without a long-term philosophy, a company cannot implement all the actions necessary for the other three dimensions. Furthermore, the processes provide the setting for challenging and developing the employees. This step, in turn, is necessary to create a learning organization (Deflorin & Scherrer-Rathje, 2011).
Table 1 4P´s of Lean according to Liker (2004)
P Description
Philosophy Long term thinking
Process Eliminate waste and create flow
People and partners Respect, challenge, and grow with those involved
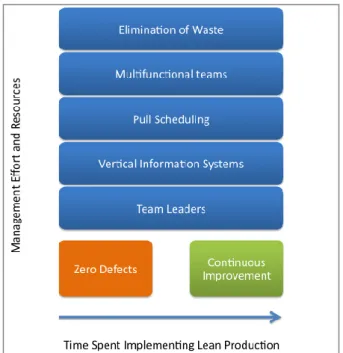
The question arises as to how the four tenets should be implemented. Åhlström (1998) performed a thorough study of the steps from traditional manufacturing to Lean. In it, he acknowledges the importance of a parallel and sequential implementation, but makes a clear distinction of which steps are to be emphasized: elimination of waste, multifunctional teams, and pull systems. Waste elimination is related to the concept of zero defects, and is viewed as a necessary first step. The importance of achieving zero defects early in the implementation is supported by the idea that to develop lasting improvements in manufacturing capabilities, managers need to devote effort and resources to quality first (Ferdows & De Meyer, 1990). Zero defect, or waste reduction, is also viewed as the first iteration of a future-state map were product designs, process, technologies, and plant locations are given and all sources of waste not caused by these features are to be removed as quickly as possible (Rother & Shook, 2009). Figure 2 illustrates the relationship between the implementation initiatives in respect to time.
Figure 2 Lean Implementation according to Åhlström
Hobbs (2003) offers an alternative first step towards Lean implementation prior to any Lean principles. Fundamentals such as understanding your products and manufacturing processes, their demand, and the real goals of response time, and quality are not to be underestimated. Lean implementation should be methodical and disciplined and to that effect a cyclical procedure, in accordance to the idea of Lean´s continuous improvement, is offered.
Figure 3 The Lean implementation cycle according to Hobbs
Figure 3 illustrates the transformation process from traditional manufacturing to Lean production. While the transformation process should proceed quickly, the pace of implementation must allow the organization and culture time to adapt to the changes being made (Hobbs, 2003). Lean is not about imitating tools in a particular manufacturing process. Lean is about developing principles that are right for an organization and diligently practicing them to achieve high performance that continues to add value to customer and society (Liker, 2004). All process steps are of value when Lean implementation is to follow a continuous improvement cycle, yet factory modeling is closest to evaluating Lean manufacturing proposals and may be traced according to the following steps: Choosing the products for Lean
Determining the products to be manufactured is critical as this decision will impact the processes and material required to produce those products and scope of Lean implementation.
Establishing capacity to meet demand
Quantity of demand is important, because it determines both the capacity of the Lean line and the amount of resources required to produce that demand
Process flow
A process in manufacturing can be a combination of resources (people and machines) that perform work to change the form, fit, or function of materials as they are converted toward the completion of the product. Process flow should consider volume variation, rework, and scrap.
Demand Levels and Takt Time
When the Lean line operates, all processes complete work at the same rate based on Takt time. Balance is at the heart of every Lean manufacturing line. Processes should be timed to produce at the takt rates (George, Rowlands, Price, & Maxey, 2005).
Calculating Resource Requirements
Because work in every process is balanced using a Takt time derived from required throughput volume, the varying standard times of different processes are of little consequence. The number of resources required to meet the Takt time target goal is the important factor. Lean methodologies seek to achieve Takt at each process. The resource calculation identifies the amount of resources needed to achieve that Takt time goal.
3.1.3 Tools for Lean Implementation
There exists a plethora of different tools and techniques developed for different purposes and waste elimination or reduction (Green and Dick 2001). Tools exist with multiple names, some of them overlap with other tools, and a particular tool might even have a different method of implementation proposed by different researchers. The misapplication of a Lean manufacturing tool may result in the additional wastage of resources such as time and money. It may also result in reduced employee confidence in the Lean philosophy (Pavnaskar, Gershenson, & Jambekar, 2003).
Taylor and Brunt (2001) developed a simple correlation matrix that relates seven different Value Stream Mapping tools to the seven basic types of wastes identified by Ohno and Shingo. Further classifications have been developed to enable matching Lean manufacturing tools to the wastes they eliminate and to the manufacturing problems they solve (Pavnaskar, Gershenson, & Jambekar, 2003). There are an abundant number of tools to identify waste, but these may not apply to the implementation of Lean when a completely new process is developed. Creating the Future State from the current state maps is a considerable challenge. It is relatively easy to take waste out of current systems whilst retaining their essential characteristics, but it is another issue to completely envision a full Lean system (Bicheno, 2004).
Rother and Shook (2009) suggest a list of questions that need be answered before Lean implementation. The information gathered by these questions will provide critical information for the future state.
1. What is the takt time?
2. Will you build a finished-goods supermarket from which the customer pulls, or directly to shipping?
3. Where can you use continuous flow processing?
4. Where will you need to use supermarket pull systems to control production of upstream processes?
5. At what single point in the production chain will you schedule production? 6. How will you level the production mix?
7. What increment of work will you consistently release and take away? 8. What process improvements will be necessary for the value stream to flow
as your future-state design specifies?
Product / Service Family Grid
Helps determine where to focus limited resources on data collection and observation so you can create a complete complexity Value Stream Map with the least time and effort. It is used prior to creating a complexity Value Stream Map to identify representative products or services to include in the map (George, Rowlands, Price, & Maxey, 2005).
Figure 4 Product / Service family grids
Value Stream Mapping
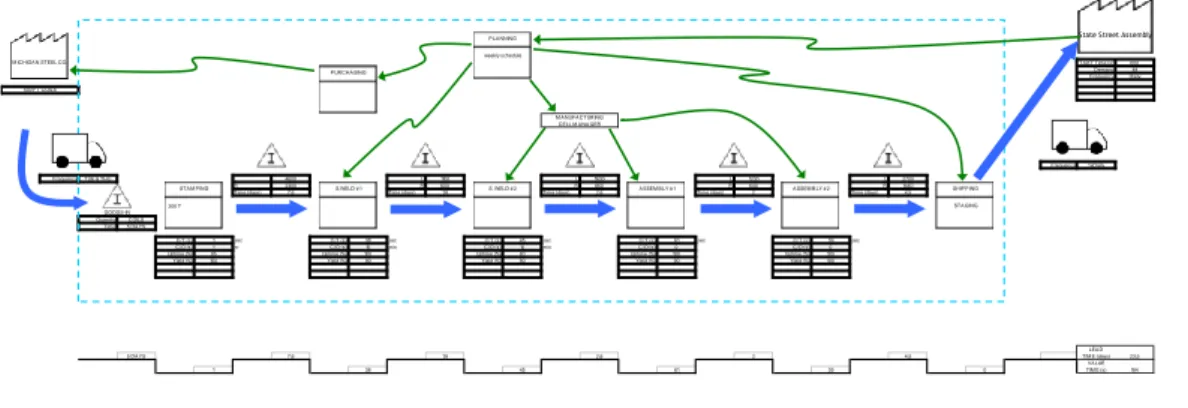
VSM is a visual representation of every process in the material and information flow. It identifies all actions required to bring a product through the main flow from raw material into the arms of the customer (Rother & Shook, 2009). VSM creates a common language about a production process, enabling more purposeful decisions to improve the value stream (McDonald, Van Aken, & Rentes, 2002). VSMs are similar to process maps, though a subtle difference is found in their focus. Whereas a process map focuses on a process that can apply across products and items, VSM is product centric and, therefore, likely to span across multiple processes. The specific purpose of the VSM is to identify activities that create: value in the eyes of the customer, no value yet are necessary steps, and no value and are candidates for waste elimination (Womack & Jones, 1996).
Figure 5 VSM example (Rother & Shook, 2009)
Much of the benefit found in VSM is tied to the fact that activities associated with sourcing, making, and delivering product span functional boundaries, and the mapping effort and its output can open everyone´s eyes to the waste created in the
TA KT Time (s) 600 Demand 48 Frequency Daily
Frequency 1 xDaily FrequencyTUE & THU L 4600 L 1100 L 1600 L 1200 L 2700
R 2400 R 600 R 850 R 640 R 1440
Time (days) 7,6 Time (days) 1,8 Time (days) 2,6 Time (days) 2 Time (days) 4,5 200 T
Quantity COILS Time 5 DA YS
C/T (s) 1 sec C/T (s) 38 sec C/T (s) 45 sec C/T (s) 61 sec C/T (s) 39 sec C/O (s) 1 hr C/O (s) 10 min C/O (s) 10 min C/O (s) 0 C/O (s) 0 Uptime (%) 85 Uptime (%) 100 Uptime (%) 80 Uptime (%) 100 Uptime (%) 100 Yield (%) 100 Yield (%) 90 Yield (%) 90 Yield (%) 90 Yield (%) 100
LEA D
5 DA YS 7,6 1,8 2,6 2 4,5 TIM E (days) 23,5
VA LUE
1 38 45 61 39 0 TIM E (s) 184
SHIP P ING
State Street Assembly
STA GING M ICHIGA N STEEL CO.
STA M P ING A SSEM B LY # 1 A SSEM B LY # 2 weekly schedule 500 FT COILS GOODS-IN S.WELD # 1 S. WELD # 2 P LA NNING P URCHA SING M A NUFA CTURING CELL M A NA GER
normal scope of business and the opportunities to improve flow. VSM maps are too often devoid of nonoperational influences, perpetuating wastes that could be eliminated through internal collaboration. Additional to this VSM cannot fully represent value in the eyes of the customer without knowing what the customer really needs and is willing to pay to receive a particular service attribute. Finally, the remedy for reducing waste may not reside in simple improvements to the current process. The best solution might be a completely revised process (Goldsby & Martichenko, 2005).
Maps should be developed by the area´s people for the area´s people. Maps should be signed off by all the participating mappers, but especially by the people from the area just mapped. Bicheno (2004) suggests the following steps in the VSM process:
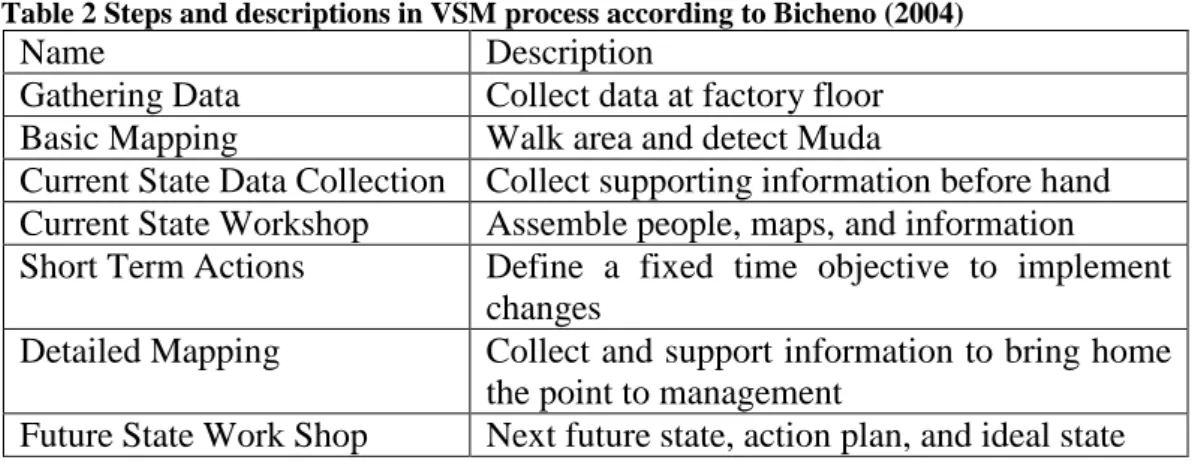
Table 2 Steps and descriptions in VSM process according to Bicheno (2004)
Name Description
Gathering Data Collect data at factory floor Basic Mapping Walk area and detect Muda
Current State Data Collection Collect supporting information before hand Current State Workshop Assemble people, maps, and information Short Term Actions Define a fixed time objective to implement
changes
Detailed Mapping Collect and support information to bring home the point to management
Future State Work Shop Next future state, action plan, and ideal state
Layout
Spaghetti charting or diagrams depict the physical flow of work or material in a process, and are used to improve the physical layout of a workspace. Spaghetti diagrams are a floor plan of the area under consideration with lines showing the people movement or the materials movement for a particular process. Through this diagram it is possible to calculate travel time per part produced, and the ways to reduce this travel time. Spaghetti diagrams can be made for material movement or any other type of physical movement that occurs in any area under consideration (Plenert, 2006).
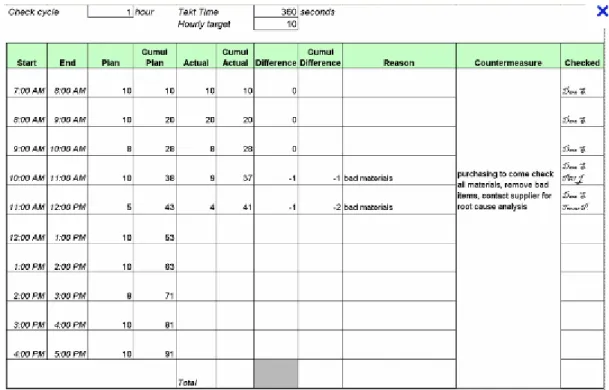
Takt Time
Takt boards monitor the output of a process or processes step to judge whether customer demand is met or not. Takt boards should provide at least 3 key pieces of information: work being done, the desired speed (completion rate), and the actual completion rate (George, Rowlands, Price, & Maxey, 2005).
Figure 6 Takt board (George, Rowlands, Price, & Maxey, 2005)
Takt time differs from cycle time, which is the actual time it takes to do the process. The goal is to synchronize takt time and cycle time to the greatest extent possible. Synchronization of these two parameters allows processes integration into cells in support of our goal of one at a time production. Small frequent pulling helps find the pace of production (Dennis, 2007).
(1)
In a true one-piece flow process, every step of the process should be producing a part. If the process goes faster it will overproduce; if the process is slower, it will create a bottleneck department. Takt can be used to set the pace of production and alert workers whenever they are getting ahead or behind (Liker, 2004).
Kaizen
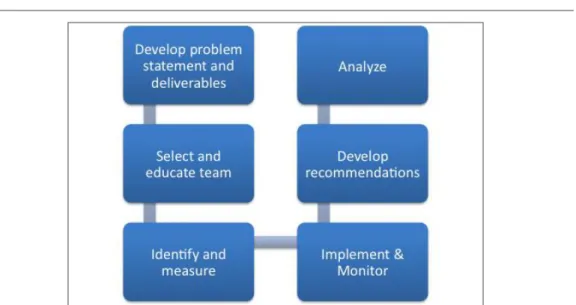
Kaizen is a method for accelerating the results of process improvement in any setting. It evolved in the application of Lean methods in manufacturing settings, but has since been adapted to the broader Define Measure Analyze Improve and Control (DMAIC) improvement cycle framework. Figure 7 shows the model structures that the Kaizen frame work according to its relation to DMAIC (Burton & Boeder, 2003). The process is closely linked to the general structure of the DMAIC. Table 3 based on Burton & Boeder (2003) equates the steps of both Kaizen and DMAIC throughout the duration of both methodologies.
Figure 7 Steps in the Kaizen process according to Burton & Boeder (2003)
Kaizen involves full time team work for a short period of time with a well-defined problem, where basic data has been gathered already. Kaizen implementation is immediate, and its goal is bounded to obvious identification of waste resources, minimal implementation risks, immediate results are expected, and when opportunities to eliminate obvious waste have been identified (George, Rowlands, Price, & Maxey, 2005)
Table 3 Comparison of Kaizen and DMAIC processes according to Burton & Boeder (2003)
Kaizen DMAIC
Develop the Problem
Statement and Deliverables Define Select and Educate Team
Identify and Measure Measure
Analyze Analyze
Develop Recommendations Improve
Implement and Monitor Control
The techniques and tools considered as the cornerstones for starting to eliminate Muda are thus referred to as “Kaizen building blocks” (Imai, 1997). Standardization, 5s, and waste elimination are implemented through Kaizen methodology. This thinking evolves towards more complex techniques and tools that are considered to be part of Lean thinking, such as: just-in-time (JIT) manufacturing (producing for transfer to the next customer only what is needed, when it is needed), kanban, poka-yoke (error-proofing), andom (visual display boards and lights), single minute exchange die, total productive maintenance, and heijunka (leveling production batch size and variety) (Lewis, 2000).
Cardboard Simulation
Bicheno (2004) describes a method to provide a set of building blocks and scheduling concepts that can be slotted together, Lego style, to construct almost any pull system. Blocks are combined to make up any factory. This procedure is not optimal but helps with fine tuning and operator buy in. The Lego simulation
should include the operation of the cell full scale by using the minimum operators and proposed new layout.
3.2 Simulation
The authors’ intention is to give an introduction of the simulation field to the reader. It is not the aim to provide a tutorial on how to thoroughly build models or how to use the chosen software. Merely, it is supposed to demonstrate when to apply simulation, what to expect out if it, and comprehensively explain the very basic steps in model building.
3.2.1 Appliance of Simulation
Simulation is the imitation of the operation of a real world process or system (Banks, Carson, Nelson, & Nicol, 2004). The behavior of a system as it evolves over time is studied by developing a simulation model. The model naturally takes the input of assumptions and gathered information concerning the operation of the system. The assumptions and information are represented by mathematical, logical and symbolic relationships between the entities or objects of the system. Once the model has been validated and verified, it can be used to investigate a wide variety of ‘what if’ questions about the real world process. Potential changes or disruptions of the system can first be simulated in order to see the effects and impacts on the system’s outcomes. In addition, simulation can be applied in the design phase of a process, before it is actually built. Therefore, simulation can used as an analysis tool for predicting effects on the system as well as a design tool for predicting the performance of such (Fishman, 2001).
Banks et al. (2004) describe purposes in which simulation is an appropriate tool in operations research and systems analysis and when it is not:
Appropriate
1. Simulation as a study of internal interaction of a complex system or of a subsystem within a complex system
2. Informational changes can be simulated and the effects of these changes on the model can be observed
3. The knowledge gained during a designing of a model can be used to suggest improvements in the system
4. Changing of inputs and observing the impacts on the outputs can lead to understanding of which variables are most important and how they interact 5. Simulation can be used to reinforce analytical solution methodologies 6. It can be used to experiment with new designs before implementation to
prepare for what might happen
7. Simulation can be used to verify analytical solutions
8. Simulating different capabilities for a machine can help determine its requirements
9. Simulation models make learning possible without the costly on-the-job constructions
11. Modern systems are mostly so complex that the internal interaction can be treated only through simulation
Not appropriate
1. When a problem can quickly be solved by common sense 2. When a problem can quickly be solved analytically
3. When it is easier to perform direct experiments than simulating 4. When costs of simulation is likely to exceed possible savings 5. When resources or time are not available to perform the simulation 6. When necessary data or estimations are not available for modeling 7. When there are no possibilities to validate and verify the model 8. When the systems behavior is too complex or cannot be defined (Banks, Carson, Nelson, & Nicol, 2004)
3.2.2 Information that Simulation Provides
Managers are likely to jump on the simulation wagon as it delivers what happens in a real system or what is perceived to happen in a system that is in a design stage. Thus, simulation is often used as the technique of choice in problem solving. Given a set of inputs and model layouts, the model is run and its behavior is observed. What follows is the process of changing the inputs and the layouts and the effects they have on the results, which are evaluated. A good solution can then be recommended for implementation (Hoover & Perry, 1989).
As this it still rather general in terms of possible beneficial information outcomes, Pegden et al. (1995) listed a more detailed overview:
1. New policies, procedures, and flows can be tested without interrupting the ongoing process of the real system
2. New physical layouts and transportation systems can be tested without their costly acquisition
3. Hypotheses about what effects what and why things occur can be tested for feasibility
4. Time can be compressed or expanded to allow for a speed-up or slow-down of the system under investigation
5. Interactions of variables and their importance can be observed 6. Bottleneck analysis can be performed
7. It provides an understanding of how systems operate rather than how people think they operate
8. ‘What if’ questions can be answered (Pegden & Shannon, 1995)
Whilst seeing these points as great opportunities, it must be considered that they come at a “cost” and caution is advised before jumping into simulation. Model building requires training and can be seen as an art that is acquired over time and through experience. It is also unavoidable that if two models are constructed by two different users, the setup and results might be similar but most likely be different. Thus, results may be difficult to interpret. Most outputs of a model are