Metabarcoding of soil nematodes: the importance of taxonomic
coverage and availability of reference sequences in choosing
suitable marker(s)
Mohammed Ahmed
1,2, Matthew Alan Back
1, Thomas Prior
3, Gerrit Karssen
4, Rebecca Lawson
3,
Ian Adams
3, Melanie Sapp
51 Harper Adams University, Newport, TF10 8NB, Shropshire, UK.
2 Swedish Museum of Natural History, Department of Zoology, Stockholm, Sweden. 3 Fera, Sand Hutton, YO41 1LZ, North Yorkshire, UK.
4 National Plant Protection Organization Geertjesweg 15, 6706 EA, Wageningen, the Netherlands.
5 Cluster of Excellence on Plant Sciences (CEPLAS), Heinrich Heine University, Population Genetics, 40225 Düsseldorf, Germany. Corresponding author: Mohammed Ahmed (mohammed.ahmed@nrm.se); Melanie Sapp (melanie.sapp@uni-duesseldorf.de)
Academic editor: Carmelo Andújar | Received 29 May 2019 | Accepted 24 September 2019 | Published 6 November 2019
Abstract
For many organisms, there is agreement on the specific genomic region used for developing barcode markers. With nematodes, how-ever, it has been found that the COI region designated for most animals lacks the taxonomic coverage (ability to amplify a diverse group of taxa) required of a metabarcoding marker. For that reason, studies on metabarcoding of nematodes thus far have utilized primarily regions within the highly conserved 18S ribosomal DNA. Two popular markers within this region are the ones flanked by the primer pairs NF1-18Sr2b and SSUF04-SSUR22. The NF1-18Sr2b primer pair, especially, has been critiqued as not being specific enough for nematodes leading to suggestions for other candidate markers while the SSUF04-SSUR22 region has hardly been tested on soil nematodes. The current study aimed to evaluate these two markers against other alternative ones within the 28S rDNA and the COI region for their suitability for nematode metabarcoding. The results showed that the NF1-18Sr2b marker could offer wide cov-erage and good resolution for characterizing soil nematodes. Sufficient availability of reference sequences for this region was found to be a significant factor that resulted in this marker outperforming the other markers, particularly the 18S-based SSUFO4-SSUR22 marker. None of the other tested regions compared with this marker in terms of the proportion of the taxa recovered. The COI-based marker had the lowest number of taxa recovered, and this was due to the poor performance of its primers and the insufficient number of reference sequences in public databases. In summary, this study highlights how dependent the success of metabarcoding is on the availability of a good reference sequence collection for the marker of choice as well as its taxonomic coverage.
Key Words
barcoding, taxonomy, DNA marker, nuclear, mitochondrial, reference database, primer
Introduction
Fundamental to any DNA sequence-based identification method is the choice of barcode marker(s) (Wilkinson et al. 2017). The chosen marker has to meet most of the criteria outlined by Floyd et al. (2002). Essentially, the targeted region must be a mosaic of conserved and variable motifs. Conservation of the region, particularly the flanks, is necessary for designing universal primers.
Within the region, conservation may also be necessary to ensure similarity between individuals of the same species. Likewise, a certain degree of variability within the sequence is required for distinguishing between spe-cies. Moreover, for the query sequence to be classified, reference sequences of this marker need to be available. Depending on the organism being studied, such a
er may occur within the nuclear, mitochondrial or plas-tid DNA.
Within the mitochondrial DNA, the cytochrome c ox-idase subunit I (COI) protein coding gene has been the most widely used region, especially for DNA-barcoding of animals. Most studies involving insects and birds have utilized a region of this gene (Hebert et al. 2003, 2004, 2016, Ramage et al. 2017). The region has been shown to be unique among at least 95% of studied species of diverse groups of organisms including birds, insects, fish etc. (Hajibabaei et al. 2007) and is thus capable of de-lineating most species of these groups. The use of this region has also been facilitated largely by the enormity of the number of its sequences within the Barcode of Life Data Systems database (BOLD) (Ratnasingham and He-bert 2007) with the collection numbering over 7.5 million validated sequences in mid-2019.
Despite its success as a barcode marker for most an-imals, attempts to utilize COI for some nematodes have not been successful for a number of reasons (Creer et al. 2010). One reason is the extremely high mutation rate of the mtDNA in nematodes compared to other taxa (Blou-in et al. 1995, Anderson et al. 1998), which h(Blou-inders the design of universal primers. The hybridization sites for the most widely used primer set LCO1490 – HCO2198 (Folmer et al. 1994) are poorly conserved across the nem-atode phylum (Blouin et al. 1998) which is likely to result in poor amplification and consequently poor recovery of taxa in bulk community analysis. The primers amplify approximately 710 bp of the COI gene, which typically gives 651 bp of readable sequences (Folmer et al. 1994).
Besides being used for discriminating species of cer-tain genera of nematodes (Janssen et al. 2016), most mtDNA-based markers have been largely overlooked in metabarcoding due to their limited taxonomic cover-age of the nematode phylum. A similar argument was put forward by Deagle et al. (2014) who demonstrat-ed how narrow the taxonomic coverage of some of the markers situated within the mitochondrial genome is. Furthermore, a significant proportion of the many COI nematode sequences in the BOLD database belong to parasites of vertebrates, insects and plants, making this region not particularly useful for free-living nematode community analysis.
The most widely used markers for metabarcoding to date have been ones associated with the nuclear ribosomal RNA gene repeats (rDNA)(Porazinska et al. 2009, 2010a, 2010b, 2012, Creer et al. 2010, Fonseca et al. 2010, Bik et al. 2012, Holovachov et al. 2017). In eukaryotes, rDNA units are known to occur in copies of up to several hun-dred tandem repeats per genome (Hillis and Dixon 1991). In Caenorhabditis elegans, the array contains approxi-mately 55 copies of the complete unit (Ellis et al. 1986). And within the nematode phylum, copy numbers range from 50 to 100 (Floyd et al. 2002). According to Creer et al. (2010), 18S and 28S subunits of this gene offer an excellent choice of barcode regions due to their multiple copies and the concerted evolution events they have been
reported to undergo (Elder and Turner 1995). This helps maintain fairly identical copies within each species.
The 18S rDNA-based markers like all markers men-tioned here have certain limitations. Aside from the fact that some 18S rDNA markers lack the resolution to distin-guish certain species of nematodes, the primers used for amplification are often not specific. Using the primer pair described by Porazinska et al. (2009) on DNA extracted di-rectly from soil, Peham et al. (2017) showed that only 2.5% of sequenced reads belonged to nematodes. To make this specific marker suitable for environmental DNA, Sapkota and Nicolaisen (2015) proposed the use of a semi-nested amplification approach they showed could increase the percentage of nematode reads from just 3% to 64%. This lack of primer specificity within this region may remain a minor issue as long as nematodes are isolated from the soil prior to DNA extraction. Given that current direct soil extraction kits can only handle a very small fraction of the recommended soil volume for nematode extraction (250 ml) (Peham et al. 2017), it is safe to say that the traditional extraction methods will continue to be widely used until the direct DNA extraction kits are improved. Peham et al. (2017) also made a case for the internal transcribed spacers (ITS) region to be considered as a barcode candidate given the large collection of sequence reference libraries of this marker available in public databases (Peham et al. 2017). However, as stated by Floyd et al. (2002), attributes of the ITS region such as its high variability even within species and showing extreme length variation between diverse nematode taxa make it a difficult marker to use. Within some species of Cephalenchus, such length variation can be as high as 29 bp in the ITS1 region (Yarza et al. 2008)
Two regions within the 18S rDNA are commonly used in metabarcoding studies involving nematodes. The first is a region amplified using the primer sets NF1-18Sr2b as used by Porazinska et al. (2009), which will from hereon be called NF1-18Sr2b marker. The second one is ampli-fied with primers SSU04F-SSUR22 (Blaxter et al. 1998) and has been used in a number of previous studies on me-tabarcoding of marine nematodes (Porazinska et al. 2009, 2010b, Creer et al. 2010, Fonseca et al. 2010, 2014, Bik et al. 2012, Holovachov et al. 2017). This second marker, which will hereon be referred to as SSUF04-SSUR22, is located very close to the 5ʹ end of the 18S rDNA. Gener-ally, NF1-18Sr2b has been the preferred choice for soil nematodes and the SSUF04-SSUR22 for marine nema-todes (Creer et al. 2010, Porazinska et al. 2010b, 2010a, Fonseca et al. 2014, Holovachov et al. 2017). Another rDNA-based marker located within the D3 expansion segment of the 28S rDNA has been previously tested on mock communities of nematodes (Porazinska et al. 2009). This region is amplified using the primer set D3Af-D3Br (Nunn 1992). Porazinska et al. (2009) showed that it was able to detect ~90% of the sampled species, and when combined with NF1-18Sr2b, enhanced the recovery of the sampled taxa to 95%. The COI-region amplified using the JB3-JB5GED (Derycke et al. 2010) primer pairs is also included in this comparison. It is clear that the COI region
has the limitation of lacking truly universal PCR primers (Deagle et al. 2014). Nonetheless, it has been included so that its performance relative to other markers, that may themselves have limitations, can be compared. The aim of this study was to compare the overall suitability of these markers for metabarcoding of soil nematodes based on (i) success with merging of paired reads, (ii) proportion of reads belonging to identified nematode and non-nematode OTUs, (iii) availability and coverage of markers within reference libraries, (iv) accuracy of taxonomy assignment and (v) abundance estimate and reproducibility of relative read frequencies of the taxa across replicates.
Materials and methods
Sample extraction and microscopy
The taxa represented in the mock community were ob-tained either from pure cultures or soil samples from within the grounds of Fera Science Ltd. in Sand Hutton, York, UK (54.015514, -0.970281). For Meloidogyne
hap-la and Globodera rostochiensis, pure cultures of second
stage juveniles were used. For Steinernema carpocapsae dauer larvae were used. For cultures of Trichodorus
prim-itivus, Ditylenchus dipsaci and Laimaphelenchus penar-di, adult females and/or males were used. Adult stages
appropriate for reliable identifications were used for all taxa that were not kept in culture but obtained from soil samples. For most of the taxa, the Whitehead tray method (Whitehead and Hemming 1965) was used for extraction. Soil samples weighing 300 g were used in each ex-traction and allowed to stand for 48 hrs – 72 hrs. For the extraction of stubby root nematodes (Trichodoridae) the two-flask method (Seinhorst 1955) was also used on 300 g soil samples. Following extraction, the nematodes were identified at low power (40× magnification) using a Lei-ca M50 stereomicroscope (LeiLei-ca microsystems Wetzlar, Germany). Three to five individuals of the same order/ family were then temporarily mounted on to a slide in a drop of water, covered with a cover slip and sealed with nail varnish. The specimens were then identified to the genus or species level under a high-power (x1000 mag-nification) compound microscope (Zeiss Axio Imager 2, ZEISS, Germany) equipped with differential interference contrast (DIC). This was done only for the taxa that were not kept in culture or already known.
Mock community
Three replicates of artificial assemblages of nematodes were used as mock communities. For each replicate 23 different genera of known abundances were placed in Eppendorf tubes containing 20 µl of molecular grade water (MGW). The mock communities were assembled to consist of taxa spanning as much diversity across the phylum as possible. In total, 19 different families belonging to six orders within the phylum Nematoda were represented (Table 1).
DNA extraction
Extractions of DNA from the mock community replicates and the single specimens were performed using the Qia-gen DNeasy Blood and Tissue Kit (QiaQia-gen, Manchester, UK). All samples (single-specimen samples and the three mock community replicates) were placed in 1.5 ml mi-crocentrifuge tubes containing 20 µl of MGW. The tubes were topped up to 180 µl by adding 160 µl of Qiagen ATL buffer, followed by 20 µl proteinase K before being incu-bated overnight at 56 °C. The lysed samples were further processed to obtain pure DNA according to the manufac-turer’s instructions for genomic DNA extraction.
Molecular identification of single specimens using Sanger Sequencing
Sequences of single specimens for 21 of the taxa repre-sented in the mock community were analyzed separately using the Sanger sequencing method for confirmation of their identities based on three distinct genomic regions. Each specimen was picked into a separate Eppendorf tube and sequences of three different regions were analyzed. Table 1. Nematode taxa included in the mock community, their families and abundances. Classifications are based on De Ley and Blaxter (2002). GenBank Accession numbers correspond to LSU (SSU for Plectus sp. only) sequences of the single speci-mens sequenced using the Sanger method.
Family Species GenBank
Access. No Abundance
Alaimidae Alaimus sp. MG994936 2
Trichodoridae Trichodorus primitivus MG994943 1 Tripylidae Tripyla glomerans MG994928 2 Longidoridae Longidorus
caespiticola MG994935 1
Longidoridae Xiphinema
diversicaudatum MG994934 1 Aporcelaimidae Aporcelaimellus sp. MG994940 1 Mononchidae Prionchulus punctatus MG994945 2 Anatonchidae Anatonchus tridentatus MG994941 1
Plectidae Anaplectus sp. MG994930 1
Plectidae Plectus sp. MG993558 2
Neodiplogasteridae Pristionchus sp. MG994929 3 Anguinidae Ditylenchus dipsaci MG994937 3 Rhabditidae Rhabditis sp. MG994944 3 Steinernematidae Steinernema
carpocapsae MG994932 12
Cephalobidae Acrobeles sp. MG994931 1 Cephalobidae Acrobeloides sp. Failed 2 Tylenchidae Tylenchus sp. Too short 3 Aphelenchoididae Laimaphelenchus
penardi sequencedNot 8
Aphelenchoididae Aphelenchoides sp. MG994938 2 Hemicycliophoridae Hemicycliophora sp. MG994927 3 Criconematidae Criconema sp. Failed 1 Heteroderidae Globodera
rostochiensis MG994942 10
Meloidogynidae Meloidogyne hapla Not
These regions were a nearly complete 18S rDNA region, the D2-D3 segment of the 28S rDNA region and the COI region. Meloidogyne hapla and Laimaphelenchus sp. had previously been studied and identified and so did not re-quire molecular confirmation.
Amplification of single specimen samples. For the 18S
rDNA, an approximately 1800 bp long region was ampli-fied as two overlapping fragments using two primer sets 988F-1912R and 1813F-2646R for the first and second fragments respectively (Holterman et al. 2006).
The polymerase chain reaction (PCR) amplification of both fragments of the 18S rDNA region was carried out in 25 µl reactions containing, 5 µl template DNA, 12.5 µl of 2× BIO-X-ACT short mix (Bioline reagents Limited, London), 0.25 µM of each primer namely 988F (5ʹ-CTCAAAGATTAAGCCATGC-3ʹ) and 1912R (5ʹ-TTTACGGTCAGAACTAGGG-3ʹ) for the first frag-ment; 1813F (5ʹ-CTGCGTGAGAGGTGAAAT-3ʹ) and 2646R (5ʹ-GCTACCT GTTACGACTTTT-3ʹ) for the second fragment, and 6.3 µl MGW. The PCR conditions were 5 min at 95 °C; 5 cycles of (94 °C for 30 sec, 45 °C for 30 s and at 72 °C for 30 sec); 35 cycles of (94 °C for 30 sec, 54 °C for 30 s and 72 °C for 30 s); and a final extension for 5 min at 72 °C.
The D2-D3 segment of the 28S rDNA region was am-plified using the primers D2Af and D3Br (Nunn 1992). The 25 µl reactions were made of up of 5 µl template DNA, 12.5 µl of 2× BIO-X-ACT short mix, 0.25 µM of each of primers D2Af (5ʹ-ACAAGTACCGTGAG-GGAAAGTTG-3ʹ) and D3Br (5ʹ-TCGGAAGGAAC-CAGCTACTA-3ʹ) and 6.3 µl MGW. The PCR conditions were as follows: 4 min at 94 °C; 35 cycles of (94 °C for 60 s, 54 °C for 90 s and 72 °C for 2 min); final extension for 10 min at 72 °C.
The 400 bp region of the COI gene was amplified us-ing the JB3-JB5GED primers (Bowles et al. 1992, Dery-cke et al. 2010). Amplification was carried out in 25 µl reactions containing the same components as with the other markers. The cycle programme consisted of an ini-tial denaturation at 95 °C for 5 min, followed by 40 cycles of denaturation at 95 °C for 1 min, primer annealing at 41 °C for 30 s and extension at 72 °C for 2 min; then a final extension at 72 °C for 10 min.
The PCR amplicons were purified using the QIAquick PCR Purification Kit (Qiagen) before being sent to Eurof-ins Genomics (https://eurofinsgenomics.eu) for sequencing using the same primers used for the PCR. The sequences obtained for single specimens are available from Gen-Bank (Benson et al. 2018) under the accession numbers
MG993556–MG993565 and MG994920–MG994946.
Analysis of Sanger Sequence data from single specimen samples. Sequences were received as both ABI and SEQ
files. Both sequence file formats were visualized using BioEdit Sequence Alignment Editor (Hall 1999). The ABI files provided the chromatographs for the base calls. Based on this, each sequence was visually edited to high quality by removing areas of ambiguous base calling inside BioEdit. Some of the edited forward and reverse reads could not be merged due to a lack of overlap between the two pairs after editing. NCBI reference database accessed on 1st February
2018 was used for the BLAST search (NCBI Resource Co-ordinators 2016). The BLAST hits from the three sequenced regions combined were used for taxonomy assignment. Amplification and Library Preparation of Mock Commu-nity samples
For each target barcode marker, four separate PCRs were set up, one for each of the three replicates plus a blank sam-ple spiked with MGW. The 5ʹ ends of each of the primers were tailed with Nextera adapter sequences (Table 2). The reaction conditions were different for each marker (see Suppl. material 1: Table S1). For all the samples, PCR was performed in 25 µl reactions containing 1× Phusion HF buffer (New England Biolabs, Ipswich, MA, USA), 0.2 mM dNTPs, 0.5 µM each of adapter-ligated forward and reverse primers, 1 U of Phusion DNA polymerase (New England Biolabs) and 5 µl of template DNA was used.
Following the initial PCR reaction, the amplicons were all purified using Ampure XP Beads (Beckman Coulter, Inc. USA). The purified products were quantified using a Qubit® Fluorometer (Thermo Fisher Scientific, Wilming-ton, DE, USA). This was then followed by an index PCR where unique dual indices and the Illumina sequencing adapters were attached to each amplicon using Nextera XT index primers (Illumina, San Diego, CA, USA) for amplification (Illumina’s 16S Metagenomic Sequencing Table 2. Primers used for amplification of the target barcode markers. Underlined sections of the sequences represent the Illumina overhang adapters.
Primer Sequence (from 5ʹ end) Source
Nex_NF1 TCGTCGGCAGCGTCAGATGTGTATAAGAGACAG GGTGGTGCATGGCCGTTCTTAGTT Porazinska et al. 2009 Nex_18Sr2b GTCTCGTGGGCTCGGAGATGTGTATAAGAGACAGTACAAAGGGCAGGGACGTAAT
Nex_SSUF04 TCGTCGGCAGCGTCAGATGTGTATAAGAGACAG GCTTGTCTCAAAGATTAAGCC Blaxter et al. 1998 Nex_SSUR22 GTCTCGTGGGCTCGGAGATGTGTATAAGAGACAGGCCTGCTGCCTTCCTTGGA
Nex_D3FA TCGTCGGCAGCGTCAGATGTGTATAAGAGACAG GACCCGTCTTGAAACACGGA Nunn 1992
Nex_D3BR GTCTCGTGGGCTCGGAGATGTGTATAAGAGACAGCGGAAGGAACCAGCTACTA
Nex_JB3 TCGTCGGCAGCGTCAGATGTGTATAAGAGACAGTTTTTTGGGCATCCTGAGGTTTAT Bowles et al. 1992
Nex_JB5GED GTCTCGTGGGCTCGGAGATGTGTATAAGAGACAG
Library Preparation protocol). PCR was performed in 50 µl reactions containing 5 µl each of Nextera XT Index primers 1 and 2, 5 µl of template DNA, 1× HF buffer, 0.2 mM dNTPs, 1 mM MgCl2, 0.5 U Phusion polymerase and 22 µl MGW. The PCR programme was set at 98 °C for 3 min, 8 cycles of 98 °C for 30 s, 55 °C for 30 s, 72 °C for 30 s and a final extension step at 72 °C for 5 min. A list of samples and the combination of indexes used are provided (Suppl. material 1: Table S2).
The indexed products were purified using Ampure XP Beads, quantified and pooled according to their molarity. After that, the pooled sample was run on an Agilent 2200 TapeStation system (Agilent Technologies, Santa Clara, CA, USA) to verify the size of the pooled amplicons. The pool was quantified and diluted to 4 nM concentration. The library was sequenced on an Illumina MiSeq using 2× 300 cycles V3 run kit.
Analysis of NGS data from mock community samples Sequence analyses were performed using USEARCH version 8.1.1861 (Edgar 2010). For each of the barcode marker, the paired reads were merged using the fastq_
mergepairs command, allowing 15 base mismatches
in the aligned region. The merged reads were quality filtered and all reads with more than one base expect-ed errors were removexpect-ed (Edgar and Flyvbjerg 2015). Details on how the expected error value of a sequence was calculated are described here: https://www.drive5. com/usearch/manual/exp_errs.html. Reads shorter than 250 bp were also discarded using the USEARCH com-mand fastq_filter. The filtered reads were dereplicated via fastx_uniques (USEARCH v9.2.64) and then clus-tered into operational taxonomic units (OTUs) at 97 % similarity cut-off using UPARSE (Edgar 2013) apply-ing the command cluster_otus which removes chime-ric reads in the process. To identify cross-talk errors, BLAST search was performed on all the OTUs and the alignment between each query OTU and the refer-ence sequrefer-ence examined. Any OTU that aligns with the wrong marker or aligns with the wrong position within the gene was flagged as a product of cross-talk error and removed.
Taxonomy assignment
OTUs were assigned taxonomy based on the utax method within USEARCH. Details on the reference databases are described below. As an alternative to the
utax approach, OTUs of each marker were assigned
taxonomy using BLAST (Zhang et al. 2000) against sequences in the NCBI nucleotide database (Sayers et al. 2018). The BLAST search was performed using the BLAST+ (Camacho et al. 2009) command line tools with all parameters left at default settings, except for the number of descriptions and alignments which were both set to five. A phylogeny-based assignment method was also performed. For this approach, the reference
sequences were first truncated to remove leading and trailing regions outside the primer annealing site of the markers using the USEARCH command search_pcr in order to facilitate alignment. The reference sequences were then combined with the OTUs and aligned using muscle (Edgar 2004), leaving all parameters at default settings. The aligned sequences were trimmed to the length of markers inside MEGA 7 (Kumar et al. 2016). The alignments were used to construct maximum like-lihood trees using RAxML version 8.2.10 (Stamatakis 2014) on the CIPRES science gateway web portal (Miller et al. 2010) with GTR as the substitution model at gamma rates distribution. Bootstrap was set to 1000 replicates. Trees were visualized, and labelled within the interactive tree of life (iTOL) web-based tool (Le-tunic and Bork 2016).
Proportion of reads assigned to nematode OTUs
Based on the results of the taxonomy assignments from the three approaches, the proportion of filtered reads as-signed to nematodes in relation to the total number of reads was determined for each marker. The accuracy of the taxonomic assignment of each marker was de-termined by comparing the exactness with which each marker recovered the taxa in the mock community at the species or genus level. For sampled taxa whose species identities were known, accurate species identification was expected whereas for the rest, accurate genus identi-fication was expected.
Reference databases for taxonomy
The reference library for assigning taxonomies to the OTUs generated from the two 18S rDNA markers was obtained from the Protists Ribosomal Reference da-tabase, PR2 v 4.72 (Guillou et al. 2012). The database
consists of 18S ribosomal RNA and DNA sequences, with curated taxonomy of protists and other metazoans including nematodes. The version used contained 4,910 nematode sequences and was last curated on 7th October
2017. Some of the sequences span the locations of both 18S rDNA markers used.
For the 28S rDNA, reference sequences were obtained from the SILVA ribosomal RNA gene database (Quast et al. 2013) downloaded on 25th January 2018. Thirteen
of the sampled taxa could not be found in this database, hence it was subsequently complemented with respective sequences from GenBank and sequences obtained from the Sanger sequencing in this study (see Suppl. materi-al 1: Table S3). A custom python script (see Suppl. mate-rial 2) was used to convert the taxonomies to utax-com-patible format as described at http://drive5.com/usearch/ manual/tax_annot.html.
A search through the BOLD database for nematode COI sequences revealed that only nine of the taxa in-cluded in the mock community had sequences avail-able for comparison. Similar to the 28S rDNA
refer-ences, sequences of nematode COI were obtained from GenBank (on 25th January 2018) using a command
within the statistical assignment package (SAP 1.9.8) (Munch et al. 2008) and formatted for utax taxonomy assignments. After formatting the sequences, only ones matching six of the sampled taxa passed to be part of the database. For the BLAST taxonomy assignments sequences from the NCBI nucleotide database were used as references.
Availability of reference sequences in public databases For each of the four markers, sequences within four dif-ferent public databases were used to determine how many nematode sequences actually contain the entire length of region covered by the respective marker. Sequences were downloaded from NCBI nucleotide, SILVA, PR2 and
BOLD databases (Table 3). Using the USEARCH com-mand search_pcr each sequence was searched for the presence of respective PCR primers of the markers. The number of sequences including the primer regions were retained and counted. The number of unique nematode genera represented in the retained sequences were deter-mined and compared for each marker.
Taxonomic coverage and abundance prediction
The markers were compared on the basis of how well they predicted the mock community both qualitatively and quantitatively. The qualitative prediction was based on how many taxa in the mock community were recov-ered while the quantitative predictions were based on the coefficient of determination (r2) of the linear regression
between the average relative read frequencies and rela-tive abundances. Similarities in the abundance estimates between the replicates were also shown by the standard deviations of their relative read frequencies and their cor-relation coefficients.
Results
Single specimens
BLAST searches were performed on the sequences of all three genomic regions that were analysed using the Sanger method against NCBI nucleotide database. This confirmed the morphological identifications of almost all the individuals. The only individuals whose identities could not be confirmed were the morphologically identi-fied Criconema and Acrobeloides sp. (Table 4). Sequenc-es were not obtained from any of the markers for thSequenc-ese taxa, which was not surprising because none of the mark-ers produced strong PCR bands for these taxa on the gel. The COI sequences were of poor quality. Therefore, after trimming, only sequences of Plectus sp. had sufficient overlap to allow for merging. In addition, six other se-quences in only one orientation remained after trimming.
Because of this and the fact that there were not enough sequences of the COI region in NCBI nucleotide database to search the sequences against, only Plectus sp. could be confirmed by this region. The D2-D3 region produced amplicons for all except the two missing taxa and was able to confirm the identities of all the taxa with ampli-cons. The two fragments of the 18S rDNA together also identified fifteen of the twenty-one specimens.
Sequence reads from mock community
The sequence reads were demultiplexed by the MiSeq Re-porter software (MiSeq® ReRe-porter Software Guide, Illu-mina, Inc., San Diego, CA, USA; Document # 15042295 v05) using default settings (allowing one mismatch in the indexes). Blank samples only yielded sequences of fun-gi and streptophyta. A summary of the number of reads generated for each marker from each of the three repli-Table 4. Confirmed identities of individuals included in the mock communities. Sequences of the three DNA regions were analysed using the Sanger method. X denotes positive identification.
Samples Morphology 18S
region region28S regionCOI
Specimen 1 Hemicycliophora sp. X Specimen 2 Ditylenchus dipsaci X X Specimen 3 Aporcelaimellus sp. X X Specimen 4 Anatonchus tridentatus X X Specimen 5 Globodera rostochiensis X X Specimen 6 Trichodorus primitivus X X
Specimen 7 Rhabditis sp. X X
Specimen 8 Prionchulus punctatus X X Specimen 9 Criconema sp. Specimen 10 Tripyla sp. X X Specimen 11 Pristionchus sp. X X Specimen 12 Anaplectus sp. X Specimen 13 Acrobeles sp. X Specimen 14 Acrobeloides sp.
Specimen 15 Steinernema carpocapsae X X
Specimen 16 Plectus sp. X X X
Specimen 17 Xiphinema diversicaudatum X X Specimen 18 Longidorus caespiticola X X
Specimen 19 Alaimus sp. X X
Specimen 20 Tylenchus sp. X
Specimen 21 Aphelenchoides sp. X X
Table 3. Databases from which nematode sequences were downloaded for each of the four markers.
Database NF1-18Sr2b
SSUF04-SSUR22 D3Af-D3Br JB3-JB5ED
NCBI nucleotide (18S, 28S rDNA, COI) X X X X SILVA (18S, 28S rDNA) X X X PR2 (18S rDNA) X X BOLD (COI) X
cates is presented in Table 5. Read numbers between the replicates of the NF1-18Sr2b samples were similar. The highest variability between the replicates was found for the markers SSUF04-SSUR22 and JB3-JB5GED.
Merged reads and sequence quality
The JB3-JB5 marker was the only region for which more than half (57%) of the paired reads were successfully merged. The marker with lowest percentage of merged reads was the SSUF04-SS0R22 (38%). Despite the low percentage of merged reads recovered for NF1-18Sr2b and D3Af-D3Br, the percentage of reads that passed the quality filtering step were much higher than that of the JB3-JB5ED marker (Table 6).
Reference database coverage
Major differences were observed for the coverage of the 18S rDNA-based markers, namely NF1-18Sr2b and SSUF04-SSUR22 across all three 18S rDNA databases (Figure 1). The total number of unique nematode genera covered by the NF1-18Sr2b marker ranged from 550 to 700, compared to 110 to 150 for the SSUF04-SSUR22. The 28S rDNA-based D3Af-D3Br marker also covered slightly more genera than the SSUF04-SSUR22. The COI-based JB3-JB5ED marker covered the fewest gen-era, although not markedly lower than SSUF04-SSUR22.
Taxonomy assignment via utax
With the utax method, only those genera assigned with support (posterior probability) values of 0.5 or higher were considered valid in this study (Table 7). For the NF1-18Sr2b marker, 23 OTUs produced valid assignments and they ac-counted for fourteen of the sampled taxa (61%). The results also revealed a phenomenon encountered in some of the curated public databases. It was observed that some of the entries had incomplete taxonomies or ambiguous descrip-tions, as pointed out previously (Holovachov et al. 2017). Several of the OTUs could not be assigned taxonomy be-cause their best hits were either ‘uncultured eukaryote’, ‘en-vironmental nematode’, ‘Chromadorea_X’ or ‘Enoplea_X’. This was seen in the markers that were assigned taxonomy with either the PR2 or SILVA reference sequences.
Using the utax method with the PR2 database, only
eight OTUs of the SSUF04-SSUR22 marker were iden-tified as nematodes, which accounted for only five of the sampled taxa (22%). The majority of the OTUs were not given taxonomic assignments, at least not with sufficient support for them to be considered valid.
For the 28S rDNA marker (D3Af-D3Br), only 22 of the total 144 OTUs were successfully assigned nema-tode identities and this accounted for eight of the sam-pled taxa (34%).
The COI marker (JB3-JB5GED) was the only mark-er for which no successful taxonomic assignments wmark-ere achieved at the genus level. Only three OTUs were
iden-Table 5. Number of sequence reads generated for each of the markers across the three mock community replicates with stan-dard error of means of the replicate samples.
Samples Number of reads
NF1-18Sr2b SSUF04-SSUR22 D3Af-D3Br JB5GED JB3-Replicate 1 (MC1) 2,483,453 3,162,379 3,897,994 1,236,201 Replicate 2 (MC2) 2,349,364 2,790,363 4,228,233 2,160,885 Replicate 3 (MC3) 2,435,278 1,953,138 4,309,817 1,204,900 Standard error of mean 39,216 357,585 125,899 377,501
Table 6. Summary of analysis results for each of the four markers.
Marker Reads successfully merged (%) Merged reads passing filtering (%) Number
of OTUs sequencesChimeric
NF1-18Sr2b 48.3 96.7 138 5,677
SSUF04-SSUR22 38.0 88.9 161 6,813
D3Af-D3Br 43.1 98.4 144 3,295
JB3-JB5GED 57.0 64.3 69 1,830
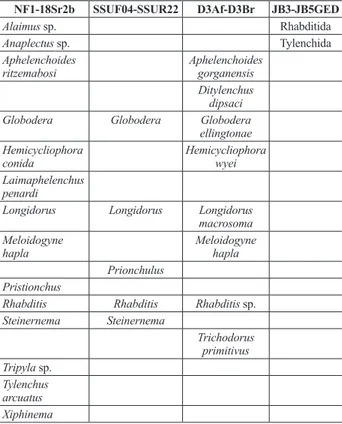
Table 7. List of taxa recovered using the utax taxonomy as-signment. For NF1-18Sr2b and SSUF04-SSUR22, the PR2 database was used as reference database and for D3Af-D3Br, combined nematode sequences from NCBI nucleotide database, sequences from this study and SILVA database were used. For JB3-JB5GED, sequences from NCBI nucleotide database, se-quences from this study and the BOLD database were used.
NF1-18Sr2b SSUF04-SSUR22 D3Af-D3Br JB3-JB5GED
Alaimus sp. Rhabditida
Anaplectus sp. Tylenchida
Aphelenchoides
ritzemabosi Aphelenchoides gorganensis Ditylenchus
dipsaci
Globodera Globodera Globodera
ellingtonae Hemicycliophora
conida Hemicycliophora wyei
Laimaphelenchus penardi
Longidorus Longidorus Longidorus macrosoma Meloidogyne
hapla Meloidogyne hapla
Prionchulus Pristionchus
Rhabditis Rhabditis Rhabditis sp. Steinernema Steinernema Trichodorus primitivus Tripyla sp. Tylenchus arcuatus Xiphinema
tified as nematodes and could only be correctly identified to the order rank. Two of the OTUs matched Rhabditida and the other one Tylenchida (according to the classifica-tion by Siddiqi (2000)).
With the exception of a few, most of the recovered taxa occurred in all three replicates for all the markers (Suppl. material 1: Table S4). For NF1-18Sr2b, only two of the fourteen recovered taxa failed to occur in each of the replicates; similarly, only one for SSUF04-SSUR22, two for D3Af-D3Br and for JB3-JB5GED, only one.
Taxonomy assignment via BLAST search against the NCBI Nucleotide Database
The OTUs generated for each of the markers were used to perform a BLAST search against the NCBI Nucleo-tide Database on 16th July 2017. Only alignments with
expect (E) values less than 0.001 were considered. The top hits were examined for matches that had complete taxonomies, and only matches with an identity ≥ 95 % were considered. Based on these criteria, all OTUs of the NF1-18Sr2b marker matched taxonomically assigned sequences in the NCBI nucleotide sequences. All sam-pled taxa were recovered with the BLAST method for NF1-18Sr2b marker, at least to the genus level (Table 8). For most of the OTUs the E values of the alignments were zero. All non-nematode matches were ignored.
The SSUF04_SSUR22 marker failed to recover nine of the sampled taxa (Acrobeles, Acrobeloides,
Aphelen-choides, Aporcelaimellus, Criconema, Hemicycliopho-ra, Laimaphelenchus, Plectus and Tylenchus) either due
to no match or identities below 95%. This marker also produced some hits that were not nematodes. OTUs of the D3Af-D3Br marker had matches for all of the sam-pled taxa except Anaplectus and Criconema. As with the other markers, there were some non-nematode hits. The JB3-JB5GED OTUs had a slight improvement with this method over the utax assignment. Unlike the utax taxonomy assignment which gave no assignments be-low the order level for this marker, the BLAST method was able to recover two of the sampled taxa,
Meloido-gyne hapla and Steinernema carpocapsae. Three OTUs
were identified as cross-talk errors and subsequently re-moved. Almost all taxa recovered by the markers were detected across all three replicates (Suppl. material 1: Table 5). In the NF1-18Sr2b samples, only three out of the twenty-three taxa failed to appear in all three cates: Criconema and Anaplectus occurred in two repli-cates while Alaimus occurred only in one. For SSUF04-SSUR22 and JB3-JB5GED all recovered taxa were found in each of the replicates. Of the 19 recovered taxa in the D3Af-D3Br samples, there were only two taxa that failed to occur in all replicates: Hemicycliophora
wyei was only found in one replicate while Acrobeles complexus occurred in two replicates.
Figure 1. Number of nematode genera with sequences of the markers available in NCBI nucleotide database, SILVA, PR2 and BOLD databases.
Taxonomy assignment using phylogenetic analyses
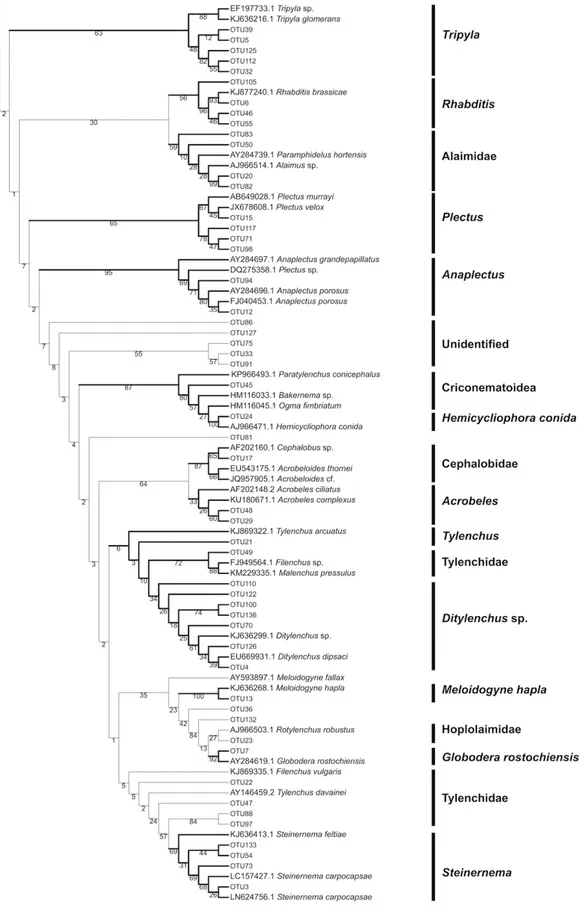
The NF1-18Sr2b-based tree placed most of the OTUs together with taxonomically assigned sequences from NCBI nucleotide database within the same clades (Fig-ure 2). The results of the tree-based assignments were very similar to the BLAST approach, with at least 22 out of the 23 taxa identified. Criconema was the only taxon whose OTUs from the NF1-18Sr2b marker were not assigned the expected taxonomy. Instead, the OTU that matched Criconema from the BLAST search clus-tered with Ogma and Bakernema, both of which are
close phylogenetic relatives of Criconema. From the SSUF04-SSUR22-tree, only four of the sampled taxa could be correctly identified (Figure 3). For the D3Af-D3Br marker OTUs of 16 of the sampled taxa were iden-tified using phylogenetic methods (Figure 4). With the JB3-JB5GED-based tree, four clades could be identified that were monophyletic but only three could be used to identify OTUs to the genus level. The OTUs clustered with these three genera: Steinernema, Longidorus and
Meloidogyne (Figure 5).
Taxonomic coverage
The calculation of taxonomic coverage of the markers was based on how many of the sampled taxa were recov-ered by at least one of the three replicates. This was based on a consensus of the results of the taxonomy assignment via utax, BLAST and the phylogenetic analysis. The NF1-18Sr2b had the highest coverage, producing 100% recovery of the sampled taxa (Table 9). All 23 taxa were detected in all three replicates, apart from Acrobeles and
Criconema. They both failed to appear in one of the
rep-licates. By combining the three methods, the number of correctly classified OTUs for this marker increased from the 23 obtained with utax to 41. This represented 97.5% of the total filtered sequence reads.
In the case of the SSUF04-SSUR22 marker, eight taxa were missing from all three assignment methods. The taxa that were recovered occurred in all three replicates. With all three methods of taxonomy assignment combined, the number of correctly assigned OTUs improved to 56. The proportion of the total reads that were accurately assigned to nematodes was 94.2%.
The 28S rDNA-based D3Af-D3Br marker assigned 70 OTUs to nematodes and recovered all taxa except
Criconema in the consensus taxonomy. Amongst the
re-covered taxa, Hemicycliophora occurred in one of the rep-licates, Acrobeles in two, while the rest were found in all three replicates. The proportion of the filtered reads cor-rectly assigned to nematodes with this marker was 95.5%. For the COI-based JB3-JB5GED marker, even the con-sensus taxonomy drawn from all three assignment meth-ods could only recover two taxa, namely Meloidogyne and Steinernema. Although the phylogenetic analysis in-cluded Longidorus in the assignment, it was discovered that OTU17 and the NCBI reference sequence KJ741245 Longidorus sp., which were clustered together had very
low percentage similarity (81%), considering the 95% minimum set for the BLAST method. In general, the con-sensus taxonomies for all the markers were almost exact-ly as what the BLAST search produced. This is because all successful assignments made by utax against the refer-ences were also positive in the BLAST search against the nucleotide database, which detected even more taxa that were missing in the utax results. Even though only two genera could be recovered, a very high percentage of the filtered reads (92.8%) belonged to nematodes.
Table 8. List of taxa recovered based on BLAST searches. All searches were performed against the NCBI nucleotide database. Only taxonomic assignments appearing in top five hits and had similarities ≥ 95%, e value < 0.001 were considered.
NF1-18Sr2b SSUF04-SSUR22 D3Af-D3Br JB3-JB5GED
Alaimus sp. Alaimus sp. Alaimus sp. Anaplectus sp. Anaplectus sp.
Anatonchus
tridentatus Anatonchus tridentatus Anatonchus tridentatus Aphelenchoides
ritzemabosi Aphelenchoides ritzemabosi Aporcelaimellus
obtusicaudatus Aporcelaimellus obtusicaudatus
Acrobeles sp. Acrobeles
complexus
Acrobeloides sp. Acrobeloides sp.
Criconema sp. Ditylenchus
dipsaci Ditylenchus dipsaci Ditylenchus dipsaci Globodera
rostochiensis rostochiensisGlobodera Globodera sp. Hemicycliophora
conida Hemicycliophora wyei
Laimaphelenchus
penardi Laimaphelenchus deconincki Longidorus
caespiticola caespiticolaLongidorus Longidorus macrosoma Meloidogyne
hapla Meloidogyne hapla Meloidogyne hapla Meloidogyne hapla Plectus
andrassyi Plectus sp.
Prionchulus
punctatus Prionchulus punctatus Prionchulus sp. Pristionchus
lheritieri Pristionchus lheritieri Pristionchus lucani Rhabditis cf.
terricola Rhabditis cf. terricola Rhabditis sp. Steinernema
carpocapsae carpocapsaeSteinernema carpocapsaeSteinernema carpocapsaeSteinernema Trichodorus
primitivus Trichodorus primitivus Trichodorus primitivus Tripyla
glomerans glomeransTripyla Tripyla sp. Tylenchus
arcuatus naranensisTylenchus
Xiphinema sp. Xiphinema
Figure 2. Continued..
Read frequencies and abundance (number of individuals)
None of the four markers provided a signification cor-relation between relative read frequency and relative
abundance of taxa in the mock community (Suppl. mate-rial 1: Table S6). The relative read frequencies between the replicates, however, revealed a strong correlation be-tween replicates for all markers except the COI-based JB3-B53D (Suppl. material 1: Table S6). For the
NF1-Figure 3. Maximum likelihood tree of the 18S rDNA-based SSUF04-SSUR22 OTUs and reference sequences from NCBI nucle-otide database.
Figure 3. Continued.
18Sr2b marker, Ditylenchus, Prionchulus, Pristionchus and Rhabditis were overrepresented (Figure 6). The most extreme deviation between relative read frequencies and relative abundance was observed in Prionchulus.
The relative number of reads associated with
Xiphine-ma, Trichodorus and Aporcelaimellus were similar to
their relative abundances in the mock community. In the case of the SSUF04-SSUR33 marker, Prionchulus and
Figure 4. Maximum likelihood tree of the 28S rDNA-based D3Af-D3Br OTUS and reference sequences from NCBI nucleotide database.
Anatonchus were also extremely overrepresented, thus
showing strong deviation between their relative read fre-quencies and their relative abundance. With this marker, the relative read frequencies of Acrobeloides, Alaimus
es. Relative frequencies of the D3Af-D3Br reads gener-ated for Tripyla, Rhabditis and Prionchulus also devigener-ated significantly from their respective relative abundances. The relative read frequencies of Xiphinema and
Figure 6. Comparison of the relative read frequencies and relative abundances of sampled taxa. Relative read frequencies are averages of the three replicates and error bars represent their standard deviations. Vertical axis represents proportion of the total number of reads or number of individuals. Blue bars represent relative read frequencies and orange bars represent relative abundance in the mock community.
dances. Finally, of the two taxa that were successfully assigned with the JB3-JB5GED marker, Steinernema was the taxon with the closest match between relative read frequencies and relative abundance. Reads of the genus Meloidogyne, the other identified taxon, deviated significantly from the relative abundance.
Discussion
Taxonomic coverage is crucial to any metabarcoding study. The ability of a marker to recover as many taxa as possible could easily be one of the main benchmarks for determin-ing its suitability for metabarcoddetermin-ing. The main aim of this study was to evaluate the suitability of four widely used markers for metabarcoding of nematodes. Therefore, this discussion will focus on how the markers performed based on a consensus of all the assignment approaches rather than the differences in performance of the taxonomy as-signment methods themselves. This subject is well cov-ered in Holovachov et al. (2017) for aquatic nematodes. The results of the current study have shown that despite recommendations to adopt COI-based markers (Prosser et al. 2013, Peham et al. 2017), there is still a significant amount of effort needed to make this region a suitable bar-code marker for nematodes. Besides being a region with currently poor taxonomic coverage, the lack of a compre-hensive reference database strongly hampers its adoption
for nematode metabarcoding in a manner similar to other animal groups such as birds, fish and insects. Although the length of the JB3-JB5GED gives it the appropriate size for application on a wide array of NGS platforms, it has the same limitation as other COI-based markers-their primer annealing sites are not sufficiently conserved across the di-versity of groups such as nematodes (Deagle et al. 2014). Nonetheless, the fact that only two taxa could be assigned taxonomy based on the COI marker may not necessarily mean that these were the only taxa that were successfully recovered. The absence of sequences in the reference da-tabase that covered the location of this marker was also a reason for the failure of OTUs from some of the sampled taxa to be correctly assigned taxonomy. The use of highly degenerate primers has been shown to improve taxonom-ic coverage in some freshwater metazoans (Elbrecht and Leese 2017). It is not clear, however, how successful this may be for nematodes and how much of the resulting reads may cover taxa other than nematodes.
Another marker whose poor coverage could be at-tributed to insufficient matching reference sequences was the 18S rDNA-based SSUF04-SSUR22. Given that this region is well conserved and that there is a large collection of reference sequences, particularly for nematodes, the failure to detect eight members of the mock community was quite surprising. However, the issue with this marker appears to be its location within the full-length 18S rDNA operon. As mentioned earlier, this marker is situated at the Table 9. Taxa recovered by the markers in at least one of the replicates from the three taxonomy assignment methods used. The num-ber of X indicates the numnum-ber of replicates in which the taxon was detected. RefSeq denotes the availability of reference sequences for taxonomy assignment of NGS reads.
Taxa in mock community NF1-18Sr2b SSUF04-SSUR22 D3Af-D3Br JB3-JB5GED
Coverage RefSeq Coverage RefSeq Coverage RefSeq Coverage RefSeq
Alaimus sp. X X X Available X X X †Available X X X Available
Trichodorus primitivus X X X Available X X X †Available X X X Available
Tripyla glomerans X X X Available X X X †Available X X X Available
Longidorus caespiticola X X X Available X X X *Available X X X Available Available
Xiphinema diversicaudatum X X X Available X X X †Available X X X **Available *Available
Aporcelaimellus sp. X X X Available †Available X X X Available
Prionchulus punctatus X X X Available X X X †Available X X X Available
Anatonchus tridentatus X X X Available X X X †Available X X X **Available
Anaplectus sp. X X X Available X X X †Available X X X Available
Plectus sp. X X X Available Available X X X *Available **Available
Pristionchus sp. X X X Available X X X Available X X X Available
Ditylenchus dipsaci X X X Available X X X †Available X X X Available
Rhabditis sp. X X X Available X X X †Available X X X Available Available
Steinernema carpocapsae X X X Available X X X †Available X X X *Available X X X Available
Acrobeles sp. X X Available X X Available
Acrobeloides sp. X X X Available X X X Available X X X Available
Tylenchus sp. X X X Available X X X Available
Laimaphelenchus penardi X X X Available X X X Available
Aphelenchoides sp. X X X Available X X X Available
Hemicycliophora sp. X X X Available X Available
Criconema sp. X X Available Available
Globodera rostochiensis X X X Available X X X †Available X X X *Available
Meloidogyne hapla X X X Available X X X Available X X X Available X X X Available
* The reference sequence obtained was for a different species of the same genus. ** The reference sequence was from this study.
5ʹ end of the 18S rDNA region and so unless the entire length of the 18S rDNA or this specific region are covered by a reference sequence, the reference is likely to not con-tain the homologous region for this maker. Although it has been used in a number of metagenetic studies involving meiofauna (Fonseca et al. 2010; Bik et al. 2012), its cov-erage within a diverse mock community has never been evaluated previously. Creer et al. (2010) examined the homology of their amplification primers to ~170 aligned sequences of nematodes and showed that 100% of base pair positions are conserved in the nematode sequences which supports this argument in suggesting that primer mismatch may not be the issue with this marker. Nonethe-less, it is still popular for studies involving marine nema-todes. For soil nematodes, however, there is still a number of taxa whose full SSU sequences need to be made avail-able to make this marker broadly suitavail-able.
The D2-D3 expansion segment of 28S rDNA region may be the region besides the 18S rDNA region that has just the right amount of conservation and variability typi-cal of a good metabarcoding marker. The region spanning these two high variability segments has also been the focus of phylogenetic studies for various groups of soil nema-todes (Douda et al. 2013; Giblin-Davis et al. 2006; Kaplan et al. 2000; Litvaitis et al. 2000; Subbotin et al. 2011, 2008, 2007, 2006, 2005). It is also a common practice for phy-logenetic analysis of certain groups of nematodes to be in-ferred based on both the commonly used 18S rDNA and the 28S rDNA region (Ahmed et al. 2013, Gutiérrez-Gutiérrez et al. 2013). Moreover, because the number of published studies on a particular genomic region may determine the number of reference sequences available publicly, it is quite convenient to build a reference database for a marker located within either the D2 or D3 segments. The entire length of the 28S rDNA marker used for the mock commu-nity study is situated within the latter segment and so there was no issue of it falling out of place with most published sequences in NCBI nucleotide database. This therefore ex-plains the high percentage assignments obtained for D3Af-D3Br compared to the SSUF04-SSUR22 marker despite there being more 18S rDNA than 28S rDNA nematode sequences. A search using the keywords, ‘Nematoda’ and ‘18S’ within the NCBI nucleotide database on 6th February
2018 yielded 24,370 entries as compared to 19,674 for the keywords, ‘Nematoda’ and ‘28S’.
Unlike the SSUF04-SSUR22, the location of the NF1-18Sr2b marker within the 18S rDNA region puts it with-in the flanks of most sequences used for reconstructwith-ing 18S rDNA-based phylum-wide phylogeny of nematodes (Holterman et al. 2006, van Megen et al. 2009). The util-ity of this marker benefits greatly from the ample refer-ence sequrefer-ences of 18S rDNA and availability of highly conserved primer annealing sites. Although Porazinska et al. (2009) reported a very high coverage of this mark-er, there were still three taxa they could not account for in the sequence reads. According to the authors, this could have been caused by a number of factors: unmet species-specific PCR requirements, nematode-nematode
template competition or nematode-non-nematode tem-plate competition.
There are several important community indices used in ecological studies that depend on absolute or relative abundance of taxa in the nematode community. These include the maturity index (Bongers 1990), enrichment, structure and basal indices (Ferris et al. 2001). Abun-dance has been used widely to compare processes such as community food web dynamics, stability and response to mineral and mechanical perturbations. In other words, almost all indices of community structure rely on abun-dance information of soil inhabiting taxa. Therefore, for metabarcoding to be accepted as an alternative to the more laborious, expensive and time-consuming classical mor-phology-based method of community analysis – for ex-ample – for soil health assessment or food web analysis, it is pertinent that the method is able to provide reliable abundance information based on the read frequencies of the recovered taxa. However, no mock community study to date has reported a strong correlation between actual abundance and read frequencies, implying that using read frequency data for computing any abundance-based index of a nematode community may produce inaccurate results. The same is true for this study; read number showed no correlation with actual abundance. In microbial ecology, however, read frequency information continues to be used even though the read frequency issue has been shown to transcend beyond studies involving metazoans such as nematodes to microbes, particularly in mixed species sam-ples (Amend et al. 2010, Edgar 2017). This lack of associa-tion between relative abundance and read frequency there-fore remains one of the key limitations of metabarcoding. The quantitative reproducibility of the replicates, however, was shown in this study. Thus, on both the lack of correla-tion between read frequencies and relative abundance and reproducibility across replicates, this study agrees with Porazinska et al. (2010b), especially for the NF1-18Sr2b marker results. The use of taxon-specific correction factors has been shown to improve the correlation between rela-tive read frequency and proportion of a taxon’s DNA in a sample (Krehenwinkel et al. 2017). Determination of such a correction factor requires knowledge of the PCR ampli-fication bias for each taxon based on experimental data. Another attempt at improving abundance estimates was described for the 16S rDNA region with limited success by (Edgar 2017) . This approach requires prior knowledge of the number of copies of the marker within each taxon and the primer mismatch, which can be linked to amplifi-cation bias, within the primer annealing site. Both these approaches hold promise for abundance estimates and could benefit considerably from advancements in genome sequencing efforts. With knowledge of the genome, at least marker copy numbers and primer mismatch for most taxa can be determined. For nematodes, genome sequencing ef-forts such as those collated on the 959 Nematode Genomes webpage (http://www.nematodes.org/nematodegenomes) will provide pivotal information to improve abundance as-sessments from metabarcoding datasets.
As observed from the different taxonomy assignment methods, methods usually employed in analysis pipelines such as QIIME (Caporaso et al. 2010), MOTHUR (Schloss et al. 2009) or USEARCH (Edgar 2010) can be used initial-ly and complemented with BLAST or other methods espe-cially for weak assignments. These methods depend on the use of curated reference databases like SILVA (Quast et al. 2013), UNITE (Kõljalg et al. 2013), RDP (Cole et al. 2014) or PR2 (Cole et al. 2014) which all get updated through
publicly available sequences. For that reason, there are oc-casions when these databases are not up-to-date with the Nucleotide collection available via NCBI. Therefore, alter-native methods such as BLAST search against the nucleo-tide collection may provide assignments that perhaps these pipeline-based methods might fail to provide. Despite the fact that a number of entries in GenBank may have dubious accuracies in terms of taxonomy (Mahé et al. 2012), most BLAST assignments in this study matched utax’s assign-ments with sufficient support (≥ 0.5).
Conclusions
In summary, for metabarcoding of nematodes, this study has demonstrated that there are many reasons to favor the NF1-18Sr2b marker as the most suitable both in terms of coverage and ease of access to reference sequences. The issue of non-specificity of this marker, whilst a problem, can mostly be avoided by extracting nematodes from soil before DNA extraction to make sure most non-targets are excluded. According to Creer et al. (2010), the fact that only a very minute proportion of soil or sediment vol-umes are made up of nematode biomass means that nema-todes should always be extracted from the sediments first (Creer et al. 2010). Moreover, as stated by Peham et al. (2017), direct extraction kits can handle only a fraction of the recommended volumes of soil needed for analysis of nematode communities at the moment. In an ideal situa-tion where a complete reference database of 28S rDNA is available, the D3Af-D3Br may be equally suitable alone or in combination with any of the 18S-based markers. In fact, claims have been made that suggest that the D2-D3 segment may provide a better barcoding marker than the 18S rDNA (Creer et al. 2010). For the COI region, unless the approach involves a cocktail of primers covering the diversity of the entire phylum as suggested by Prosser et al. (2013), the COI markers will continue to be of very little use in nematode metabarcoding. The ‘primer cock-tail’ approach has not been tested on soil nematodes, and even if it worked, there is still the issue of very limited nematode reference sequences in public databases.
This study demonstrates how far a well curated nema-tode sequence database can go to facilitate the taxonomy assignment step of the analyses. A dedicated nematode database that is well curated by taxonomy experts will be helpful in eliminating the necessity for any further cross-check of uclust or utax-based taxonomy assignments. As stated earlier, the main rDNA reference databases, PR2
and SILVA, have a number of entries with incomplete taxonomies and thus make it a necessity for the assign-ments be checked. This process can be time consum-ing especially if there is a large number of OTUs to be checked. This may require collaborative work between nematode taxonomists and molecular biologists.
Finally, when making recommendations for appraisal and adoption of new barcode marker(s) other than the ones known and used so far, an important consideration that al-ways has to be made is the availability of a comprehensive reference database. It will take a tremendous amount of work to develop new reference databases as comprehensive as that which exists now for the 18S or 28S rDNA region.
Acknowledgements
The authors wish to thank the European Phytosanitary Research Coordination (EUPHRESCO) for funding this research. We would also like to thank Erin Lewis and Ummey Hany for helping with the sequencing and Ra-chel Glover for providing advice on the bioinformatics.
References
Ahmed M, van de Vossenberg BTLH, Cornelisse C, Karssen G (2013) On the species status of the root-knot nematode Meloidogyne ulmi Palmisano & Ambrogioni, 2000 (Nematoda, Meloidogynidae). Zoo-Keys, 1–27. https://doi.org/10.3897/zookeys.362.6352
Amend AS, Seifert KA, Bruns TD (2010) Quantifying microbial com-munities with 454 pyrosequencing: does read abundance count? Molecular ecology 19: 5555–5565. https://doi.org/10.1111/j.1365-294X.2010.04898.x
Anderson TJC, Blouin MS, Beech RN (1998) Population biology of par-asitic nematodes: applications of genetic markers. Advances in parasi-tology 41: 219–283. https://doi.org/10.1016/S0065-308X(08)60425-X
Benson DA, Cavanaugh M, Clark K, Karsch-Mizrachi I, Ostell J, Pruitt KD, Sayers EW (2018) GenBank. Nucleic acids research 46: D41– D47. https://doi.org/10.1093/nar/gkx1094
Bik HM, Sung WAY, De Ley P, Baldwin JG, Sharma J, Rocha‐Oliva-res A, Thomas WK (2012) Metagenetic community analysis of mi-crobial eukaryotes illuminates biogeographic patterns in deep‐sea and shallow water sediments. Molecular Ecology 21: 1048–1059.
https://doi.org/10.1111/j.1365-294X.2011.05297.x
Blaxter ML, De Ley P, Garey JR, Liu LX (1998) A molecular evolu-tionary framework for the phylum Nematoda. Nature 392: 71–75.
https://doi.org/10.1038/32160
Blouin MS, Yowell CA, Courtney CH, Dame JB (1995) Host movement and the genetic structure of populations of parasitic nematodes. Ge-netics 141: 1007–1014.
Blouin MS, Yowell CA, Courtney CH, Dame JB (1998) Substitution bias, rapid saturation, and the use of mtDNA for nematode systemat-ics. Molecular biology and evolution 15: 1719–1727. https://doi. org/10.1093/oxfordjournals.molbev.a025898
Bongers T (1990) The maturity index: an ecological measure of en-vironmental disturbance based on nematode species composition. Oecologia 83: 14–19. https://doi.org/10.1007/BF00324627
Bowles J, Blair D, McManus DP (1992) Genetic variants within the genus Echinococcus identified by mitochondrial DNA sequencing. Molecular and biochemical parasitology 54: 165–173. https://doi. org/10.1016/0166-6851(92)90109-W
Camacho C, Coulouris G, Avagyan V, Ma N, Papadopoulos J, Bealer K, Madden TL (2009) BLAST+: architecture and applications. BMC bioinformatics 10: 421. https://doi.org/10.1186/1471-2105-10-421
Caporaso JG, Kuczynski J, Stombaugh J, Bittinger K, Bushman FD, Costello EK, Fierer N, Peña AG, Goodrich JK, Gordon JI, Huttley GA, Kelley ST, Knights D, Koenig JE, Ley RE, Lozupone CA, McDonald D, Muegge BD, Pirrung M, Reeder J, Sevinsky JR, Turnbaugh PJ, Walters WA, Widmann J, Yatsunenko T, Zaneveld J, Knight R (2010) QIIME allows analysis of high-throughput com-munity sequencing data. Nature methods 7: 335–336. https://doi. org/10.1038/nmeth.f.303
Cole JR, Wang Q, Fish JA, Chai B, McGarrell DM, Sun Y, Brown CT, Porras-Alfaro A, Kuske CR, Tiedje JM (2014) Ribosomal Database Project: Data and tools for high throughput rRNA analysis. Nucleic Acids Research 42: D633–D642. https://doi.org/10.1093/nar/gkt1244
Creer S, Fonseca VG, Porazinska DL, Giblin-Davis RM, Sung W, Power DM, Packer M, Carvalho GR, Blaxter ML, Lambshead PJD, Thomas WK (2010) Ultrasequencing of the meiofaunal biosphere: Practice, pitfalls and promises. Molecular Ecology 19: 4–20. https:// doi.org/10.1111/j.1365-294X.2009.04473.x
Deagle BE, Jarman SN, Coissac E, Pompanon F, Taberlet P (2014) DNA metabarcoding and the cytochrome c oxidase subunit I mark-er: not a perfect match. Biology letters 10: 20140562. https://doi. org/10.1098/rsbl.2014.0562
Derycke S, Vanaverbeke J, Rigaux A, Backeljau T, Moens T (2010) Ex-ploring the use of cytochrome oxidase c subunit 1 (COI) for DNA barcoding of free-living marine nematodes. PLoS One 5: e13716.
https://doi.org/10.1371/journal.pone.0013716
Douda O, Marek M, Zouhar M, Ryšánek P (2013) Insights into the structure and phylogeny of the 28S rRNA expansion segments D2 and D3 of the plant-infecting nematodes from the genus Ditylenchus (Nematoda: Anguinidae). Phytopathologia Mediterranea: 84–97. Edgar RC (2004) MUSCLE: multiple sequence alignment with high
accuracy and high throughput. Nucleic Acids Res 32: 1792–1797.
https://doi.org/10.1093/nar/gkh340
Edgar RC (2010) Search and clustering orders of magnitude faster than BLAST. Bioinformatics 26: 2460–2461. https://doi.org/10.1093/ bioinformatics/btq461
Edgar RC (2013) UPARSE: highly accurate OTU sequences from microbial amplicon reads. Nature Methods 10: 996–8. https://doi. org/10.1038/nmeth.2604
Edgar RC (2017) UNBIAS: An attempt to correct abundance bias in 16S sequencing, with limited success. bioRxiv: 124149. https://doi. org/10.1101/124149
Edgar RC, Flyvbjerg H (2015) Error filtering, pair assembly and error correction for next-generation sequencing reads. Bioinformatics 31: 3476–3482. https://doi.org/10.1093/bioinformatics/btv401
Elbrecht V, Leese F (2017) Validation and Development of COI Me-tabarcoding Primers for Freshwater Macroinvertebrate Bioas-sessment . Frontiers in Environmental Science 5: 11. https://doi. org/10.3389/fenvs.2017.00038
Elder J, Turner B (1995) 70 The Quarterly review of biology Elder Jr JF, Turner BJ. Concerted evolution of repetitive DNA sequences in eu-karyotes. Q Rev Biol 70: 297–320. https://doi.org/10.1086/419073
Ellis RE, Sulston JE, Coulson AR (1986) The rDNA of C. elegans: se-quence and structure. Nucleic acids research 14: 2345–2364. https:// doi.org/10.1093/nar/14.5.2345
Ferris H, Bongers T, De Goede RGM (2001) A framework for soil food web diagnostics: extension of the nematode faunal analysis concept. Applied Soil Ecology 18: 13–29. https://doi.org/10.1016/S0929-1393(01)00152-4
Floyd R, Abebe E, Papert A, Blaxter M (2002) Molecular barcodes for soil nematode identification. Molecular Ecology 11: 839–850.
https://doi.org/10.1046/j.1365-294X.2002.01485.x
Folmer O, Black M, Hoeh W, Lutz R, Vrijenhoek R (1994) DNA primers for amplification of mitochondrial cytochrome c oxidase subunit I from diverse metazoan invertebrates. Molecular Marine Biology and Bio-technology 3: 294–299. https://doi.org/10.1371/journal.pone.0013102
Fonseca VG, Carvalho GR, Nichols B, Quince C, Johnson HF, Neill SP, Lambshead JD, Thomas WK, Power DM, Creer S (2014) Meta-genetic analysis of patterns of distribution and diversity of marine meiobenthic eukaryotes. Global Ecology and Biogeography 23: 1293–1302. https://doi.org/10.1111/geb.12223
Fonseca VG, Carvalho GR, Sung W, Johnson HF, Power DM, Neill SP, Packer M, Blaxter ML, Lambshead PJD, Thomas WK, Creer S (2010) Second-generation environmental sequencing unmasks ma-rine metazoan biodiversity. Nature communications 1: 1–8. https:// doi.org/10.1038/ncomms1095
Giblin-Davis RM, Ye W, Kanzaki N, Williams D, Morris K, Thom-as WK (2006) Stomatal ultrThom-astructure, molecular phylogeny, and description of Parasitodiplogaster laevigata n. sp.(Nematoda: Diplogastridae), a parasite of fig wasps. Journal of nematology 38: 137–149.
Guillou L, Bachar D, Audic S, Bass D, Berney C, Bittner L, Boutte C, Burgaud G, De Vargas C, Decelle J, Del Campo J, Dolan JR, Dun-thorn M, Edvardsen B, Holzmann M, Kooistra WHCF, Lara E, Le Bescot N, Logares R, Mahé F, Massana R, Montresor M, Morard R, Not F, Pawlowski J, Probert I, Sauvadet AL, Siano R, Stoeck T, Vaulot D, Zimmermann P, Christen R (2012) The Protist Ribosomal Reference database (PR2): a catalog of unicellular eukaryote small
sub-unit rRNA sequences with curated taxonomy. Nucleic acids re-search 41: D597–D604. https://doi.org/10.1093/nar/gks1160
Gutiérrez-Gutiérrez C, Cantalapiedra-Navarrete C, Montes-Borrego M, Palomares-Rius JE, Castillo P (2013) Molecular phylogeny of the nematode genus Longidorus (Nematoda: Longidoridae) with de-scription of three new species. Zoological Journal of the Linnean Society 167: 473–500. https://doi.org/10.1111/zoj.12019
Hajibabaei M, Singer GAC, Hebert PDN, Hickey DA (2007) DNA bar-coding: how it complements taxonomy, molecular phylogenetics and population genetics. Trends in Genetics 23: 167–172. https:// doi.org/10.1016/j.tig.2007.02.001
Hall TA (1999) BioEdit: a user-friendly biological sequence alignment editor and analysis program for Windows 95/98/NT. Nucleic Acids Symposium series 41: 95–98.
Hebert PDN, Cywinska A, Ball SL, DeWaard JR (2003) Biological identifications through DNA barcodes. Proc Roy Soc Lond B Biol Sci 270: 313–321. https://doi.org/10.1098/rspb.2002.2218
Hebert PDN, Stoeckle MY, Zemlak TS, Francis CM (2004) Identifica-tion of birds through DNA barcodes. PLoS Biology 2: e312. https:// doi.org/10.1371/journal.pbio.0020312
Hebert PDN, Ratnasingham S, Zakharov EV, Telfer AC, Levesque-Beaudin V, Milton MA, Pedersen S, Jannetta P (2016) Counting