Development and dissemination strategies for accelerating biogas production in Nigeria
31
0
0
Full text
(2) PEER-REVIEWED REVIEW ARTICLE. bioresources.com. following the recent halt in the importation of Nigerian crude oil by the United States of America due to the shale oil revolution, the Nigerian minister of petroleum had urged the country to adopt sustainable economic policies, as a matter of urgency, for fear of impending economic stress that the development might have in the future (TheScoopNG 2014). Although the usage of fossil fuels products has contributed immensely to the global economic growth and development, the negative effects of its application in the area of health and environment are gradually overshadowing the economic benefits, coupled with the facts that fossil fuels are finite in supply and consequently the prices of their products are vulnerable to frequent increase. The frequent increase in the price of fossil fuel products has brought untold hardship to people in developing countries, not the least in Nigeria. Because of the increase in poverty, most people who could not afford the expensive fossil fuel products have resorted to the environmentally unfriendly practice of felling wood for cooking, causing dwindling forest reserves. Besides the challenge of electricity shortage, Nigeria also faces the problem of an inefficient management system of wastes, including agricultural, municipal solid waste (MSW), and sewage, among others. The wastes are generated daily in large quantities but are disposed in unhygienic and unsustainable ways such as burning, unsanitary land filling, or indiscriminate dumping of waste on the streets and drains. Landfilling, for example, has the potential of causing further water and air pollution through leachate and gases, which are the two main products generated from a landfill. An inefficient waste management system due to lack of technical expertise, regulatory setup, and adequate funds, has contributed to various environmental challenges currently being experienced in Nigeria. Consequently, environmental pollution, flooding, and disease epidemics from indiscriminate waste dumping on the streets and drains are common occurrences in the country (Amori et al. 2013; Leton and Omotosho 2004). Nigeria has an estimated population of over 165 million people and an annual growth rate of about 2.8% (Factbook 2014; FAOSTAT 2014; Shaaban and Petinrin 2014). The country has a total area of 924,000 km2, out of which 33.0 % is arable land replanted after each harvest, while 3.1% is cultivated with permanent crops. The tropical climatic conditions in the country, which are characterized by high humidity in the south and high temperatures in the north with an average temperature of 27 °C, encourage large-scale agriculture. Because of the high population, huge amounts of waste are inevitably produced daily without an effective waste management system, and moreover more energy is required to satisfy the increasing energy demand. Meanwhile, the abundant waste generated daily can be utilized as energy resources for provision of adequate energy for the citizenry by the adoption of biogas technology. The technology offers numerous benefits, including provision of energy for cooking, heating, lighting, and as a vehicle fuel, job creation, income revenue generation, reduction of workload or drudgery for women, agricultural development, and air pollution reduction (Nyns 1986). Besides, the country also needs an effective waste management system to manage the huge amount of waste being generated daily in Nigeria. Application of biogas technology has the potential of maintaining a balance between production and consumption of waste and energy, since the technology is based on conversion of organic waste materials into energy in form of biogas. The warm climatic conditions are adequate. Akinbomi et al. (2014). “Nigerian biogas technology,”. BioResources 9(3), Pg #s to be added. 2.
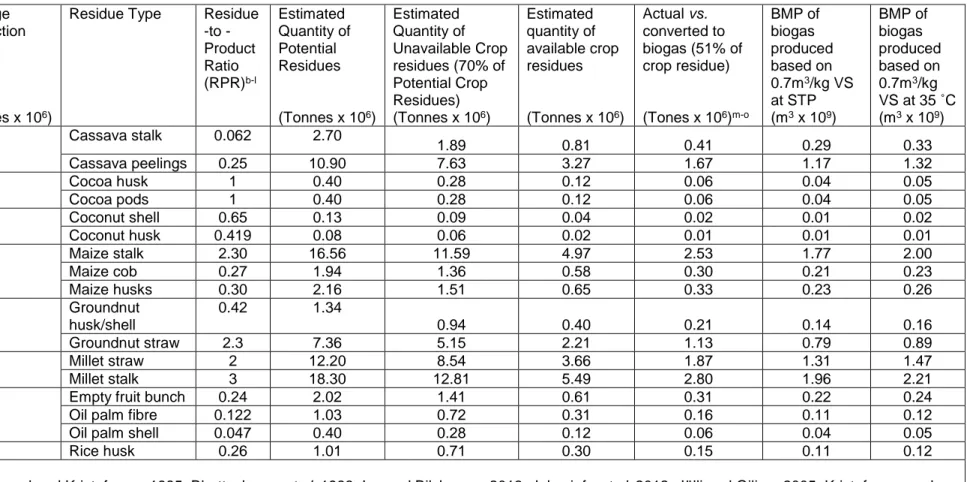
(3) PEER-REVIEWED REVIEW ARTICLE. bioresources.com. for anaerobic digestion process of organic wastes without the need for extra heating. Channeling wastes into biogas production could therefore be one of the most efficient ways of waste disposal, energy production, and environmental protection. The news from Nigerian Finance Minister, on April 2014, that Nigeria is currently Africa’s largest economy and 26th largest in the World, comes with mixed feelings for many Nigerians. The positive aspect of the news is that the growth of the economy has placed Nigeria within reach of its vision 20:2020 to become one of the world’s top 20 economies by the year 2020. And this will definitely increase investment opportunities in the country. The negative aspect of the news is that the growth impact has not benefitted poorer members of society, as 60% of the population does not have access to energy and as such many people have become impoverished. Previous efforts by the government in finding solutions to the problems by citizenship sensitization of the need to introduce biofuel energy into the country’s energy mix have not yielded the expected results because of lack of sustained government effort. Little attention has been paid to the development of biogas technology in Nigeria, with only few units of biogas pilot plants developed by different research centres (Sambo 2005). The development and application of biogas technology have been hampered by a number of factors including storage difficulty of biomass residues, technical barriers, poor financial support from the government, and low levels of public awareness of the benefits of using biogas as an energy source. This study therefore aims at examining current biogas production potentials of Nigerian biomass resources, and proposing strategies for an accelerated biogas development in Nigeria. Potential Assessment of Nigerian Biomass Feedstock for Biogas Production Biogas is a colourless and odourless mixture of gases produced through anaerobic decomposition of organic materials by microorganisms, and depending on the nature of the organic materials and operating conditions, the gas composition includes methane, carbon dioxide, nitrogen, oxygen, hydrogen sulphide, and ammonia with compositions of 40-75%, 25-40, 0.5-2.5%, 0.1-1% 0.1-0.5%, and 0.1-0.5%, respectively (Salomon and Lora 2009; Weiland 2010). Biogas can be used to augment conventional energy sources for various purposes including cooking, heating, vehicle fuel, and electricity generation, while the sludge from the anaerobic process can be used as organic fertilizer. Potential biogas feedstocks that are available in Nigeria include agricultural crop and residues, livestock wastes, municipal solid wastes and sewage. Biogas production from agricultural crop wastes Agricultural crop wastes are potential sources of biogas energy, especially in Nigerian rural areas where nearly everyone practices farming. Nigeria produces a wide range of agricultural crops in large quantities for consumption and exportation, and consequently huge amount of residues are generated from the crops. Agricultural crop wastes may consist of rotten crops due to inadequate storage facilities. There are infected crops due to diseases and also residues produced from crop processing after harvest. Table 1 shows the average quantity of agricultural crop wastes from the production between year 2003 and 2012 in Nigeria.. Akinbomi et al. (2014). “Nigerian biogas technology,”. BioResources 9(3), Pg #s to be added. 3.
(4) bioresources.com. PEER-REVIEWED REVIEW ARTICLE. Table 1. Biochemical Methane Potential (BMP) of Biogas from Average Crop Production between Year 2003 and 2012 in Nigeria a Agricultural Crops. Average Production. Cassava. (Tonnes x 106) 43.6. Cocoa beans Coconut. 0.4. Maize. 7.2. Groundnut with shell. 3.2. 0.2. Millet. 6.1. Oil palm fruit. 8.4. Residue Type. Residue -to Product Ratio (RPR)b-l. Estimated Quantity of Potential Residues. Cassava stalk. 0.062. (Tonnes x 106) 2.70. Cassava peelings Cocoa husk Cocoa pods Coconut shell Coconut husk Maize stalk Maize cob Maize husks Groundnut husk/shell Groundnut straw Millet straw Millet stalk Empty fruit bunch Oil palm fibre Oil palm shell Rice husk. 0.25 1 1 0.65 0.419 2.30 0.27 0.30 0.42. 10.90 0.40 0.40 0.13 0.08 16.56 1.94 2.16 1.34. 2.3 2 3 0.24 0.122 0.047 0.26. 7.36 12.20 18.30 2.02 1.03 0.40 1.01. Estimated Quantity of Unavailable Crop residues (70% of Potential Crop Residues) (Tonnes x 106). Estimated quantity of available crop residues. Actual vs. converted to biogas (51% of crop residue). (Tonnes x 106). 1.89 7.63 0.28 0.28 0.09 0.06 11.59 1.36 1.51 0.94 5.15 8.54 12.81 1.41 0.72 0.28 0.71. (Tones x 106)m-o. BMP of biogas produced based on 0.7m3/kg VS at STP (m3 x 109). BMP of biogas produced based on 0.7m3/kg VS at 35 ˚C (m3 x 109). 0.81 3.27 0.12 0.12 0.04 0.02 4.97 0.58 0.65. 0.41 1.67 0.06 0.06 0.02 0.01 2.53 0.30 0.33. 0.29 1.17 0.04 0.04 0.01 0.01 1.77 0.21 0.23. 0.33 1.32 0.05 0.05 0.02 0.01 2.00 0.23 0.26. 0.40 2.21 3.66 5.49 0.61 0.31 0.12 0.30. 0.21 1.13 1.87 2.80 0.31 0.16 0.06 0.15. 0.14 0.79 1.31 1.96 0.22 0.11 0.04 0.11. 0.16 0.89 1.47 2.21 0.24 0.12 0.05 0.12. Rice, paddy 3.9 a FAOSTAT, 2014; b-l AIT-EEC 1983; Bernard and Kristoferson 1985; Bhattacharya et al. 1993; Iye and Bilsborrow 2013; Jekayinfa et al. 2012; Jölli and Giljum 2005; Kristoferson and Bokhalders 1991; Ryan and Openshaw, 1991; Smeets et al., 2004; Webb, 1979a; Webb, 1979b m-o(Burke 2001; Deublein and Steinhauser 2008; Parkin and Owen 1986). Akinbomi et al. (2014). “Nigerian biogas technology,”. BioResources 9(3), Pg #s to be added. 4.
(5) bioresources.com. PEER-REVIEWED REVIEW ARTICLE. Table 1. (cont’d). Biochemical Methane Potential (BMP) of Biogas from Average Crop Production between 2003 and 2012 in Nigeria a Agricultural Crops. Average Production (Tonnes x 106. Potatoes. 0.9. Sorghum. 8.0. Sugarcane. 1.2. Soybeans. 0.5. Sweet potatoes Cocoyam. 3.2. Tobacco. 0.02. Tomatoes. 1.7. 4.3. Residue Type. Potatoes stem and leaves Sorghum straw Sorghum stalk Sugar cane bagasse Sugar cane straw Soybeans straw and pods Sweet potatoes residues Cocoyam residues Tobacco stem/stalks Tomato stem Tomato leaves Vegetable residues residues. Residueto Product Ratio (RPR) b-l. 0.4. Estimated Quantity of Potential Residues (Tones x 106) 0.36. 2 2.62 0.3. 16.00 20.96 0.36. 1.5 3.5. 1.80 1.75. 0.36. 1.15. 0.36. 1.55. 2.0. 0.04. 0.3 0.3 0.45. 0.51 0.51 2.43. Estimated Quantity of Unavailable Crop Residues (70% Of Potential Crop Residues) (Tones X 106). Estimated Quantity of Available Crop Residues. Actual vs. Converted to Biogas (51% of Crop Residue). (Tones x 106). (Tones x 106)m-o. BMP of Biogas Produced Based on 0.7m3/KgVs At STP (m3 x 109). BMP of Biogas Produced Based on 0.7m3/kgVS at 350C (m3 x 109). 0.25 11.20 14.67. 0.11 4.80 6.29. 0.06 2.45 3.21. 0.04 1.71 2.24. 0.04 1.93 2.53. 0.25 1.26. 0.11 0.54. 0.06 0.28. 0.04 0.19. 0.04 0.22. 1.23. 0.53. 0.27. 0.19. 0.21. 0.81. 0.35. 0.18. 0.12. 0.14. 1.09. 0.47. 0.24. 0.17. 0.19. 0.03 0.36 0.36. 0.01 0.15 0.15. 0.01 0.08 0.08. 0.0043 0.05 0.05. 0.0048 0.06 0.06. Fresh 5.4 vegetables 1.70 0.73 0.37 0.26 Mangoes, 0.8 1.8 1.44 mangosteens 1.01 0.43 0.22 0.15 Melon seed 0.5 residues 1.26 0.63 0.44 0.19 0.10 0.07 Ginger 0.2 Ginger residue 1.15 0.23 0.16 0.07 0.04 0.02 a FAOSTAT, 2014; b-l AIT-EEC 1983; Bernard and Kristoferson 1985; Bhattacharya et al. 1993; Iye and Bilsborrow 2013; Jekayinfa et al. 2012; Jölli and Giljum, 2005; Kristoferson and Bokhalders 1991; Ryan and Openshaw 1991; Smeets et al., 2004; Webb 1979a; Webb 1979b m-o(Burke 2001; Deublein and Steinhauser 2008; Parkin and Owen 1986). Akinbomi et al. (2014). “Nigerian biogas technology,”. BioResources 9(3), Pg #s to be added. 5. 0.29 0.17 0.08 0.03.
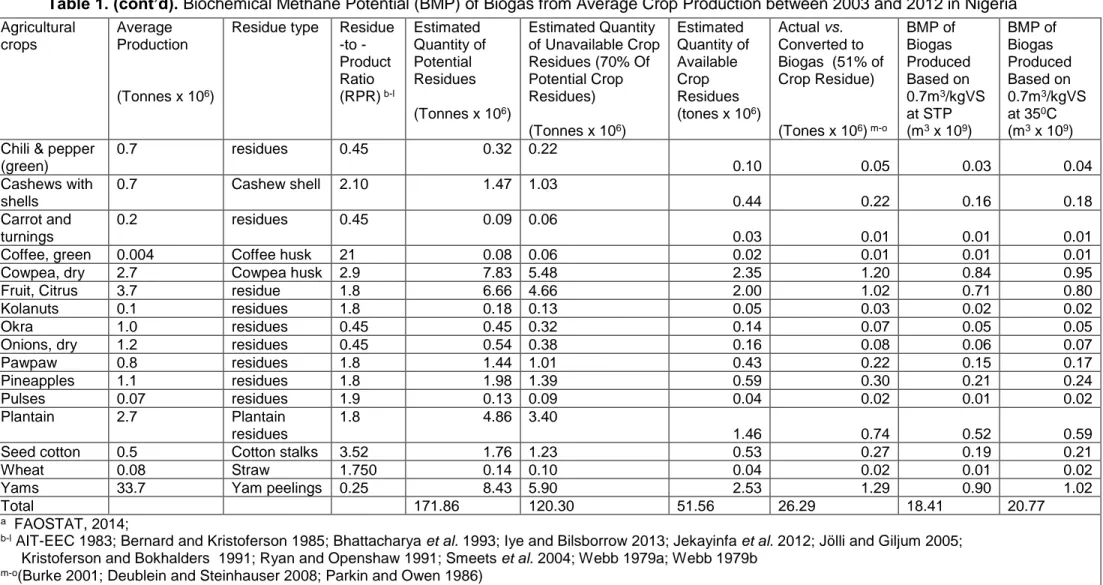
(6) bioresources.com. PEER-REVIEWED REVIEW ARTICLE. Table 1. (cont’d). Biochemical Methane Potential (BMP) of Biogas from Average Crop Production between 2003 and 2012 in Nigeria Agricultural crops. Average Production. Residue type. (Tonnes x 106). Residue -to Product Ratio (RPR) b-l. Estimated Quantity of Potential Residues. Estimated Quantity of Unavailable Crop Residues (70% Of Potential Crop Residues). (Tonnes x 106) Chili & pepper (green) Cashews with shells Carrot and turnings Coffee, green Cowpea, dry Fruit, Citrus Kolanuts Okra Onions, dry Pawpaw Pineapples Pulses Plantain. 0.7. residues. 0.45. 0.32. (Tonnes x 106) 0.22. 0.7. Cashew shell. 2.10. 1.47. 1.03. 0.2. residues. 0.45. 0.09. 0.06. 0.004 2.7 3.7 0.1 1.0 1.2 0.8 1.1 0.07 2.7. Coffee husk Cowpea husk residue residues residues residues residues residues residues Plantain residues Cotton stalks Straw Yam peelings. 21 2.9 1.8 1.8 0.45 0.45 1.8 1.8 1.9 1.8. 0.08 7.83 6.66 0.18 0.45 0.54 1.44 1.98 0.13 4.86. 0.06 5.48 4.66 0.13 0.32 0.38 1.01 1.39 0.09 3.40. Estimated Quantity of Available Crop Residues (tones x 106). Actual vs. Converted to Biogas (51% of Crop Residue) (Tones x 106) m-o. BMP of Biogas Produced Based on 0.7m3/kgVS at STP (m3 x 109). BMP of Biogas Produced Based on 0.7m3/kgVS at 350C (m3 x 109). 0.10. 0.05. 0.03. 0.04. 0.44. 0.22. 0.16. 0.18. 0.03 0.02 2.35 2.00 0.05 0.14 0.16 0.43 0.59 0.04. 0.01 0.01 1.20 1.02 0.03 0.07 0.08 0.22 0.30 0.02. 0.01 0.01 0.84 0.71 0.02 0.05 0.06 0.15 0.21 0.01. 0.01 0.01 0.95 0.80 0.02 0.05 0.07 0.17 0.24 0.02. 1.46 0.74 0.52 Seed cotton 0.5 3.52 1.76 1.23 0.53 0.27 0.19 Wheat 0.08 1.750 0.14 0.10 0.04 0.02 0.01 Yams 33.7 0.25 8.43 5.90 2.53 1.29 0.90 Total 171.86 120.30 51.56 26.29 18.41 a FAOSTAT, 2014; b-l AIT-EEC 1983; Bernard and Kristoferson 1985; Bhattacharya et al. 1993; Iye and Bilsborrow 2013; Jekayinfa et al. 2012; Jölli and Giljum 2005; Kristoferson and Bokhalders 1991; Ryan and Openshaw 1991; Smeets et al. 2004; Webb 1979a; Webb 1979b m-o(Burke 2001; Deublein and Steinhauser 2008; Parkin and Owen 1986). 0.59 0.21 0.02 1.02. Akinbomi et al. (2014). “Nigerian biogas technology,”. BioResources 9(3), Pg #s to be added. 6. 20.77.
(7) PEER-REVIEWED REVIEW ARTICLE. bioresources.com. The method used for calculating the average quantity of crop wastes is based on a residue-to-product ratio (RPR) method in which the RPR for different crops are used to multiply annual production of each crop. The RPR ratio, which represents the amount of residues that could be obtained from a unit amount of crop harvested, were selected from different literature sources, since each source covered only some of the crops studied. Meanwhile, the available quantities of residues using the RPR ratios might not be the actual values in practice due to climatic variations coupled with the facts that different studies indicated varying RPR’s for the same crop; the quantity obtained could still be used as the best guide for policy makers to get a picture of the amount of residues that could be generated from each crop, since the RPR ratios made provisions for variations in crop, variety, climate and different farming activities. VS ratios were taken from literature sources different from those that the RPR ratios were taken from because information on VS ratios was not given in the literature containing RPRs ratios. Biochemical methane potential (BMP) was calculated based on the assumption that the waste could be taken as primary solids, and that a cubic metre of BMP could be obtained from one kg VS of the primary solids as given in Khanal (2008). The average quantity of crop residues obtained annually from the harvesting and processing of the agricultural crops was estimated to 172 million tonnes. Meanwhile, about 70% of the residues generated during crop harvesting and processing are often used for other purposes such as soil mulch, fuel, building materials, and animal fodder (Dayo 2007; Jibrin et al. 2013). As regards animal fodder, the most commonly fed crop residues include cassava and yam peels, cowpea husk, and groundnut husks, brans, oilcakes, maize, millet, and sorghum stovers (DE-Leew 1997; Onwuka et al. 1997; Singh et al. 2011). Leguminous crop residues are often preferred to cereal residues as animal fodder because of their higher nutritive value, digestibility, crude protein content, and minerals (Owen 1994). The quantity of crop residues available for biogas production could therefore be reduced. In fact, it has been observed that during the rainy season, agricultural crop residues supply 58% of animal fodder (Jibrin et al. 2013). Taking the crop residues used for other purposes into consideration, the quantity of available crop residues for biogas production was estimated at approximately 52 million tonnes, from which 21 billion cubic metres of methane gas could be generated at 35 oC (Table 1). Biogas production from livestock waste: livestock manure and abattoir waste Livestock waste includes dead livestock due to diseases, livestock manure, slaughterhouse wastes such as hair, feather, bones, blood, undigested food, and meat from animal and poultry processing industries. Among the livestock reared in Nigeria, only cattle, goats, sheep, pigs, and chicken are produced in large quantities, as shown in Table 2a. The amount of animal dung that could be obtained from the average annual population of the livestock was estimated to be approximately 32 million tonnes, from which 3.7 billion cubic metres of methane gas could be produced. However, the available animal manure for biogas production may in reality be lower, since the considerable amounts of animal dung is often left on the grazing field to improve the soil quality. Regarding abattoir waste, a huge amount is usually generated daily in Nigeria because of high consumption of meat by people. Often these wastes are not treated before being discharged into nearby streams and rivers, thereby constituting an environmental and health hazard to the people living in the neighbourhood. Compositions of abattoir wastes generally include animal blood, intestinal content, waste tissue, and bone. From Akinbomi et al. (2014). “Nigerian biogas technology,”. BioResources 9(3), Pg #s to be added. 7.
(8) PEER-REVIEWED REVIEW ARTICLE. bioresources.com. the common reared livestock in Nigeria, an estimated amount of 0.83 million tonnes (Table 2b) abattoir waste could be generated annually, which could be harnessed using biogas technology to produce about 0.34 billion cubic metres of methane gas. Biogas production from municipal solid waste (MSW) The quantity and composition of MSW generated in any particular region depends most importantly on factors such as people’s lifestyles, standard of living, consumption patterns, local climate, as well as cultural and educational differences. The waste generation rate in low-income countries (developing countries) has been found to be within the range of 0.4 to 0.6 kg/person/day (Blight and Mbande 1996; Chandrappa and Das 2012; Cointrea 1982). This is similar to the waste generated rate of 0.44 to 0.66 kg/capita/day generated in some urban region in Nigeria (Ogwueleka 2009). The moisture and organic content of the waste generated in developing countries are reportedly reasonably high, which makes them to be suitable for anaerobic digestion (Babayemi and Dauda 2009). In this study, the average waste generated rate of 0.62 kg/capita/day was used as a representative value for each person in Nigeria. To estimate the average quantity of MSW generated in Nigeria, the average waste generated rate of the six Nigerian Geo-Political zones including North-central, North-East, North-West, South-East, South-West, SouthSouth was obtained from their six respective cities namely, Abuja (0.66 kg/capita/day), Bauchi (0.86), Kano (0.56), Aba (0.40), Lagos (0.63), and Port-Harcourt (0.6) (all kg/capita/day) (Adewunmi et al. 2005; Babayemi and Dauda 2009; Ogwueleka 2009; Usman and Mohammed 2012). An estimated value of 37 million tonnes organic MSW residues could be available for biogas production with BMP of 13 billion cubic metres (Table 3). Biogas production from human wastes Human waste, often called black water, consists of faeces and urine and forms part of sewage generated from a community. The other part of the sewage is called grey water, which represents wastewater from all sources including bathroom, kitchen, and laundry without human wastes (Katukiza et al. 2012; Uwidia and Ademoroti 2011). Unlike human wastes, grey water is often highly contaminated with different substances including domestic wastes such as soaps/detergents, shampoo, pharmaceuticals, and industrial wastes, which make them unsuitable as feedstock for biogas production without adequate pre-treatment, as they may cause failure of biogas digesters. Within Nigerian urban communities, pit latrines are common in low-income households (Chaggu et al. 2002; Howard et al. 2003; Kulabako et al. 2010; WHO and UNICEF 2010), while water closet toilets are common in middle and high-income households. In Nigerian rural communities, soil pit and open defection are still the common forms of human waste disposal, since many rural dwellers do not have any form of toilets (Esrey et al. 1998). Pit latrines and water closet toilets are usually connected to septic tanks, which collect and transports human wastes into a soak away pit. However, most septic and soakaway systems in Nigeria are not properly designed, located, operated, and maintained with consequent pollution of soil, surface water, and groundwater. Lack of good sanitation systems for disposing human wastes have been a major concern to many Nigerians and often facilitate the spread of diseases among people. Therefore, proper treatment of human waste before disposal is required, and this could be best achieved by anaerobic digestion. Akinbomi et al. (2014). “Nigerian biogas technology,”. BioResources 9(3), Pg #s to be added. 8.
(9) bioresources.com. PEER-REVIEWED REVIEW ARTICLE. Table 2a. Methane Potential of Biogas from Average Livestock Population & Manure Production in Nigeria (2003 to 2012) Livestock. Stocks (Heads ). Cattle 16,571,801 Pigs 6,792,244 Goats 53,027,703 Sheep 34,030,382 Chicken 171,331,000 Total p (World-Bank 1977). Annual Dry Dung from Each Animal (Tonnes)p 1.0 0.3 0.15 0.15 0.005. Total Annual Animal Dung (Tonnesx106). Total Annual Animal Dung (kg x 109). 16.60 2.04 8.00 5.11 0.90. 16.60 2.04 8.00 5.11 0.90 32.4. Available Animal Dung (30% of Production) (kg x 109) 4.98 0.61 2.40 1.53 0.27 9.79. Actual vs. Converted to Biogas (% of Production) 48 45 48 48 42. Actual vs. Converted to Biogas (kg X109) 2.39 0.28 1.15 0.73 0.11. BMP of Biogas Produced Based on 0.7 m3/ kgVS at STP(m3 x 109) 1.67 0.20 0.81 0.51 0.08. BMP of Biogas Produced Based on 0.7 m3/ kgVS at 350C(m3 x 109) 1.89 0.22 0.91 0.58 0.09 3.69. Table 2b. Methane Potential of Biogas from Average Annual Abattoir Wastes in Nigeria Generated (2003 to 2012) Annual Slaughtered Livestock. Average Weight of Slaughtered animal (kg) q 353 60 23 33 1.7. Amount of Waste from each slaughtered Animal (35% of Animal Body Weight) (kg) r 123.6 21.0 8.1 11.6 0.6. Annual Slaughtered Livestock Waste(kg x 109) Cattle 2,541,377 0.31 Pigs 4,752,865 0.10 Goats 21,461,956 0.11 Sheep 13,628,125 0.16 Chicken 257,127,778 0.15 Total Waste 0.83 q (Achoja, 2013; Adeshinwa et al., 2003; Akinfolarin and Okubanjo, 2010; r(World-Bank 1998). Actual vs. Converted to Biogas (% of the Manure Production) 51 51 51 51 51. Actual vs. Converted to Biogas (kg x109) 0.158 0.051 0.056 0.082 0.077. BMP of Biogas Produced Based on 0.7 m3/Kgvs at STP(m3 x 109) 0.111 0.036 0.039 0.057 0.054. BMP of Biogas Produced Based on 0.7m3/kgVS at 350C (m3 x 109) 0.125 0.040 0.044 0.065 0.061 0.335. Table 3. Biochemical Methane Potential (BMP) of Biogas from Average MSW and Human Wastes Generated in Nigeria Waste. Organic MSW Total Urine Human Feces wastes Total s(World-Bank 1992).. Waste Generated Rate (kg/capita/year)s 226.30 375.95 146.00. Population ( x106) 165 165 165. Annual Total Waste(kg x 109) 37.34 62.03 24.09 86.12. Akinbomi et al. (2014). “Nigerian biogas technology,”. Actual vs. Converted to Biogas (% of the Manure Production) 45 50.4 50.4. Actual vs. Converted to Biogas (kg x109) 16.80 31.26 12.14 43.40. BioResources 9(3), Pg #s to be added. 9. BMP of Biogas Produced Based on 0.7 m3/Kgvs at STP (m3 x 109) 11.76 21.88 8.50 30.38. BMP of Biogas Produced Based on 0.7 m3/kg vs. at 350C (m3 x 109) 13.27 24.70 9.59 34.29.
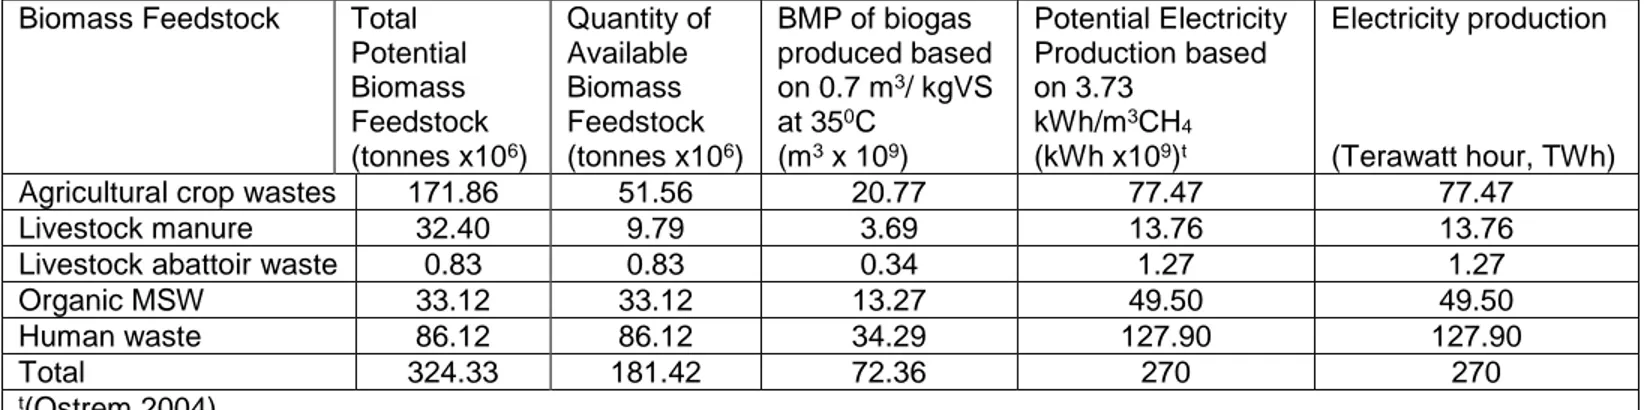
(10) bioresources.com. PEER-REVIEWED REVIEW ARTICLE. From the Nigerian population of about 165 million, it is estimated that 86 million tonnes human wastes (faeces and urine) could be obtained annually from which 128 billion cubic metres of methane gas could be produced (Table 3). Electricity Production Potential of Nigerian Biomass Feedstock Various studies have shown the existence of a strong relationship between human development and annual per capita energy consumption (Meisen and Akin 2008; NBS 2009). This indicates that the level of social development in a country is reflected in the level of electricity consumption. The potential for electricity energy generation from the biomass feedstock studied was estimated as 270 TWh for all the available biomass feedstock (Ostrem 2004), as given in Table 4. Table 4. Theoretical Electricity Generation from Available Biomass Feedstock in Nigeria Biomass Feedstock. Total Potential Biomass Feedstock (tonnes x106) Agricultural crop wastes 171.86 Livestock manure 32.40 Livestock abattoir waste 0.83 Organic MSW 33.12 Human waste 86.12 Total 324.33 t(Ostrem 2004). Quantity of Available Biomass Feedstock (tonnes x106) 51.56 9.79 0.83 33.12 86.12 181.42. BMP of biogas produced based on 0.7 m3/ kgVS at 350C (m3 x 109) 20.77 3.69 0.34 13.27 34.29 72.36. Potential Electricity Production based on 3.73 kWh/m3CH4 (kWh x109)t 77.47 13.76 1.27 49.50 127.90 270. Electricity production. (Terawatt hour, TWh) 77.47 13.76 1.27 49.50 127.90 270. When considering Nigerian energy needs, average cooking energy demand per capita per day had been estimated at 0.26 m3 of biogas (Adeoti et al. 2000), which is equivalent to 0.97 kWh of electricity per capita per day. In other words, annually, each person will need an average of 354 kWh of electricity, which could be satisfactorily obtained from the biomass feedstock studied. In fact, the estimated 270 TWh of electricity energy from all the available biomass feedstock could be used to satisfy the energy needs of about 763 million people, which are far greater than the Nigerian population. Large scale electricity generation from biogas powered generator will be a cheaper, easier, and more affordable source of cooking energy, as it will eliminate challenges including biogas storage, explosion risks, adaptability of other cooking stoves, among others, involved in using biogas cooking stoves. Biogas Energy Market in Nigeria: Current and Future The current sources of electricity in Nigeria are gas, hydropower, oil, coal with cooking, lighting, and running of electrical appliances, in line with the domestic activities that usually consume energy in most Nigerian households. A majority of people living in rural areas rely mostly on firewood, dried animal dung, crop residues, and charcoal for cooking because they could not afford the high cost of kerosene and LPG, while electricity is usually unreliable and inaccessible (IEA 2006). Even in the urban areas where electricity, LPG, and kerosene are available to many households, the usage of the energy sources for cooking depends on the household income, with people often giving Akinbomi et al. (2014). “Nigerian biogas technology,”. BioResources 9(3), Pg #s to be added. 10.
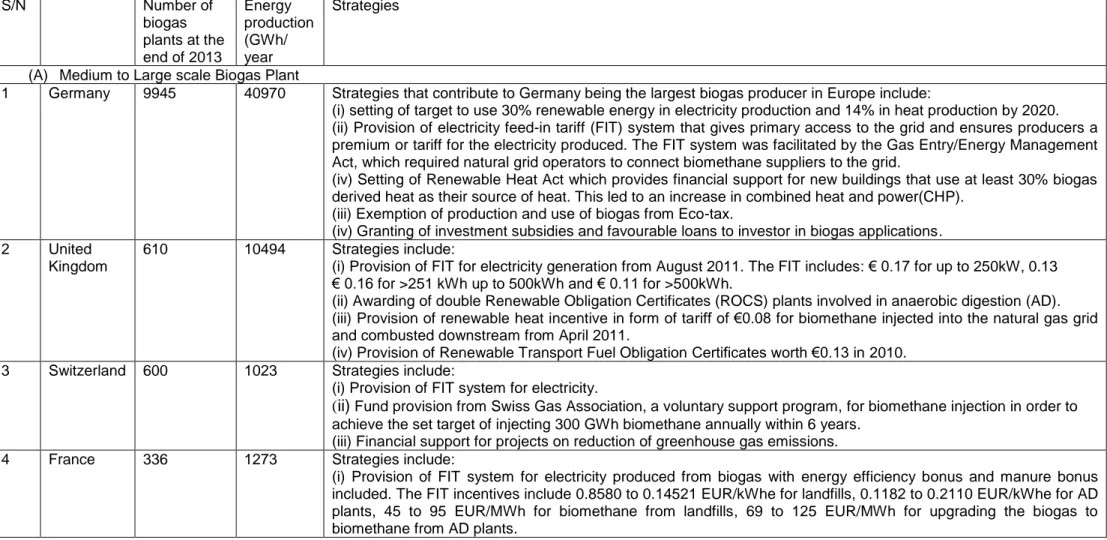
(11) PEER-REVIEWED REVIEW ARTICLE. bioresources.com. preference to low-cost energy source (Arthur et al. 2010; Davis 1998; Howells et al. 2005). Most people with little or no access to electricity rely majorly on fuel wood and charcoal (Abila 2012), while most low-income households in urban areas often prefer using charcoal to firewood because of its durability, availability, and less polluting nature (Sebokah 2009). Despite the fact that biogas technology is a proven and established technology in many parts of the World such as Germany, United Kingdom, Switzerland, France, Austria, Netherlands, Sweden, Denmark, Norway, Republic of Korea, Finland, Republic of Ireland, Brazil, China, and India (Table 5); the rate of development of biogas technology in most African countries is still at a low ebb. The rapid development of biogas technology in most European countries could be linked to various strategies employed by the respective countries, and most especially by the Renewable Energy Directive (RES) proposed by the European Union, which sets a binding target for all Members States to reach a 20% share of renewable energies in the total energy consumption by 2020. Biogas technologies in Europe, United States, and Latin America are often on a large scale with biogas produced used for various applications such as electricity generation, district heating, injection into natural gas pipelines, and as transportation fuel in buses, cars and trains. However, in Asian and some African countries, biogas technologies are on a small or household scale with the produced biogas being used for domestic purposes such as cooking and lighting, among others (Peters and Thielmann 2008; Sorda et al. 2010). In Nigeria, some biogas projects have been executed, including construction of biogas plants at Zaria prison in Kaduna, Ojokoro in Lagos, Mayflower School Ikene in Ogun State, and a biogas plant at Usman Danfodiyo University in Sokoto with capacity of the digesters ranges between 10 and 20 m3 (Abubakar 1990; Adeyanju 2008; Atuanya and Aigbirior 2002; Dangogo and Fernando 1986; Igoni et al. 2008; Ilori et al. 2007; Lawal et al. 1995; Odeyemi 1983; Ojolo et al. 2007; Sambo 2005). However, the biogas projects are yet to be commercialized, since most of them are either non-operational or still at the research stage. The failure of various pilot biogas programmes and a low level of biogas development and dissemination in Nigeria have been attributed to a number of factors including lack of policy formulation, ineffective implementation of existing biofuel policies, lack of government commitment, technical inadequacy (inaccessibility to spare parts, unskilled operators), ineffective waste management system, poor storage facility and transportation system, lack of continuity of previous biogas programme initiatives by the successive governments, inadequate structural facilities, and a low level of awareness of benefits accrued from biogas technology. The current energy situation in Nigeria shows that biogas energy is not yet part of Nigeria’s energy mix as the mix is currently dominated by fuel wood, petroleum products, and hydroelectricity. Meanwhile, all hope is not lost, as this is a common experience with the introduction of new technologies, which often require fostering for a period of time before achieving their stable implementation in terms of ample social, environmental, and economic benefits. However, lessons should be drawn from the failed biogas projects and used in the future design and operation of biogas plants. Effort must be geared towards preventing failure of biogas plants, as this can do a great damage to market penetration of the technology since prospective users or customers of the technology can lose interest in making any investment in the technology. Furthermore, strategies that are being employed in developed countries to advance biogas technology could also be adapted in Nigeria too. Akinbomi et al. (2014). “Nigerian biogas technology,”. BioResources 9(3), Pg #s to be added. 11.
(12) bioresources.com. PEER-REVIEWED REVIEW ARTICLE. Table 5. Comparison of Biogas Production Strategies in Different Countries S/N. 1. Number of Energy biogas production plants at the (GWh/ end of 2013 year (A) Medium to Large scale Biogas Plant Germany 9945 40970. 2. United Kingdom. 610. 10494. 3. Switzerland. 600. 1023. 4. France. 336. 1273. t. Strategies. Strategies that contribute to Germany being the largest biogas producer in Europe include: (i) setting of target to use 30% renewable energy in electricity production and 14% in heat production by 2020. (ii) Provision of electricity feed-in tariff (FIT) system that gives primary access to the grid and ensures producers a premium or tariff for the electricity produced. The FIT system was facilitated by the Gas Entry/Energy Management Act, which required natural grid operators to connect biomethane suppliers to the grid. (iv) Setting of Renewable Heat Act which provides financial support for new buildings that use at least 30% biogas derived heat as their source of heat. This led to an increase in combined heat and power(CHP). (iii) Exemption of production and use of biogas from Eco-tax. (iv) Granting of investment subsidies and favourable loans to investor in biogas applications. Strategies include: (i) Provision of FIT for electricity generation from August 2011. The FIT includes: € 0.17 for up to 250kW, 0.13 € 0.16 for >251 kWh up to 500kWh and € 0.11 for >500kWh. (ii) Awarding of double Renewable Obligation Certificates (ROCS) plants involved in anaerobic digestion (AD). (iii) Provision of renewable heat incentive in form of tariff of €0.08 for biomethane injected into the natural gas grid and combusted downstream from April 2011. (iv) Provision of Renewable Transport Fuel Obligation Certificates worth €0.13 in 2010. Strategies include: (i) Provision of FIT system for electricity. (ii) Fund provision from Swiss Gas Association, a voluntary support program, for biomethane injection in order to achieve the set target of injecting 300 GWh biomethane annually within 6 years. (iii) Financial support for projects on reduction of greenhouse gas emissions. Strategies include: (i) Provision of FIT system for electricity produced from biogas with energy efficiency bonus and manure bonus included. The FIT incentives include 0.8580 to 0.14521 EUR/kWhe for landfills, 0.1182 to 0.2110 EUR/kWhe for AD plants, 45 to 95 EUR/MWh for biomethane from landfills, 69 to 125 EUR/MWh for upgrading the biogas to biomethane from AD plants.. IEA Bioenergy (2014). Akinbomi et al. (2014). “Nigerian biogas technology,”. BioResources 9(3), Pg #s to be added. 12.
(13) bioresources.com. PEER-REVIEWED REVIEW ARTICLE. Table 5. (cont’d). Comparison of Biogas Production Strategies in Different Countries S/N. 5. Number of Energy biogas production plants at the (GWh/ end 2013 year (A) Medium to Large scale Biogas Plant Austria 336 585. 6 7. Netherland Sweden. 252 242. n.a 1589. 8. Denmark. 167. 1218. 9. Norway. 129. 500. 10. Republic of Korea. 78. 1925. 11. Finland. 73. 569. u. Strategies. Strategies include: (i) Provision of FIT system which is supported by Green Electricity Law. The incentives include 0.1950 EUR/kWh up to 250 kWhe, 0.1693 EUR/kWh from 250 - 500 kWhe, 0.1334 EUR/kWh from 500 - 750 kWhe, 0.1293EUR /kWh for higher than 750 kW + 0.02 EUR/kWh if biogas is upgraded + 0.02 EUR/kWh if heat is used efficiently. There is a support scheme that favours large scale biogas applications. Although Sweden has no feed-in tariff system, other support systems exist which include target setting of zero emission of greenhouse gases by 2050, provision of economic incentives including tax-free policy on emission of carbon dioxide, nitrous oxide and sulphur taxes during biogas production, green certificate system, free parking charge for biogas fueled vehicles and introduction of climate investment programme. The strategies employed include a bottom-up approach, access to investment grants, implementation of energy taxes and introduction of various financial incentives for both upgraded biogas supplied to the natural gas grid and to purified biogas entering a town gas gridu Strategies include (i) Banning of landfilling biodegradables of since 2009 which led to increase in available biogas feedstock. (ii) Provision of delivery support system that gives 3.5 EUR per ton of manure delivered to biogas plants. (iii) Provision of biogas investment aid. (iv) Tax-exemption and investment aid for infrastructure related on biogas fueled vehicles. Although there are no tariffs or subsidies for biogas, there is Renewable Portfolio Standard (RPS) system implemented since 2012 which mandates 2% of the total power generation to be supplied using the appropriate kind of renewable energy. Moreover, 10% Value Added Tax (VAT) and 2% tariffs are charged when the mixture of CNG and biogas is sold. Strategies include: (i) Establishment of Electric Market Authority to support new biogas plants, which produce more than 100 kVA, with a feed-in tariff which guarantees a minimum price of 83.50 EUR/MWh electricity and 50 EUR/MWh heat premium on top of basic subsidy if the generated heat is utilized, provided that the total efficiency is at least 50%. (ii) Financial support by the Ministry of Agriculture and Forestry for biogas plants built on farms aiming at producing their own energy and heat. (iii) Exemption of production and use of biogas from excise tax.. Raven and Gregersen (2007). Akinbomi et al. (2014). “Nigerian biogas technology,”. BioResources 9(3), Pg #s to be added. 13.
(14) bioresources.com. PEER-REVIEWED REVIEW ARTICLE. Table 5. (cont’d). Comparison of Biogas Production Strategies in Different Countries S/N. Number of Energy biogas production plants at the (GWh/ end 2013 year (A) Medium to Large scale Biogas Plant 12 Republic of 30 n.a Ireland. 13. 14 15 16 17 18 19 20 21. Brazil. 22. 697. Strategies. Strategies include: (i) Implementation of landfill levy of 75 EUR/ton of waste landfilled to discourage landfilling activities. (ii) Requirement of population centres with an excess of 25 000 persons to provide collection of source segregated food waste in order to encourage digestion of organic fraction of municipal solid waste. (iii) There is FIT system which includes 0.15 EUR/kWhe for AD CHP equal to or less than 500 kW; 0.13EUR/kWhe for AD CHP greater than 500 kW; 0.11 EUR/kWhe for AD (non CHP) equal to or less than 500 kW and 0.10 EUR/kWhe for AD (non CHP) greater than 500 kW. Strategies include: (i) Provision of credit to producers of biogas technologies. (ii) Provision of rural technical assistance to promote improvement of infrastructure associated with biogas technology.. (B) Small-scale or household digestersv Number of small Strategies scale digesters as at 2007 China 26.5 millionw,x) In most Asian countries, biogas programs developed rapidly because of significant financial and technical support provided by their governments and various aid agenciesy,z. In Nepal, the support is through various policy instruments such as India 4 million biogas support programme (BSP)aa which is technologically standardized and free from political interference. Demand for Nepal 268,464 biogas digesters was stimulated through subsidy and quality control mechanisms. When government financial support Vietnam 152,349 declined, Nepal generated financial support by developing biogas plants across the country as clean development Bangladesh 26,311 mechanism (CDM) projects, and all these strategies have contributed to Nepal’s achievement of having the highest per Cambodia 19,173 capita biogas plant in the Worldv,ab,ac. Bangladeshi government has been actively involved in the development of biogas Indonesia 7835 technology in the country. In China and India, drivers to rapid biogas development include strong government support, Pakistan 5357x technical knowledge, availability of fermentation materialsx, China’s principle of adaptability of materials of construction of biogas plants to locality contributed the rapid development of biogas technology in the country vSurendra et al. (2014); wChen et al. (2010); xBond and Templeton (2011); yKristoferson and Bokhalders (1991); zGunnerson and Stuckey (1986); aaAmigun and Blottnitz (2010); abDesai (1992); acBSP (2012). Akinbomi et al. (2014). “Nigerian biogas technology,”. BioResources 9(3), Pg #s to be added. 14.
(15) PEER-REVIEWED REVIEW ARTICLE. bioresources.com. Table 5. (cont’d). Comparison of Biogas Production Strategies in Different Countries. 22 23 24 25 26 27 28 29. (B) Small-scale or household digestersv Number of Strategies small scale digesters as at 2007 Kenya 6749 Biogas technology in most African countries has recorded little success due to less availability of technical and operational support among other factors. Only few of the installed biogas plants are still operationalx. Few operational biogas plants Ethiopia 5011 often experience numerous downtimes Tanzania 4980 Uganda 3083 Burkina Faso 2013 Senegal 334 Cameroon 159 Benin 42 vSurendra et al. (2014). Akinbomi et al. (2014). “Nigerian biogas technology,”. BioResources 9(3), Pg #s to be added. 15.
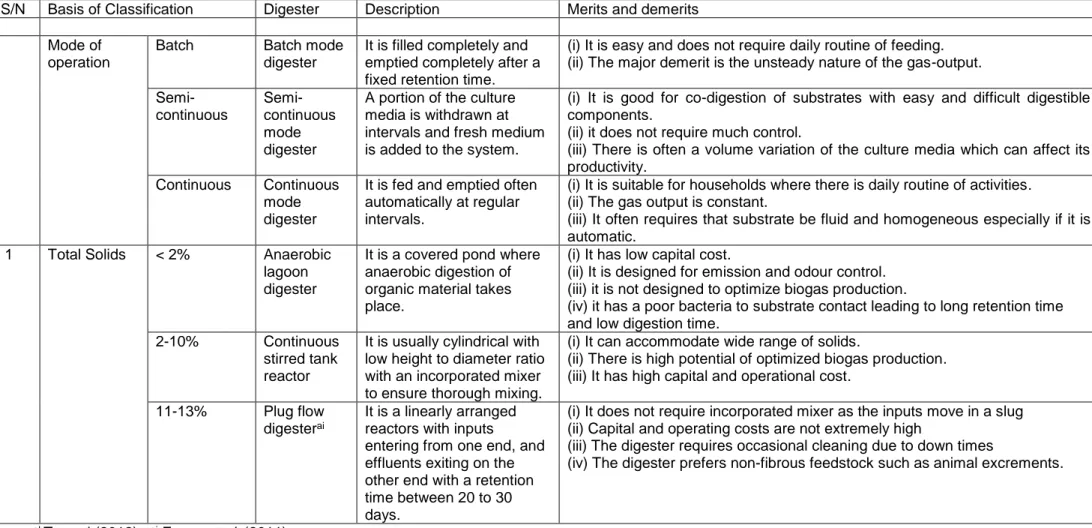
(16) PEER-REVIEWED REVIEW ARTICLE. bioresources.com. Obviously, adequate preparation is needed for the pre-design, design, operation and post–design of the biogas plants in order to accelerate the development of biogas technology in Nigeria. Appropriateness of Digesters for Biogas Production in Nigeria Digester design is an important factor in the sustainability of biogas technology. Although a digester can be adapted to suit a purpose different from that for which it was made, for effective performance the type of digesters to be selected depends on several factors including the feedstock type and availability, purpose, operational factors, scale, bacterial growth system, temperature, and population, among others. Table 6 shows examples of digesters commonly used in different applications of biogas technology. Digesters in most developed countries are usually medium to large digesters, while digesters in most developing countries are mostly household or small-scale digesters. There seems to be, therefore, a correlation between the scale of digester and biogas utilization; with gas utilization in most developing countries specifically for cooking and lighting, while gas utilization in most developed countries is for large scale electricity generation, heat, and vehicle fuels. The three common types of digesters used in most developing countries include Chinese fixed dome digester, Indian floating drum digester, and flexible balloon digester. Of these, the floating drum and fixed dome digesters installations are more robust and expensive than flexible balloon installations, which are cheap but subject to damage. Often, a trade-off needs to be made between choosing between expensive but robust, and cheap but non-durable designs. In Nigeria, digester suitability could be based on feedstock type and availability, geopolitical zones, population, and climatic vulnerability (i.e. rainfall decline, coastal flooding, and erosion). The six geopolitical zones and the year 2011 zone-based population percentage of the states in Nigerian are shown in Fig. 1. According to feedstock type and availability, Table 7 indicates the potential agricultural feedstock that could be used for large-scale biogas in the six zones. In the North West, the major agricultural crops that could generate large quantity of residues for large-scale production of biogas include guinea corn, maize, millet, beans, rice, cotton and groundnut, cassava, and yam. According to the climatic vulnerability (Table 8), the zone is extremely vulnerable, so adequate storage facility is needed to ensure continuous supply of the feedstock, though there is significant irrigation system spread across the zone. For effective costs, time, and labour management, a very large biogas plant dedicated to electricity provision for the whole zone can be located at Gombe, which is a state at the centre of the North East zone. Moreover, since Northern Nigeria is notable for commercial livestock farming, residues from the major crops stated above and livestock manure could be co-digested in the proposed biogas plant. Meanwhile, the availability of livestock manure for biogas production will depend on government support for provision of ranches to prevent nomadic farming, which is the common livestock farming system in the northern Nigeria. Besides the proposed large biogas plant, each state in the region could also support installation of household and community biogas plants that could use municipal wastes, sewage, and household wastes as feedstock. The major agricultural crops that could be produced in the other five zones and from which large quantities of residues could be generated are also given in Table 8. There is no significant difference in terms of the available feedstock for biogas production in the different zones in Northern Nigeria. There is, however, significant difference between the feedstock available in the Southern and Northern zones. Akinbomi et al. (2014). “Nigerian biogas technology,”. BioResources 9(3), Pg #s to be added. 16.
(17) bioresources.com. PEER-REVIEWED REVIEW ARTICLE. Table 6. Classification of Digestersah S/N. 1. Basis of Classification. Digester. Description. Merits and demerits. Mode of operation. Batch. Batch mode digester. (i) It is easy and does not require daily routine of feeding. (ii) The major demerit is the unsteady nature of the gas-output.. Semicontinuous. Semicontinuous mode digester. It is filled completely and emptied completely after a fixed retention time. A portion of the culture media is withdrawn at intervals and fresh medium is added to the system.. Continuous. Continuous mode digester. It is fed and emptied often automatically at regular intervals.. < 2%. Anaerobic lagoon digester. It is a covered pond where anaerobic digestion of organic material takes place.. 2-10%. Continuous stirred tank reactor. 11-13%. Plug flow digesterai. It is usually cylindrical with low height to diameter ratio with an incorporated mixer to ensure thorough mixing. It is a linearly arranged reactors with inputs entering from one end, and effluents exiting on the other end with a retention time between 20 to 30 days.. Total Solids. ahTomori. (2012);. ai. (i) It is good for co-digestion of substrates with easy and difficult digestible components. (ii) it does not require much control. (iii) There is often a volume variation of the culture media which can affect its productivity. (i) It is suitable for households where there is daily routine of activities. (ii) The gas output is constant. (iii) It often requires that substrate be fluid and homogeneous especially if it is automatic. (i) It has low capital cost. (ii) It is designed for emission and odour control. (iii) it is not designed to optimize biogas production. (iv) it has a poor bacteria to substrate contact leading to long retention time and low digestion time. (i) It can accommodate wide range of solids. (ii) There is high potential of optimized biogas production. (iii) It has high capital and operational cost. (i) It does not require incorporated mixer as the inputs move in a slug (ii) Capital and operating costs are not extremely high (iii) The digester requires occasional cleaning due to down times (iv) The digester prefers non-fibrous feedstock such as animal excrements.. Ferrer et al. (2011). Akinbomi et al. (2014). “Nigerian biogas technology,”. BioResources 9(3), Pg #s to be added. 17.
(18) bioresources.com. PEER-REVIEWED REVIEW ARTICLE. Table 6. (Cont’d). Classification of Digestersah S/N 2. 3. 4. Basis of Classification Gas holder Floating structure Gasholder. Stages of anaerobic digestion process. Temperature. ahTomori. (2012);. Digester Floating drum digesteraj. Description The digester has a movable gasholder that floats either directly on the slurry or in a water jacket of its own.. Fixed gas holder. Fixed-dome digesterak. The digester has a fixed, nonmovable gasholder that sits on top of the digester.. Onestage digestion process Multiple stage processes. One-stage digester. 5-20 oC. Psychrophilic digester. This is a digester with a single reactor where, all anaerobic processes take place. This digester consists of two or more reactors where different anaerobic processes take place. It is a digester which is operated at a low temperature range of 5-20 oC.. 30-35 oC. Mesophilic digester. 50-60 oC. Thermophilic digester. ajSingh. Multiple stage digester. It is a digester which is operated at a low temperature range of 3035 oC. It is a digester which is operated at a low temperature range of 5060 oC.. Merits and demerits (i) It has the advantage of constant gas pressure as this depends on the weight of gasholder. (ii) Its construction is easy. (iii) Material costs of the steel gas holder are high. (iv) It has a short life span since the steel parts are susceptible to corrosion. (i) It has low construction costs. (ii) It has a long life span if it is well-constructed since it is often constructed using non-rusting steel parts. (iii)The gas is often ineffectively utilized as the gas pressure fluctuates significantly. (iv) If the digester is not gas-tight, gas leakage may occur. (i) It is less expensive to operate than multiple stage digester. (ii) It is subjected to frequent disruptions due to occurrence of many reactions in the same reactor. (i) It is more efficient than single stage system since it allows specialization of acid and methane producing bacteria. (ii) Biogas production is optimized. (iii) It is more expensive to run than single stage system. (I) It does not require extra energy for heating as the operating temperature is often the temperature of the digester environment. (ii) It is often used for small scale operation. (iii) The solid retention time (SRT) is over 100 days. (i) Most existing anaerobic bacteria are at this temperature range. (ii) It is less expensive to operate than thermophilic digester.. (i) It is often used for large scale operation. (ii) Biogas production is faster than other temperature range. (iii) It is expensive to operate due to high heat energy requirement. (iv) Bacteria operating at this temperature range are few and sensitive to temperature fluctuations.. and Sooch (2004) ; akSanterre and Smith (1982). Akinbomi et al. (2014). “Nigerian biogas technology,”. BioResources 9(3), Pg #s to be added. 18.
(19) bioresources.com. PEER-REVIEWED REVIEW ARTICLE. Table 6. (Cont’d). Classification of Digestersah S/N 5. 6. Basis of Classification Bacterial Suspended growth bacteria system Attached bacteria. Digester Suspended growth digester. Scale. Family scale or household biogas plants that cannot produce more than 100 kW Farm-scale biogas plants that can produce between 100 and 500 kW Centralized codigestion biogas plants that can produce more than 500 kW. Very small scale. Small or medium scale. Large scale. ahTomori. Fixed film growth digester. Description In this digester, the bacteria are suspended and distributed throughout the digester. In this system, the bacteria are held by a media (e.g. membrane) for a long period. The digester is designed to produce biogas for family cooking and lighting needs. The feedstock for the digester is often from the household or family small farms.. Merits and demerits There is high potential of wash out of bacteria if the system is used for continuous operation.. It is designed to produce biogas at the community level for electricity, heat production and gas engine fuel. The feedstock is often from one or two neighbouring farms.. (i) The digester can be simple or complex with various sizes, designs and technologies. (ii) Many farm scale biogas plants are operated in European countries such as Germany, France, Austria, Denmark, and Sweden, among others.. The digester is designed for codigestion of many suitable feedstocks, and it is often centrally located to reduce costs, time and manpower required to transport feedstock and digestate to and from the digester, respectively.. (i) The digester is more profitable to generate higher agricultural, environmental and economic benefits for the society due to its economies of scale, higher capacity utilization and adequate professional management. (ii) This type of digesters is common in most developed countries including Denmark, USA, Germany, France, Sweden, among others. (iii) The demerit of large scale biogas plant is that if there is biological process inhibition there will be a total breakdown in the gas production for a period of time, since there is only one large digester. Furthermore, the installation cost is higher than small scale digester (iv) High investment costs are often required because of the complex structure which include large reactor volumes, additional components including pumps, temperature regulators, pre-storage tank among others, included in their designs. (i) It allows long SRTs and short hydraulic retention times (HRTs). (ii) Biogas production is optimized. (i) It is simple, cheap, robust and easy to operate and maintain, and can be constructed with local materials. (ii) Millions of family scale digesters are operated in countries like China, India or Nepal.. (2012). Akinbomi et al. (2014). “Nigerian biogas technology,”. BioResources 9(3), Pg #s to be added. 19.
(20) PEER-REVIEWED REVIEW ARTICLE. bioresources.com. Fig. 1. Geopolitical zones and the zone-based population percentage of the states in Nigeria. Akinbomi et al. (2014). “Nigerian biogas technology,”. BioResources 9(3), Pg #s to be added. 20.
(21) bioresources.com. PEER-REVIEWED REVIEW ARTICLE. Table 7. Geopolitical Zones and their Major Agricultural Crops Production in 2010ad Geopolitical zones North East. Total North West. Total North Central. Member States Taraba Borno Bauchi Adamawa Gombe Yobe Kaduna Kebbi Zamfara Sokoto Kano Jigawa Katsina Kogi Niger Benue Kwara Plateau Nasarawa FCT, Abuja. Total adNBS. Cassava. Beans. 2,187.96 18.38 14.19 13.94 2,234.47 2,535.64 43.04 3.71 4.16 54.77 2,641.32 2,879.39 999.76 3,791.45 1,012.16 294.54 1,157.30 33.62. 33.15 428.48 176.23 110.24 115.06 286.66 1,149.82 204.30 115.00 408.45 278.58 99.70 218.37 254.96 1579.36 31.02 340.78 54.27 12.70 78.53 91.29 4.40. Major Agricultural crops production in 2010 (production in thousand metric tons) Cocoyam Cotton Maize Melon Millet Rice Groundnut Guinea corn 492.51 184.20 401.99 197.86 269.05 10.36 740.24 398.08 293.42 357.79 720.40 8.13 0.61 267.31 330.96 54.03 262.38 571.46 92.64 188.85 7.12 187.86 121.86 192.36 7.38 58.02 253.84 0.69 250.18 105.08 62.92 280.68 3.23 22.52 0.70 473.04 84.76 109.31 288.95 15.51 164.86 1,965.27 1.39 1,643.58 1,127.14 112.12 2,322.90 10.75 24.41 1,006.06 485.38 732.42 297.51 603.95 2.33 17.98 43.86 288.66 69.64 86.77 256.06 155.19 77.40 390.81 41.56 195.57 702.13 3.67 21.02 18.03 714.16 71.66 154.60 270.60 0.94 59.62 140.55 323.11 422.05 526.94 745.72 20.90 11.09 535.33 68.66 82.09 200.45 128.92 324.54 309.26 36.47 183.42 608.42 14.02 410.69 1,624.52 18.03 3,046.71 1,442.46 1,526.9 3,387.33 6.36 0.23 261.06 3.15 20.54 104.02 28.00 54.28 26.14 628.85 177.99 199.17 636.67 546.62 677.91 170.33 0.40 70.96 341.48 309.00 171.86 164.03 8.77 14.51 78.47 51.39 45.97 102.87 477.78 117.49 124.74 67.76 317.51 175.34 36.22 43.45 112.79 127.57 123.40 39.61 5.01 12.02 7.18 17.48 5.87. 10,168.22. 612.99. 109.23. 26.37. 1,917. 231.54. 478.14. 1,405.35. (2012).. Akinbomi et al. (2014). “Nigerian biogas technology,”. BioResources 9(3), Pg #s to be added. 21. 1,147.82. 1,396.8. Soya bean. Yam. 1.96 10.78 12.74 75.97 10.31 3.37 31.46 10.20 131.31 119.24 17.65 1.62 2.49. 2,854.95 2,85495 2,408.72 1.06 2,409.78 1,203.31 3,914.17 522.61 608.28 2,143.47 213.96. 141. 8,391.84.
(22) bioresources.com. PEER-REVIEWED REVIEW ARTICLE. Table 7. (Cont’d). Geopolitical Zones and their Major Agricultural Crops Production in 2010 ad Geopolitical zones South West. Total South South. Total South East. Total. Member States. Major Agricultural crops production in 2010 (production in thousand metric tons) Cassava Beans Cocoyam Cotton Maize Melon Millet. Rice. Groundnut. Oyo Ogun Lagos Ondo Osun Ekiti. 2,920.01 1,519.79 322.58 2,205.09 834.34 1,377.65 9,179.46 2,380.37. 20.02 0.14 0.63 20.79 -. 107.11 124.70 605.71 189.34 161.69 1188.55 192.43. 0.12 0.17 0.17 0.06 0.52 -. 431.14 134.78 43.20 193.36 115.13 132.99 1050.60 76.49. 13.74 22.02 17.13 52.89 22.44. -. 0.29 85.73 86.02 -. 33.04 504.43 3,302.47. 1.17 -. 48.38 146.19 141.87. -. 31.36 151.69 181.31. 47.03 4.59. 330.96 -. 1,810.60 2,004.19 10,035.10 1,058.59 2,831.63 2,181.93 415.74 1,786.72 8,274.61. 0.78 1.95 0.78 1.22 1.34 3.34. 102.25 99.09 730.21 247.80 228.98 142.61 142.38 137.80 899.57. 203.94 56.10 700.89 93.48 97.34 87.98 73.84 65.93 418.57. 23.51 4.57 102.14 12.09 3.96 58.40 20.86 6.04 101.35. 330.96 -. AkwaIbom Bayelsa Edo CrossRiver Delta Rivers Ebonyi Enugu Imo Abia Anambra. -. Akinbomi et al. (2014). “Nigerian biogas technology,”. BioResources 9(3), Pg #s to be added. 22. Soya bean -. Yam. 0.49 0.72 1.21 -. Guinea corn 24.44 0.38 24.82 -. 54.03 18.62 3.19. 0.06 1.39 -. 0.31 -. -. 233.26 563.56 2,387.28. 75.84 334.85 46.40 4.21 385.46. 0.35 1.8 6.79 2.43 0.17 9.39. 0.26 0.57 0.65 0.08 7.82 8.55. -. 1,639.52 960.63 6520.05 1,039.93 2,319.05 994.87 798.69 1,417.43 6,569.97. 2,507.71 284.66 17.24 2,278.69 428.12 1,685.09 7,201.51 735.80.
(23) bioresources.com. PEER-REVIEWED REVIEW ARTICLE. Table 8. Geopolitical Zones, Climatic Patterns, and Vulnerability of Major Agricultural Crops Production in 2010ad Geopolitical Zones Projected Population in 2011 Member states and their zone-based population percentageae. North East. North West. North Central. South West. South South. South East. 22,270,120. 41,826,430. 24,213,654. 32,483,310. 24,568,687. 18,932,315. State Taraba Borno Bauchi Adamawa Gombe Yobe. % 11.9 22.1 24.7 16.5 12.4 12.4. State % Kaduna 16.9 Kebbi 9.1 Zamfara 9.2 Sokoto 10.3 Kano 26.4 Jigawa 12.0 Katsina 16.1 Mean maximum temperature ranged from 31.1 to 42.6 ˚C while monthly minimum temperature ranged from 11.1 to19.2 ˚C Total rainfall varied from 2000-3000mm Guinea corn, millet, Maize, beans, groundnut, rice, cotton, soya beans, and commercial livestock wastes. State % State % State % Kogi 15.9 Oyo 20.3 Akwa-Ibom 18.8 Niger 19.3 Ogun 13.6 Bayelsa 8.0 Benue 20.4 Lagos 32.8 Edo 15.0 Kwara 11.3 Ondo 12.4 Cross-River 13.6 Plateau 15.1 Osun 12.3 Delta 19.6 Nasarawa 8.9 Ekiti 8.6 Rivers 25.0 FCT, Abuja 9.1 Climatic Temperature Mean maximum Mean maximum Mean maximum Mean maximum conditionaf temperature ranged ranged between ranged between ranged between from 31.1 to 42.6 31.1- 42.6 ˚C 31.1- 42.6 ˚C 31.1- 42.6 ˚C ˚C while monthly temperature while temperature while temperature while minimum monthly minimum monthly minimum monthly minimum temperature ranged temperature ranged temperature ranged temperature ranged from 11.1 to19.2 ˚C from 11.1-19.2 ˚C from 20.0-24.1 ˚C from 20.0-24.1 ˚C Rainfall Total rainfall varied Total rainfall varied Total rainfall varied Total rainfall varied from 300-1000mm from 2000-3000mm from 2000-3000mm from 2000-3000mm Feedstock in high quantity Guinea corn, Yam, melon, Cassava, yam, Cassava, yam, for biogas production maize, millet, cassava, maize, melon, cocoyam, cocoyam, maize, beans, rice, cotton groundnuts, soya maize, rice and melon, rice and and groundnut. bean, rice, beans, domestic livestock domestic livestock guinea corn and wastes wastes cassava, yam and commercial commercial livestock wastes livestock wastes Climate vulnerability Index ag 1 3 4 6 5 ae:NBS (2012); afNigeria Climate Review Bulletin (2010); agFederal Ministry of Environment (Special Climate Unit) (2010) 1,2,3,4,5,6 – degree of relative climate vulnerability( 1: extremely vulnerable; 6: least vulnerable). Akinbomi et al. (2014). “Nigerian biogas technology,”. BioResources 9(3), Pg #s to be added. 23. State Ebonyi Enugu Imo Abia Anambra. % 13.2 20.0 24.3 17.2 25.3. Mean maximum ranged between 31.1- 42.6 ˚C temperature while monthly minimum temperature ranged from 20.0-24.1 ˚C Total rainfall varied from 2000-3000mm Cassava, Yam, rice, cocoyam, maize, melon and domestic livestock wastes. 2.
(24) PEER-REVIEWED REVIEW ARTICLE. bioresources.com. While cereals and legumes are produced in large quantity in the Northern zones, root and tuber crops such as yam, cocoyam, and cassava are produced in large quantity in the Southern zones. The variation is due to the climatic variations in the different zones. The central states for which the proposed large scale biogas plants could be located in the North West, North Central, South West, South East, and South South are Katsina, Abuja, Oyo, Rivers, and Anambra. The areas chosen for the potential large scale biogas plants should be protected from flooding and other destructive events. Furthermore, livestock farming in all the southern zones are mainly domestic, unlike in the North where it is practiced on a large scale, so the livestock manure may be used for household or community biogas digesters. The digesters could also use sewage, household and municipal wastes as feedstock to biogas production for domestic purposes. Biogas Technology Development and Dissemination Strategies Development of a viable biogas market is a prerequisite to attracting biogas investors. For a biogas market to be viable, people or potential biogas users must be informed of the benefits accrued unto them by using biogas as energy source. The following strategies are necessary for development of viable biogas market. The need for government intervention The role of government in stimulating the market penetration of biogas technology cannot be overrated, and thus, for easy penetration of biogas energy into energy market, the government needs to play an active role in ensuring that the biogas energy is sufficient, efficient, affordable, steady, and dependable (Winkler et al. 2011). Government interventions through subsidy provisions and tax holidays are needed to reduce the initial cost of investing in biogas technology. Uninterrupted development of biogas technology and dissemination requires unwavering and long-term government support in many areas, including financial support, legislative support, and technical support. The high level of biogas technology in most developed countries as discussed in Table 5 has been attributed to favourable policy formulation and implementation (Palvas et al. 2010; Stehlik 2010). It is therefore obvious that government support and development of biogas technology are inseparable. Government has an important role to play in the creation of an enabling environment for private sector participation in biogas technology in such a way that the produced biogas will be affordable to meet energy needs of the citizenry. At the present oil price, the initial capital cost of biogas production investment is higher than that of fossil fuel products, which tends to make fossil fuel products more affordable than biogas. However, the biogas sector can be made more affordable than any other energy sources if appropriate government measures are put in place. Favourable policies including a ban on landfilling of organic waste, setting of a target for inclusion of a specific percentage of biogas energy in the Nigerian energy mix, financial remuneration in form of feed-in system incentives, tax exemption/holiday, tipping fees on treated wastes, green certificates, affordable connection fees to the biogas based grid system, low biogas price, subsidy, among others, should be promulgated and implemented so that demand for biogas as a product would be encouraged. Markets for the two main products from anaerobic digesters including biogas and organic fertilizer, should be developed so that the biogas technology would be financially profitable and economically attractive to would-be investors. The economic viability of biogas technology will depend on income generation ability of its two products including biogas for cooking, lighting and power and digestate for organic fertilizer, or for fishpond or Akinbomi et al. (2014). “Nigerian biogas technology,”. BioResources 9(3), Pg #s to be added. 24.
(25) bioresources.com. PEER-REVIEWED REVIEW ARTICLE. animal feed. Nigeria has about 36 states, a federal capital territory, and 760 local governments with 12, 19, and 5 states having between 6-17, 18-29, and 30-44 local governments respectively. In order to effectively accelerate the development and dissemination of biogas technology, government at all levels including all the three tiers of Nigerian government namely, federal, state, and local governments should bear the bulk of responsibility involved in the development and dissemination of biogas technology. Increased awareness level and capacity building development The level of awareness of the benefits of biogas technology needs to be raised, as many people are not acquainted with benefits associated with biogas technology. In the rural area, for example, some people still have the notion that food cooked using fuel wood tastes better than food cooked using other energy sources. There should also be a feedback mechanism whereby biogas credibility as perceived by users could be easily communicated. This speeds up dissemination of the technology. This could be achieved by setting up a monitoring system based on cell phone technology, since most people both in urban and rural areas now use cell phones. Furthermore, many people lack the technical know-how in operating and maintaining biogas plants. People should be trained to construct, operate, and maintain biogas plants for efficient and optimum production. It would also be wise to make use of locally available materials in Nigeria for biogas projects in order to reduce the difficulty involved in getting spare parts of plants and thereby ensure the sustainability of the biogas programme. Capacity building through technical training to enhance local capability in the operation and maintenance of biogas plants could be achieved through the establishment of biogas research institutes or consultancy centres where biogas operators and users can find answers to their various questions and most importantly obtain any urgent assistance they may need from seasoned biogas experts and consultants at the centres.. Regulatory mechanism for biogas market in Nigeria In 2007, the Nigerian government, upon realizing the urgent need to incorporate biogas energy into her national energy mix, set up a national biofuels initiative under the Renewable Energy Division of Nigerian National Petroleum Corporation (NNPC), to coordinate the development of biofuel technology in the country. A ministry such as NNPC should therefore be organized and equipped to fill in the potential supply-demand gap by buying back excess biogas energy or supplying biogas energy in case of inadequacy as depicted in Fig. 2. NNPC. Biogas feedstock Provider. Biogas consumers. Biogas producer. Fig. 2. Proposed biogas market regulatory mechanism in Nigeria. Akinbomi et al. (2014). “Nigerian biogas technology,”. BioResources 9(3), Pg #s to be added. 25.
(26) PEER-REVIEWED REVIEW ARTICLE. bioresources.com. This is necessary since one of the main challenges to biogas dissemination in most countries where biogas technology is well developed is the cost of fuelling appliances using biogas as compared to fuelling it using other conventional energy sources such as petroleum products. Customer’s demand of biogas as a commodity or service that provides utility in terms of energy will depend on their willingness, attitude, and ability to pay for the commodity and the satisfaction derived from its usage. In other words, effective demand of biogas technology as a commodity will depend on factors that include its cost effectiveness, appropriateness, availability, reliability, efficiency, and technical potential. All of these factors need to be put into consideration for successful development and dissemination of biogas technology in Nigeria.. CONCLUSIONS Assessment of different types of wastes in this study has shown that there is huge potential of biomass feedstock for commercial biogas production in Nigeria. The available Nigerian biomass feedstock includes agricultural crop wastes, livestock manure, abattoir waste, organic MSW, and human waste with potential quantity of 52, 10, 0.8, 33, and 86 million tonnes respectively. Total biochemical potential of biogas that could be generated from the biomass feedstock is 72 billion cubic metres, from which 270 TWh of electricity could be generated, which is enough to satisfy the annual electricity need of the Nigerian population. Furthermore, according to the geopolitical zoning of biomass and manure, northern zones have the potential for high production of cereal and legumes crop residues, while the southern zones have the potential for high production of root and tuber crops. It could be a wise idea to have a large centrally located biogas plants in each geopolitical zone that could be used to generate electrical energy to power each zone. Presently, biogas energy has not been incorporated into the Nigerian energy mix since the current level of biogas technology in Nigeria is very low. Most of the few existing pilot scale digesters are currently non-operational, while the few biogas plants that are operational have frequent downtimes. The problem has been attributed to technical, economic, and social impediments including poor digester designs, management, maintenance, planning, monitoring, lack of awareness, and inadequate dissemination strategy. Most importantly among the barriers to the dissemination of biogas technology in Nigeria is the lack of support from the government in the area of policy promulgation (legislative framework) and implementation, provision of subsidies, soft loans, and tax incentives in addition to good structural facilities. Meanwhile, in order for Nigeria to meet and surpass the lowest threshold of energy accessibility of 100 kWh of electricity and 1200 kWh of modern fuels per person per year proposed by International Energy Agency (IEA) (AGECC 2010; GEA 2012; IEA 2011), concerted effort and shared responsibility from various stakeholders including policy makers (government), researchers, industries, educators, and end-users must be geared towards introduction of a successful and sustainable biogas technology to provide alignment between economic, social, environmental, and regulatory variables needed for the technology. The target of 80% electricity coverage by 2015 in the roadmap to power sector reforms may not be realizable if urgent measures on accelerating biogas development and dissemination are not put in place (Jonathan 2010). If barriers to the development of biogas technology could be surmounted, opportunities such as huge availability of biogas feedstock, favourable climate which promotes large scale Akinbomi et al. (2014). “Nigerian biogas technology,”. BioResources 9(3), Pg #s to be added. 26.
(27) PEER-REVIEWED REVIEW ARTICLE. bioresources.com. agriculture, huge population, among others, abounds for accelerated development of biogas technology in Nigeria. Strategies including creation of biogas research or consultancy centres and re-organization of a ministry such as NNPC to fill in the potential supply-demand gap by buying back excess biogas energy or supplying biogas energy in case of inadequacy; provisions of soft loans, promotion of specialized programmes focusing on technology and knowledge transfer from countries with well developed biogas technology, among others, will help in the acceleration and dissemination of biogas technology in Nigeria. The need for Nigeria to diversify her energy sources and toe the line of biogas technology by harmonizing biogas into the existing energy supply-chain cannot be over-emphasized in view of the country’s vision to be among the top 20 economies of the world by 2020. Given political will and government unwavering support coupled with the effective management of technical, social, political, legal, technical, human, cultural, and environmental factors, biogas technology could be evolved and disseminated to meet the daily energy needs of the Nigerian citizenry.. ACKNOWLEDGMENTS This work was supported financially by the Swedish Energy Agency and Lagos State University. The authors are indeed very grateful for the support provided.. REFERENCES Abila, N. (2012). "Biofuels development and adoption in Nigeria: Synthesis of drivers, incentives and enablers," Energy Policy 43, 387-395. Abubakar, M. (1990). "Biogas generation from animal wastes," Nigeria Journal of Renewable Energy 1(1), 69-73. Adeoti, O., Ilori, M. O., Oyebisi, T. O., and Adekoya, L. O. (2000). "Engineering design and economic evaluation of a family-sized biogas project in Nigeria," Technovation 20(2), 103-108. Adewunmi, I. K., Ogedengbe, M. O., Adepetu, J. A., and Fabiyi, Y. L. (2005). "Planning Organic fertilizer industries for municipal solid wastes management," Journal of Applied Sciences Research 1(3), 285-291. Adeyanju, A. A. (2008). "Effect of seeding of wood-ash on biogas production using pig waste and cassava peels," J. Eng. Appl. Sci. 3, 242-245. AGECC. (2010). Energy for a Sustainable Future. Summary Report and Recommendations, AGEEC-The Secretary General's Advisory Group on Energy and Climate Change. United Nations, New York. Akpan, U.S.’ and Ishak, S.R.(2012). “Electricity Access in Nigeria: is off-grid electrification using solar photovoltaic panels economically viable?” A sustainability, Policy, and Innovative Development Research (SPIDER) Solutions Nigeria Project. (INTERIM REPORT). Amori, A. A., Fatile, B. O., Ihuoma, S. O., and Omoregbee, H. O. (2013). "Waste generation and management practices in residential areas of Nigerian tertiary institutions," Journal of Educational and Social Research 3(4). Amigun, B., von Blottnitz, H. (2010). Capacity-cost and location-cost analyses for biogas Akinbomi et al. (2014). “Nigerian biogas technology,”. BioResources 9(3), Pg #s to be added. 27.
Figure


+7


Related documents
If a clear relationship be- tween sweet taste sensitivity and acceptance of sweet foods exists in children, we would have expected correlations between the measured sweet
Synliggöra värdet av ekosystemtjänster – Åtgärder för välfärd genom biologisk mångfald och ekosystemtjänster.. Läroplan för grundskolan, förskoleklassen och
For any rate of churn and stabilization rates, and any system size, we accurately account for the functional form of: the distribution of inter-node distances, the probability
Nevertheless, a set of challenges persists, such as verification of liveness properties during SDN policy verifi- cation, inclusion of interleaved policy execution, eliminating the
Ett av de primära syftena med CFT är att minska skam och självkritik, vilket skulle kunna göra det till en lovande behandling för överviktiga personer, inte minst med tanke på
Tidigare forskning gällande samverkan mellan verksamheter belyser ofta hinder med och förutsättningar för fungerande samverkan, vilka rör bland annat enskilda
3.1 Innanför huvudregelns ram Domstolar och nämnder synes fullt ut ha accepterat den i författningskommentaren föreskrivna huvudregeln att make, registrerad partner, sambo, barn
Självfallet kan man hävda att en stor diktares privatliv äger egenintresse, och den som har att bedöma Meyers arbete bör besinna att Meyer skriver i en
