1 2 3 4 5 6 7 8 9 10 11 12 13 14 15 16 17 18 19 20 21 22 23 24
Better sorry than safe?
MASTER THESIS WITHIN: Business Administration NUMBER OF CREDITS: 30 ECTS
PROGRAMME OF STUDY: Civilekonom AUTHOR: Anton Joakimson and Olle Lyrfors
TUTOR: Fredrik Hansen and Toni Duras
JÖNKÖPING May 2021
An evaluation of Scandinavian acquirers participating in European mergers and acquisitions between 2010-2017
i
Master Thesis in Business Administration
12
Title: 3
Better sorry than safe? An evaluation of Scandinavian acquirers participating in 4
European mergers and acquisitions between 2010-2017 5
6
Authors: 7
Anton Joakimson and Olle Lyrfors 8
9
Tutor: 10
Fredrik Hansen and Toni Duras 11
12
Abstract: 13
Mergers and acquisitions (M&A) are a popular way of growing a company. This is 14
challenged by previous research that shows that an M&A-transaction generally 15
harms the financial key metrics of the acquiring company. The main focus of this 16
report is to examine if there is an effect on financial ratios for Scandinavian 17
companies partaking in an M&A as an acquirer. The effect is captured by the 18
movements in the key metrics return on equity (ROE), return on assets (ROA), 19
return on invested capital (ROIC), EBIT-margin. In addition, both ESG-ranking and 20
underlying non-financial values, like if the deal was domestic or not, the age of the 21
executives and board gender diversity, are looked at for a better understanding of 22
what differences there are between the performance of M&As. 23
24
A database of Scandinavian companies acting within Europe was created containing 25
the specific deal characteristics over a period of three years prior as well as three 26
ii
signed-rank test, bivariate Pearson Correlation and Independent Samples t-test. 1
The generated results in the aggregated dataset showed a negative performance of 2
ROE and ROIC in the period after the deal, compared to the period prior to the deal. 3
This result was also seen in the sub-set of foreign deals with an additional negative 4
performance of ROA for the acquirer while the sub-set of domestic deals did not 5
show any significant negative performance in the period after the deal. We found 6
that it was not possible to analyze the post-period effect on ESG-ranking as the data 7
for our included companies was too scarce. Our findings suggest, when looking at 8
our certain key metrics, that M&A-transactions are not economically justified and 9
that executives might be partially motivated by something other than economic 10
performance when deciding upon an M&A. It is furthermore possible to conclude 11
that the disclosing of ESG data has not been a priority for companies in the past and 12
continues to be ignored by the masses which makes it difficult to progress 13
academically in this field. 14
15
Date: 2021-05-20 16
17 18 19
iii
Acknowledgments
1This thesis marks the end of an era for us here at JIBS. Therefore, we first want to 2
direct a special thanks to the university for all the knowledge we have received 3
during these four years. 4
5
In a time of global lockdowns and uncertainties, the process of writing this thesis 6
has taken place under unique settings where all meetings and seminars has been 7
made possible through digital platforms. With that said, we want to show our 8
greatest gratitude to our tutors Fredrik Hansen and Toni Duras for their valuable 9
guidance throughout the process of writing, as well as our seminar group for their 10
comradery. Even if this is the end of our journey here at JIBS, it is the beginning of 11
new journey, namely that of our professional careers. We are JU. 12
13 Jönköping, 20th of May 14 15 16 17 18 19
Anton Joakimson Olle Lyrfors 20
21 22 23 24 25 26 27
iv
Quote
12
“In the field of mergers and acquisitions, case after case led to disappointments. 3
New acquisitions, which were profitable before the merger, mysteriously became 4
unprofitable afterwards; key managers acquired through mergers tended to leave 5
the firm, in spite of attractive financial inducements; synergies anticipated from 6
mergers failed to materialize” 7
8
H. Igor Ansoff, The new corporate strategy, John Wiley & Sons, Inc., 1988, p. 9
206. 10
v 1 INTRODUCTION ... 1 1 1.1 BACKGROUND ... 1 2 1.2 PROBLEM FORMULATION ... 3 3 1.3 PURPOSE OF STUDY... 4 4 1.4 RESEARCH QUESTION ... 4 5
2 REVIEW OF RELATED LITERATURE ... 5 6
2.1 MERGERS AND ACQUISITIONS IN GENERAL ... 5 7
2.2 RETURNS FROM MERGERS AND ACQUISITIONS ... 8 8
2.3 ESG PERFORMANCE AFTER MERGERS AND ACQUISITIONS ...14 9
2.4 LINKING GENDER DIVERSITY TO ESG ... 15 10
2.5 REFLECTION ON RELATED LITERATURE AND HYPOTHESIS DEVELOPMENT ... 17 11
3 METHODOLOGY AND EMPIRICAL METHOD ... 21 12
3.1 RESEARCH METHODOLOGY ... 21 13
3.2 RESEARCH DESIGN AND METHOD ... 22 14
3.2.1 Deal characteristics ... 22 15
3.2.2 Time frame ... 24 16
3.2.3 The gathering of deals ... 25 17
3.2.4 Primary and secondary parameters of interest ... 28 18
3.2.5 The counterfactual case: What if no M&A? ... 29 19
3.2.6 Specified hypotheses ... 32 20
3.2.7 Börsdata ... 32 21
3.2.8 Target company data ... 33 22
3.2.9 Final dataset... 33 23
3.3 METHOD FOR STATISTICAL ANALYSIS ... 34 24
3.3.1 Explanation of variables ... 34 25
3.3.2 Wilcoxon signed-rank test ... 35 26
3.3.3 Bivariate Pearson Correlation matrix and Independent Samples t-test ... 36 27
3.3.4 Method for ESG-score analysis ... 37 28
3.4 EVALUATION OF METHODOLOGY ... 38 29
4 EMPIRICAL ANALYSIS ... 40 30
4.1 DESCRIPTIVE ANALYSIS... 40 31
4.2 PRE-AND POST-PERFORMANCE MEASURED WITH WILCOXON SIGNED-RANK TEST ....41 32
4.2.1 Financial performance of all acquirers ...41 33
vi
4.2.3 Financial performance of acquirers participating in foreign deals ... 47 1
4.3 BIVARIATE PEARSON CORRELATION MATRIX ... 49 2
4.4 ESG-SCORE ANALYSIS... 52 3
5 DISCUSSION ... 55 4
5.1 THE DATA CAPTURING PROCESS ... 55 5
5.2 DISCUSSION OF OUR RESULTS ... 56 6
5.3 SOCIAL AND ETHICAL ASPECTS ...61 7
5.4 SUGGESTIONS FOR FUTURE RESEARCH ... 62 8
6 CONCLUSION ... 64 9 7 REFERENCES ... 66 10 8 APPENDIX ...73 11 8.1 APPENDIX A1... 73 12 8.2 APPENDIX A2 ... 75 13 8.3 APPENDIX A3 ... 76 14 8.4 APPENDIX A4 ...77 15 8.5 APPENDIX A5 ... 78 16 8.6 APPENDIX A6 ... 79 17
18 19 20 21 22 23 24 25
vii
Definitions and formulas
1• CEO: Chief executive officer 2
• CFO: Chief financial officer 3
• EBIT: Earnings before interest and taxes 4
• EBIT-margin: (Operating income / Revenue) 5
• ESG: Environmental, Social and Governance 6
• M&A: Merger and acquisition 7
• Post-M&A: The period after the deal 8
• Pre AVG: Pre-M&A average of the specific ratio (used in empirical analysis) 9
• Pre-M&A: The period before the deal 10
• ROA: Return on assets (Net income / Total assets) 11
• ROE: Return on equity (Net income / Equity) 12
• ROI: Return on investments ((Total revenue - Total cost) / Total cost) 13
• ROIC: Return on invested capital (Net operating income after tax / Total 14
invested capital) 15
• The target firm: The firm that is being acquired 16
• The acquiring firm: The firm that is buying the target firm 17
1
1
Introduction
12
The introductory chapter describes the background and problematization of the 3
study. The chapter concludes with the purpose and research question. 4
5
1.1 Background 6
Apple, Saudi Arabian Oil Company, Microsoft, Amazon and Alphabet are all 7
companies that not only sound familiar but were also among the biggest companies 8
by market capitalization in January 2021. At this time, they had a combined market 9
cap of 8,8 trillion USD. To put this number in relation to Swedish GDP for 2019 it 10
stands at around 1450% greater. What these companies have in common is that they 11
have all completed an array of mergers and acquisitions that now constitutes the 12
companies. According to Kumar (2018) most of the modern-day biggest companies 13
have taken their form thanks to a series of mergers and acquisitions and it remains 14
one of the quickest ways to tap into new markets and to expand business operations. 15
However, as popular as this strategy is, it is opposed by the opening quote by H. Igor 16
Ansoff (1988) implying that case after case, led to disappointments and that 17
profitable companies before the merger, mysteriously became unprofitable. 18
19
The academic arena is filled with research about mergers and acquisitions (M&A), 20
especially in the context of the value it creates for the shareholders in terms of stock 21
price alteration. Some of the studies on short term stock performance are those from 22
Andrade et al. (2001), Moeller et al. (2005), Ang and Cheng (2006), Alexandridis et 23
al. (2010), and Erel et al. (2012). They are all looking at, both, the target and 24
acquiring firm around the announcement of the deal, and how the stock price is 25
affected by the news. In addition to this, there are articles showing that the short- 26
term value creation for the shareholders is minimal or non-existent or even comes 27
with negative effects (Campa & Hernando, 2004; Kiymazd & Baker, 2008). On the 28
flip side, we have articles that show minor to positive effects in the short-term 29
2
confusion, there are also studies like Fatemi et al. (2017) showing that there is no 1
significant effect of wealth creation for the shareholders of the acquirer but instead 2
significant effects of wealth creation for the shareholders in the acquired firm. 3
4
M&A is looked upon as a vessel for lucrative growth of a company and its popularity 5
remains consistent. The shareholder perspective for M&As and the analysis of the 6
M&As impact on the stock price is relatively thoroughly researched but this potential 7
increase or decrease of the stock has its origin in the fundamental aspects and 8
numbers of the acquiring company. If the M&A is successful, then it will be reflected 9
in the key metrics of the company’s underlying business and the stock price will, in 10
theory, increase. Hence, looking at the perspective of the company’s financial ratios 11
pre-and post-M&A is a perspective that has gotten somewhat overshadowed in 12
favour of the shareholder perspective in the academic arena. 13
14
A Scandinavian company that uses M&As to grow is GARO. It is a medium sized 15
company listed on OMX Stockholm Mid Cap. The company, like many other similar 16
firms, argues that acquisitions can accelerate growth and increase market shares. 17
However, the confusion that is brought to attention by academic research on M&A 18
and its potential value contribution and effect on a company’s key metrics for the 19
acquirer is still present. The questions are coming from the management team and 20
the CFO in particular. They are asking themselves what the best way to assess a 21
potential M&A is and if it really is financially and environmentally sustainable 22
(Helena Claesson, CFO GARO, personal communication, 2 February). As of now, 23
GARO's management and board of directors value the key metrics, return on 24
invested capital (ROIC), EBIT-margin, cost of goods sold (COGS) and Earnings per 25
share (EPS) when evaluating a transaction. However, there is no consensus amongst 26
the executives how these metrics generally are affected by an M&A for a 27
Scandinavian company. 28
29
On the topic of whether or not M&As are environmentally sustainable, there is a 30
novel perspective to be found in terms of the effect M&As has on ESG 31
3
stated in Amel-Zadeh et al. (2018) this was only disclosed by 20 companies in the 1
1990s but the importance of it was reflected when in 2016, around 9000 companies 2
disclosed this information. The combination of adding the parameter of ESG- 3
ranking within the M&A process is still a fragmented and new perspective that has 4
proved to be both unclear and difficult to understand. 5
6
1.2 Problem formulation 7
The available research on M&As is broad and as stated it also encompasses a wide 8
spectrum of different goals that are aimed to be achieved by the companies which 9
are hard to quantify in a single report. Ansoff (1988) claimed that case after case in 10
mergers led to disappointment, at the same time as we are seeing this strategic way 11
of growing a business highly relevant amongst executives. If Ansoff (1988) is correct, 12
then why are decision-makers rather sorry than safe? 13
14
According to previous studies there is an array of different financial key metrics or 15
parameters that can be analyzed in a study like this. Looking at a survey, done by 16
Haas and Hodgson (2013), targeting company executives, sell-side analysts and 17
investors, it’s clear that there is no real consensus on what to look at when 18
considering an M&A. Even if they all have “skin in the game” the perspective from 19
an investor versus an executive within a company most likely differ significantly as 20
they build their assumptions and opinions from an internal and a more external 21
basis. But then one can ask the question of who of the parties is the more correct one 22
in their analysis of a potential M&A. 23
24
In addition to this, there is a great quantity of previous studies claiming just like 25
Ansoff (1988), that mergers are not financially sound (Qian & Zhu, 2018; Fatemi et 26
al., 2017; Demirbag et al., 2007; Knapp et al., 2005; Mudde & Brush, 2004). 27
Although, as the confusion seen in GARO, more studies needs to be done for 28
Scandinavian circumstances. 29
4
Going back to the novel perspective of ESG-ranking we see in the report by Hakola 1
et al. (2020) that Nordic companies have been early adopters of ESG reporting but 2
that there exists a general problem with ESG-rankings as the framework for 3
reporting this data by companies is voluntary and not unitary. Although there are a 4
few services available in an attempt to bridge this gap of uncertainty, it still remains 5
a somewhat uncharted metric for most investors and companies. As the EU will, in 6
2021, start to implement a taxonomic system for funds where 10 000 billion euros 7
will be invested in green companies from 2021 to 2023 (EUT L 198, 22.6.2020, s. 8
13–43), it could be of interest for executives to know if their company’s ESG-ranking 9
could be affected by an M&A transaction. This in order to not miss out on green 10
investments and to make a more well-informed decision. 11
12
1.3 Purpose of study 13
With the problem formulation in mind, the purpose of our study is to empirically 14
investigate if M&As increase or decrease certain financial ratios for Scandinavian 15
acquiring companies. In addition to the change in these metrics for the acquirer, we 16
will evaluate characteristics in companies participating in M&As and see how this 17
correlates with the performance of the deal. Lastly, we want to see how the role of 18
ESG-ranking plays out in the process and if the rank of the acquiring company 19
changes after the M&A transaction. By adding to the academic research arena of 20
M&As, looking specifically at Scandinavian acquirers, plus the addition of ESG, we 21
believe that company executives could benefit by being able to make their decision 22
on a more informed basis. 23
24
1.4 Research question 25
This thesis sets out to answer a broad question regarding the topic of financial 26
performance for the acquirer in mergers and acquisitions as well as the effect it has 27
on ESG-Score: 28
- Does M&As affect the performance of the acquirer based on certain key 29
5
2
Review of related literature
12
The second chapter provides a review of related literature. A thorough review of 3
mergers and acquisitions is given as well as a compilation of previous studies with 4
a similar purpose. Finally, based on already presented facts, as well as gaps in 5
previous research, our hypotheses are developed. 6
7
2.1 Mergers and acquisitions in general 8
When two companies merge with each other and only one remains afterward, a 9
merger arises. The acquired company is usually the one that stops to exist and the 10
buyer acquirer its debts and assets. In some cases of an M&A, we have two 11
companies of equal size that together form a completely new company (Gaughan, 12
2013). Furthermore, the company that is acquired is called target and the buyer is 13
called the acquirer. The vast majority of transactions are according to Gaughan 14
(2013) friendly where both parties negotiate a satisfactory deal. For listed 15
companies, a press release is issued when all terms have been approved, this day is 16
called the announcement day. According to Gaughan (2013), implementing M&As 17
is a key component when it comes to growth strategies for most companies in all 18
possible industries and is perceived as a faster way to growth compared to internal 19
organic processes. 20
21
The main goal of an M&A is to create value. The value can often be seen through 22
combinations of synergies that create corporate growth, increase profitability, create 23
larger market shares and finally increase the return for shareholders (Alexandridis 24
et al., 2010). Berkovitch and Narayanan (1993) argued that there are three different 25
types of motives why companies choose to participate in an M&A and with a sample 26
of 330 deals during the period of 1963-1988 they develop tests to distinguish among 27
these three motives. 28
6
The first motive according to Berkovitch and Narayanan (1993) is the synergy 1
motive, which in principle means that the motive behind an acquisition is to create 2
synergies that maximize financial wealth. With this motive, only acquisitions that 3
create an actual value for shareholders are carried out. Thus, the measurable gains 4
are positive, both for the target firm and the acquirer, when acquiring with the 5
synergy motive in mind. 6
7
The second motive is the agency motive which is when the acquisition is primarily 8
carried out as a result of the self-interest of the acquiring management. An example 9
is when managers with a certain speciality only acquire companies in this area so 10
that the success of the newly acquired company depends on their specific skills 11
(Berkovitch & Narayanan, 1993). These types of executions from those in power 12
often lead to costs that reduce the total value of the target company. Generally, the 13
agency motive leads to the acquiring company, in particular its management, 14
draining the target company on its value. This means that there is often a negative 15
correlation between acquirer gains and target gains after an acquisition with such a 16
motive. 17
18
The third and final motive that Berkovitch and Narayanan (1993) examined is 19
known as the hubris hypothesis. This motive implies that acquisitions are 20
motivated, or are a consequence, of managers' mistakes. Managers of the acquiring 21
company overestimate the synergies that are intended to be created and lead to 22
overpayments for the company. Berkovitch and Narayanan (1993) concluded that 23
the synergy motive is the reason for the majority of the deals but that many takeovers 24
still are motivated by hubris. 25
26
Continuing on the topic hubris hypothesis, it was first presented by Rickard Roll in 27
1986. Roll investigated and tried to explain the hubris hypothesis in the fields of 28
corporate takeover. Roll claimed that if there are no financial benefits from a 29
merger, it is hubris from decision-makers that is behind the decision. Hubris to the 30
point that one simply overestimates the benefits of carrying out a transaction and 31
7
their mistakes. Roll (1986) argued that it is difficult for managers to achieve 1
optimality in the M&A field through experience alone. 2
3
According to DePamphilis (2018) hubris occurs when the acquirer (often the CEO 4
and management team) believes that their own valuation of a company is more 5
accurate than the estimation by the market. This means that they pay too much for 6
a company as a consequence of overestimating the synergy effects that can arise. 7
Subsequently, competition between bidders often leads to the winner paying too 8
much due to hubris, since managers usually are competitive. DePamphilis means 9
that this bidding war can push the price up to levels that are far from the real market 10
value of the target company. 11
12
Furthermore, Park and Yoo (2017) mentioned in their conceptual article on CEO 13
hubris and related constructs, that there is a confusion regarding the hubris 14
hypothesis and it needs to be more clearly defined as it could prove to be either 15
antecedent or a consequence of events. They state that future research should 16
develop this framework further as it is now a scarce and still developing area. They 17
continue to say that it would be interesting to see research on whether there can be 18
a positive outcome from CEO hubris as current research shows mainly negative 19
consequences. Help from academic research in defining this topic and added 20
impacts could aid business executives' judgment and enhance their decision-making 21
process. 22
23
Something that is closely linked to the hubris hypothesis is the phenomenon of the 24
Winner’s curse. The phenomenon was first tackled by Capen et al. (1971) who found 25
that oil companies experienced low returns year after year after winning an oil lease 26
auction. In the case of M&As, Anandalingam and Lucas (2004) examined the 27
concept of the Winner’s curse with a combination of accessible theory and current 28
examples. Just like the hubris hypothesis, both market and psychological-based 29
forces repeatedly lead decision-makers to overestimate the target they are buying. 30
Anandalingam and Lucas (2004) claimed that the bidding process is linked to the 31
8
However, when a company wins an auction and the target ends up creating value, a 1
feeling of complacency often occurs by the winners. This curse is according to 2
Anandalingam and Lucas (2004) dangerous since it may lead to less successful 3
decisions by the management in the future. 4
5
One area that can be connected to both the hubris hypothesis and the winner's curse 6
is the hindsight bias. When an event has taken place and the outcome is known 7
people tend to overestimate the predictability of the event more than before (Roese 8
& Vohs, 2012). Asaoka (2019) claims in a behavioural analysis that M&As, due to 9
the risk of overvaluation, often result in failures. Asaoka’s purpose was to examine 10
this risk by highlighting the biases of decision-makers within M&As. By concepts 11
and results obtained from cognitive science research, decisions made by managers 12
could be analyzed. The findings from Asaoka imply that biases from decision- 13
makers that causes overvaluation include, among others, overconfidence (hubris), 14
winner’s curse, and hindsight biases. The last mentioned can be seen when escalated 15
bidding prices are justified after the deal, not before, by relevant plans and data. 16
Hence, when managers act as if they perceived it beforehand, even if they did not, 17
hindsight bias occurs in regard to the outcome of a transaction. 18
19
2.2 Returns from mergers and acquisitions 20
According to DePamphilis (2018) there are two methods for measuring the effect of 21
an M&A, these are pre-M&A event returns and post-M&A accounting returns. The 22
pre-M&A method measures the return for the companies involved in the deal and 23
looks at the abnormal returns around the announcement date. If investors are 24
expected to get a five percent return but instead earn eight percent due to a takeover, 25
the abnormal pre-M&A return would be three percentage points. The post-M&A 26
return measures instead the return after the deal has been completed. This approach 27
of assessing the post-performance of the deal takes into account financial measures 28
during a three to five-year period following the deal. Based on previous literature 29
surveys, DePamphilis (2018) claimed that the post-M&A method does not, during 30
9
can see, however, are broad tendencies in how things are going for the participants 1
of the M&A. 2
3
DePamphilis (2018) also concluded that post-M&A performance studies may be 4
problematic due to significant limitations. This might be a consequence of different 5
time periods and factors unrelated to the deal, such as an economic crisis. 6
Furthermore, the longer period after the deal that is being analyzed the greater the 7
risk that other unrelated factors affect the financial numbers of the company. It is 8
also difficult according to DePamphilis (2018) to make assumptions of long-term 9
studies within the post-M&A return since it’s hard to know how the firm would have 10
performed without the merger. 11
12
Bruner (2002) compiled results from 100 scientific studies between 1971 and 2001 13
in a meta-study. Bruner began by highlighting that the measurement methods 14
around whether M&As are profitable vary and that the results are critically 15
dependent on statistical self-confidence in the various methods and measurements 16
that are carried out. According to Bruner, there are four approaches in academic 17
research to measure financial profitability from M&As. These four are Event studies, 18
Accounting studies, Surveys of Executives and Clinical Studies 19
20
Event studies look at abnormal returns around and after the M&A announcement. 21
The return is usually compared to a benchmark index, such as the S&P 500. This is 22
a forward-looking approach that is based on the assumption that stock price is the 23
present value of future cash flows. Since 1970, event studies have dominated the 24
research industry on M&A profitability according to Bruner (2002). Accounting 25
studies look at reported financial results. These parameters are looked at before and 26
after the deal to clarify how the company's financial position has changed. 27
Parameters that are often examined when conducting this type of study are net 28
income, return on equity (ROE), return on assets (ROA), operating margins and 29
general liquidity of the firm. The third approach that Bruner (2002) found is Surveys 30
of Executives where managers of a company are asked if their deal was successful or 31
10
conclusions about the answers. The fourth and last way to investigate whether M&As 1
are profitable or not is through a Clinical study. This study is similar to surveys of 2
executives but is more thorough in each transaction. 3
4
Bruner (2002) split his study of profitability into three parts. These are the 5
profitability of the acquiring company, the acquired and a combination of these. The 6
compilation of studies of the acquired companies (target firms) shows that their 7
profitability development often becomes positive after an acquisition. On the other 8
hand, Bruner believes that it is more difficult to determine the profitability of the 9
acquiring company. 20 of the previous studies show negative results for the 10
acquirer, where 13 of these show significant negative results. However, 24 of the 11
studies examined show positive results for the buyer, but that the return after an 12
acquisition tends to decrease in the longer term. The studies that specifically 13
examined the return on assets (ROA) and operating margin for the acquirer after a 14
deal have three positive results, four negatives and eight shows that no changes have 15
taken place after the acquisition 16
17
The main conclusion in Bruner (2002) is that the investigated studies both show 18
positive and negative effects after M&As, however, the impact is usually extremely 19
small. He further believes that the corporate strategy has as much to do with 20
profitability as the deal itself. The reason for the variability in so many previous 21
studies can be due to pure conceptual problems where concepts such as success and 22
failure are used differently. What the various researchers consider to be a successful 23
and unsuccessful M&As varies, which creates a certain problem in the analysis of 24
data. 25
26
Continuing on the topic of the return from M&As, Mudde and Brush (2004) 27
addressed operational efficiency and showed that acquiring companies can be 28
successful in increasing their revenue or reducing their costs, but that they do not 29
always succeed in increasing the return on assets (ROA). Mudde and Brush (2004) 30
examined a sample of 230 U.S. banks participating in an acquisition in 1994 or 1995. 31
11
of these, high levels of mixed strategies and operational effectiveness, had a positive 1
effect on ROA in the post-M&A period. 2
3
Knapp et al. (2005) examined the post-M&A performance of banks between 1987- 4
1998. They looked at a sample of 80 M&As with a deal value of over $25 million. 5
They were also careful that the companies included in the sample only carried out 6
one transaction during the time-span they examined. This is because if another 7
acquisition was made, it was difficult to ascertain which transaction the various 8
effects came from. Knapp et al. (2005) looked at the following 5 years after the deal 9
and was specifically interested in return on equity (ROE) and ROA. On these 10
parameters, peer comparison, regression analysis and event studies were conducted 11
to evaluate the post-M&A performance of the acquiring companies. Knapp et al. 12
(2005) concluded from their study that on average the acquirer underperforms the 13
industry in the post-M&A period. This is not the case for only a few failed 14
transactions but half of the companies in their dataset underperformed compared 15
to the industry in the post-M&A period. Another interesting conclusion they could 16
draw was that it is more difficult to merge when the target company is large in 17
relation to the buyer. When a small company is acquired, it is easier for it to adapt 18
to the culture and business approaches of the acquirer. Thus, small transactions 19
tend to be less distracting to the acquirer's momentum and integrate more easily 20
into their business model. 21
22
Demirbag et al. (2007) investigated M&As in the pharmaceutical industry and 23
whether better numbers in productivity, return on investment (ROI) and operating 24
margin had been created after the deal. Three acquirers that participated in a 25
transaction in 1999 or 2000 were identified and included in their research, and a 26
comparative analysis was made in both the pre-M&A and post-M&A period. ROI, 27
productivity and operating margin were investigated five years before the M&A with 28
the following five years after the deal. The performance of the acquirers was 29
compared with three pharmaceutical firms that had not been involved in an M&A. 30
Based on these three parameters, Demirbag et al. (2007) did not find enough 31
12
Productivity was lower post-M&A compared with pre-M&A but also lower in 1
relation to the sample with companies that did not carry out a transaction. The study 2
showed also that the companies that carried out M&As did not have a higher ROI 3
after the transaction compared to before. Furthermore, when it comes to operating 4
margin this was better post-M&A than pre-M&A but the same as the comparable 5
peers. What can be criticised in their study is whether the scarce sample size of only 6
three acquiring companies is enough for reliable results. They are, however, doing a 7
more qualitative study where they compare it with other pharmaceutical companies 8
that are not performing an M&A. But by only analyzing three acquirers they are still 9
facing the risk of not representing the broader population. 10
11
Ferrer (2012) tried to determine the causal relationship between an M&A and the 12
acquiring firm's profitability. 259 companies on the Philippine stock exchange were 13
covered between the years 2006 - 2010 and the covered companies were found in 14
numerous different sectors. The companies were analyzed using two linear 15
regressions to obtain evidence of whether M&As increase or decrease the ROE of the 16
acquirer. The result Ferrer (2012) received was significant and shows a clear 17
negative correlation between M&As and the acquirer’s ROE. This means that an 18
M&A damages a company's financial position rather than making it better. ROA was 19
also investigated but due to an insignificant p-value no clear conclusion could be 20
drawn and thus no empirical evidence exists that mergers and acquisitions harm a 21
company’s ROA in the Philippines (Ferrer, 2012). However, one can question to 22
what extent M&A-results from developing countries like the Philippines can be 23
generalized to developed countries, especially the Scandinavian countries. 24
25
Fatemi et al. (2017) investigated by an event study M&As in Japan from 2000 to 26
2014. They looked at, among other things, the long-term wealth effect for listed 27
companies that acquired a non-public company. They looked at the acquired 28
company’s pattern of abnormal returns over 5 years after the purchase was 29
completed. Their results showed that abnormal returns varied significantly during 30
the five years after the deal. Some significant wealth creation was not evident. 31
13
Therefore, Fatemi et al. (2017) concluded that these Japanese mergers and 1
acquisitions do not provide significant long-term benefits to the shareholders of the 2
acquired company. 3
4
Qian and Zhu (2018) used a sample of over 3500 US companies that have 5
participated in a deal between 1980-2013. The goal was to evaluate the efficiency of 6
capital deployment for acquiring firms and compare it with pre-and post-M&A 7
performance. This was made with the ratio return on invested capital (ROIC). Their 8
result showed that acquirers with higher ROIC before the deal have superior 9
operating performance after the M&A compared to acquirers with lower ROIC pre- 10
M&A. The companies with low ROIC before the deal, also underperform non- 11
acquiring peers in the post-M&A period. Lastly, the researchers also found evidence 12
that the relationship between pre-M&A ROIC and post-M&A performance is 13
weakened when CEO replacements occur after the deal. 14
15
Instead of looking at ROA, ROE, ROI or ROIC, Mikhalchuk (2020) looked at how 16
M&As impact the EBIT-margin of the companies participating in the deals. 17
Mikhalchuk looked at a seven-year period, three years before the deal and the 18
subsequent three years after the deal. 73 companies that participated in domestic 19
Russian deals were observed during the period 2012 - 2019. In this study, as a goal 20
to ensure that only the idiosyncratic development of the companies participating in 21
the acquisitions was examined, its development was compared with a portfolio of 22
similar companies that were not a part of any deal. The result showed that M&As led 23
to an increase in the operating profit margin of 4.6% compared to 2.5% for the 24
benchmark portfolio. The highest operating profit margin for the companies 25
involved in a deal relative to the benchmark portfolio was after 2 years. Mikhalchuk 26
(2020) concluded that there exists a significant positive effect from M&As on 27
operating profit margin in domestic deals in Russia. 28
14
2.3 ESG performance after mergers and acquisitions 1
Most academic studies on socially responsible investment cover how the financial 2
world is in need for Environmental, Social and Governmental (ESG) factors and not 3
why sustainable investments are commercially advantageous. Several attempts have 4
been made to define ESG and sustainable investments. In summary, ESG factors are 5
considered to be in the interest of the public, affecting the wellbeing of people, 6
society and the environment (Cherneva, 2012). Overall, there is a growing interest 7
in ESG activities carried out by companies. Environmental (E) involves the activities 8
a company perform that have positive consequences for the environment. Social (S) 9
means that you work actively to treat all stakeholders, everything from customers, 10
employees to shareholders equally and in line with the social ecosystem. Lastly, 11
Governance (G) is according to Limkriangkrai et al. (2017) a control mechanism in 12
connection with corruption, bribery and internal control. Active corporate 13
governance is often important for the organization's development while providing 14
long-term benefits to society. 15
16
Companies’ focus on ESG is important as investors and stakeholders might see a 17
poor ESG focus as a major risk for the organization (Limkriangkrai et al., 2017). 18
Coleman et al. (2010) wrote as early as 2010 that ESG perspectives for a firm are 19
starting to play a bigger role for an investor's investment decision. Limkriangkrai et 20
al. (2017) continued by claiming that shareholders often look at the ESG-rating as a 21
whole. However, they also argued that there are many cases where a company has 22
high commitment and participation around environmentally-friendly activities but 23
may be less enthusiastic about governance or social aspects. 24
25
Some of the few studies done on how ESG parameters are affected by M&As are the 26
ones from Aktas et al. (2011), Fatemi et al. (2017) and Tampakoudis and 27
Anagnostopoulou (2020). Aktas et al. (2011) concluded, based on a sample of 106 28
deals between 1997-2007, that the environmental and social performance of the 29
acquirer is improved as a result of having acquired a company that is active within 30
social responsible investments (SRI). They used Innovest’s intangible value 31
15
had both the acquirers and target rankings available. As we saw in the previous 1
section, Fatemi et al. (2017) investigated how the financial situation looked like for 2
Japanese deals but in their report, they also looked at how the ESG performance of 3
the buyer was affected by the deal. They did apply the same time frame of the 4
subsequent five years after the M&A to the ESG parameters as well. The 5
performance of the three various ESG parameters all showed an increase in the first 6
years followed by a decrease and a worsened performance in years four and five. 7
With this result, Fatemi et al. (2017) concluded that there is no long-term positive 8
effect of ESG performance as a result of an M&A, at least not in Japan. 9
10
More recently, Tampakoudis and Anagnostopoulou (2020) examined the effect of 11
mergers and acquisitions on ESG performance for companies in Europe. The aim 12
was to investigate whether companies' ESG performance can be improved by 13
acquiring other companies that are considered to have a high ESG-ranking. 100 14
European M&A cases during the period 2003-2017 were examined and the results 15
were similar to the one found by Aktas et al. (2011). Namely, that if the acquirer buys 16
a company that has higher ESG performance than itself, it leads to a better ESG 17
performance in the post-M&A stage for the buyer. Furthermore, Tampakoudis and 18
Anagnostopoulou (2020) also claimed that when the ESG performance increased 19
for the buyer, its market value also increased. 20
21
2.4 Linking gender diversity to ESG 22
According to Manita et al. (2018) gender diversity has for an extended time been a 23
subject within ethics and whether it is ethically accepted to exclude something 24
because of its gender. At the same time, demanding stakeholders have demanded 25
increased transparency within this area. European Commision (2001) presented a 26
vision for corporate social responsibility (CSR), “whereby companies integrate 27
social and environmental concerns in their business operations and in their 28
interaction with their stakeholders on a voluntary basis” (p. 6). Manita et al. (2018) 29
16
into a company’s ESG performance and created the link that was demanded by 1
stakeholders. 2
3
According to Nadolska and Barkema (2014) the topic of gender diversity’s effect on 4
M&As was not, at the time, particularly explored and had not received much 5
attention in the literature. Although, Parola et al. (2015) made a study on 6
management gender diversity and its effects on M&A process performance. The 7
purpose of their article was to evaluate if gender diversity affects M&A performance 8
or not. With a sample of 310 domestic acquisitions made in the U.S between 2004 - 9
2009, a multiple regression analysis was used to test the variables' different effects 10
on the process performance. Parola et al. argued that there is evidence of positive 11
benefits of having females in the management team in the pre-M&A period but a 12
negative effect in the post-M&A period. The authors continued by claiming that 13
there are various effects of gender diversity but that their results still highlight the 14
value of gender diversity of top management teams in the M&A process. 15
16
Ossorio (2020) evaluated board gender diversity and its effect on M&As performed 17
by public listed European companies. This was made with the variable if the deal 18
was domestic or not, and by a rate explaining females per male on the board. The 19
sample included 128 M&A deals during the period of 2015-2017. Regulations and 20
the overall business community have urged for the reduction of the gender gap on 21
boards of directors. Ossorio argues that the findings of his study have several 22
consequences for stakeholders and decision-makers. First of all, the study confirms 23
that there exists a significant effect on firms’ strategic decisions if there are female 24
directors on the board. Companies are better at avoiding risky transactions and do 25
not at the same extent overvalue the target company’s synergies. The second 26
implication Ossorio (2020) draws from his result is that shareholders should 27
become more aware of the clear noteworthy impact female directors have on growth 28
strategies and thus more carefully evaluate the selection of each member on the 29
board. Lastly, there were also significant evidence that female presence on the board 30
increase the company’s likelihood to acquire a target firm operating in the same 31
17
2.5 Reflection on related literature and hypothesis development 1
Looking upon the reviewed literature, some things are worth reflecting upon. First 2
of all, several studies provide evidence that M&As do not always increase the 3
financial performance of the acquirer (Qian & Zhu, 2018; Fatemi et al., 2017; Ferrer, 4
2012; Demirbag et al., 2007; Knapp et al., 2005; Mudde & Brush, 2004; Bruner, 5
2002). 6
7
Firstly, with Mudde and Brush (2004) examining deals in the 90s, one interesting 8
reflection that can be made is whether the results would differ from more modern 9
transactions. Furthermore, Knapp et al., (2005) claimed it is more difficult to merge 10
when the target company is large in relation to the buyer which is something that 11
can be further analyzed since if a large transaction succeeds the positive synergies 12
must be larger as well. Qian and Zhu (2018) stated M&A performance is weakened 13
when CEO replacement occurs after the deal. However, for some companies, there 14
may be other decision-makers who influence the process and deal at least as much 15
as the CEO, which might be worth investigating. The reflection upon Fatemi et al. 16
(2017) could indicate the same generalization as Ferrer (2012), namely if there 17
would be any differences in the result depending on geographical location, 18
Scandinavian locations in particular. Mikhalchuk (2020) was one of the few studies 19
that indicated that M&As are financially sound for the acquirer. The study was also 20
one of the few stating explicitly if the deals evaluated were domestic or foreign. 21
However, Mikhalchuk only looked upon domestic deals and it is uncertain if the 22
result would have been the same for foreign deals. Due to the lack in separating 23
domestic and foreign deals in previous related research, an interest in comparing 24
these two occurs. At the same time, the focus on the Russian market might also leads 25
to the same critical issue on generalisation as with Ferrer (2012) and Fatemi et al. 26
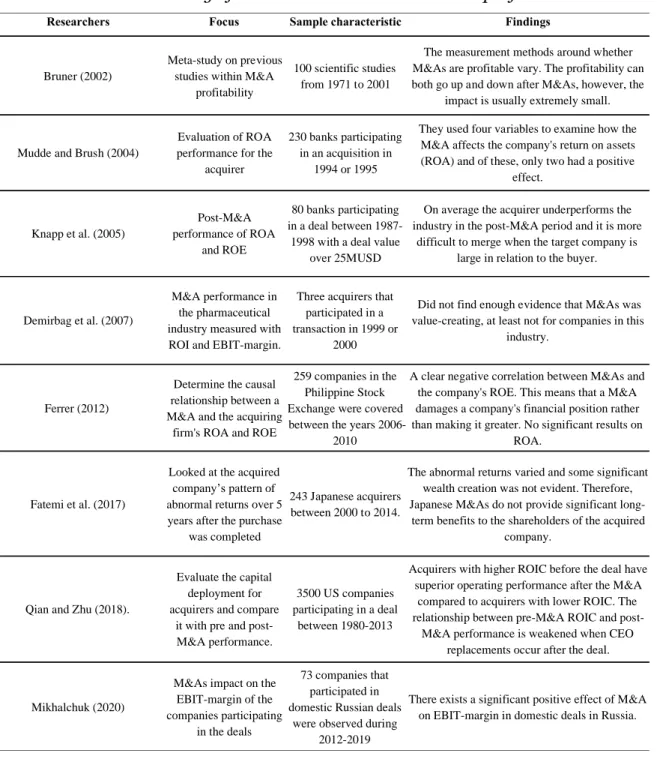
(2017). A summary of the related literature within M&A performance is provided in 27
table 1. 28
29 30 31 32
18
Table 1 - Summary of related literature within M&A performance 1
2 3 4 5 6 7 8
littaratur on M&A performance
Researchers Focus Sample characteristic Findings
Bruner (2002)
Meta-study on previous studies within M&A
profitability
100 scientific studies from 1971 to 2001
The measurement methods around whether M&As are profitable vary. The profitability can both go up and down after M&As, however, the
impact is usually extremely small.
Mudde and Brush (2004)
Evaluation of ROA performance for the
acquirer
230 banks participating in an acquisition in
1994 or 1995
They used four variables to examine how the M&A affects the company's return on assets (ROA) and of these, only two had a positive
effect. Knapp et al. (2005) Post-M&A performance of ROA and ROE 80 banks participating in a deal between 1987-1998 with a deal value
over 25MUSD
On average the acquirer underperforms the industry in the post-M&A period and it is more
difficult to merge when the target company is large in relation to the buyer.
Demirbag et al. (2007)
M&A performance in the pharmaceutical industry measured with ROI and EBIT-margin.
Three acquirers that participated in a transaction in 1999 or
2000
Did not find enough evidence that M&As was value-creating, at least not for companies in this
industry.
Ferrer (2012)
Determine the causal relationship between a M&A and the acquiring
firm's ROA and ROE
259 companies in the Philippine Stock Exchange were covered between the years
2006-2010
A clear negative correlation between M&As and the company's ROE. This means that a M&A damages a company's financial position rather than making it greater. No significant results on
ROA.
Fatemi et al. (2017)
Looked at the acquired company’s pattern of abnormal returns over 5 years after the purchase
was completed
243 Japanese acquirers between 2000 to 2014.
The abnormal returns varied and some significant wealth creation was not evident. Therefore, Japanese M&As do not provide significant
long-term benefits to the shareholders of the acquired company.
Qian and Zhu (2018).
Evaluate the capital deployment for acquirers and compare
it with pre and post-M&A performance.
3500 US companies participating in a deal
between 1980-2013
Acquirers with higher ROIC before the deal have superior operating performance after the M&A
compared to acquirers with lower ROIC. The relationship between pre-M&A ROIC and
post-M&A performance is weakened when CEO replacements occur after the deal.
Mikhalchuk (2020)
M&As impact on the EBIT-margin of the companies participating
in the deals
73 companies that participated in domestic Russian deals
were observed during 2012-2019
There exists a significant positive effect of M&A on EBIT-margin in domestic deals in Russia.
19
Roll (1986), Berkovitch and Narayanan (1993), and DePamphilis (2018) wrote about 1
Hubris Hypothesis and how it leads to overestimating anticipated synergies from a 2
transaction. However, the confusion is vast regarding the hypothesis, which is 3
confirmed by Park and Yoo (2017) who stated it needs to be more clearly defined. 4
Aktas et al. (2011) and Tampakoudis and Anagnostopoulou (2017) claimed ESG- 5
ranking of the acquirer is increased if they acquire a target company with a high 6
ranking. However, the reflection that can be made on this is that companies with 7
available ESG-rankings might be those of a bigger size. On the flip side, Fatemi et 8
al. (2017) meant that there exist no long-term positive effects on ESG performance 9
as a result of M&As. Manita et al. (2018) linked the topic gender diversity to ESG 10
and Parola et al. (2015) claimed there exists positive benefits of having females in 11
the management team in the pre-M&A process but not post-M&A. However, Ossorio 12
(2020) states that with females on the board there is less risk of overestimating 13
synergies. As a reflection, this could indicate that females are less likely to suffer 14
from hubris hypothesis. Ossorio (2020) also claimed with females on the board 15
there is a higher probability of domestic transactions. This result may be linked to 16
the degree of risk-aversion of the genders, if one considers that foreign transactions 17
come with more risk. A summary of the related literature within hubris, ESG and 18
gender diversity is provided in table 2. 19
20 21 22 23 24 25 26 27 28 29 30 31 32
20
Table 2 - Summary of related literature within Hubris, ESG and gender 1
diversity 2
3 4
Based on our reflection from the reviewed literature and the purpose of our thesis 5
these general hypotheses are of interest: 6
7
H1: Certain key metrics are higher after an M&A for the acquirer 8
9
H2: The key metrics are correlated with certain internal non-financial values 10
11 12 13 14
litteratur on ESG, gender and hubris
Researchers Focus Sample characteristic Findings
Roll (1984), Berkovitch and Narayanan (1993),
DePamphilis (2018).
Hubris Hypothesis Conceptual analysis
Hubris Hypothesis occurs when the acquirer believes that their own valuation of a company is more accurate than the market. This means in the end that they often pay too much
due to overestimating synergies.
Park and Yoo (2017) Hubris Hypothesis Conceptual analysis
There is a confusion regarding the hubris hypothesis and it needs to be more clearly defined as it could prove to be
whether antecedent or a consequence of events.
Aktas et al. (2011)
Is the ESG ranking of the acquirer affected when participating in an M&A
Sample of 106 deals between 1997-2007
The environmental and social performance of the acquirer is improved as a result of having acquired a company that is
active within social responsible investment (SRI).
Fatemi et al. (2017)
Evaluating the ESG performanc of the acquirer after an M&A
243 Japanese acquirers between 2000 to 2014.
The ESG parameters all showed an increase in the first years after the M&A followed by a decrease and a worsened performance in years four and five. Thus, they concluded that there is no long-term positive effect on ESG
performance as a result of an M&A.
Tampakoudis and Anagnostopoulou
(2020)
Is ESG performance improved by acquiring other companies that are
considered to have high ESG ranking?
100 European M&A cases during the period
2003-2017
If the acquirer buys a company that has higher ESG performance than itself, it leads to a better ESG performance in the post-M&A stage for the buyer.
Parola et al. (2015)
Management gender diversity and its effects on
M&A process performance
310 domestic acquisitions made in the
U.S between 2004 - 2009
There is evidence of positive benefits of having females in the management team in the pre-M&A period but a
negative effect in the post-M&A period.
Ossorio (2020)
Board gender diversity and its effect on acquisitions performed by
public listed European Companies
128 M&A deals during the period of 2015-2017
With females on the board, companies are better at avoiding risky transactions and do not at the same extent overvalue
the target company’s synergies. Female presence on the board also increases the company’s likelihood to acquire a
21
3
Methodology and empirical method
12
The third chapter provides an overview of the methodological foundations. Firstly, 3
an overview of the formal research methodology is presented. Secondly, a detailed 4
description of the process in generating our unique dataset and specified 5
hypothesis is given. The chapter then concludes with a thorough description of our 6
chosen statistical tests and an evaluation of our method. 7
8
3.1 Research methodology 9
To justify the purpose of our report and investigate whether M&As affect the 10
acquirers’ financial performance and ESG-score in a negative or positive manner, a 11
quantitative positivistic exploratory research approach will be used. Bryman and 12
Bell (2011) explain that there exist three different philosophical methods to use, 13
positivism, realism and interpretivism. In addition to the data, a positivistic 14
research approach circles around both the objective and quantitative methods. 15
Bryman and Bell (2011) state that the positivistic method consists of both inductive 16
and deductive procedures. The deductive way is considered to be the most frequent 17
in research theory and is carried out when researchers base their hypothesis on what 18
is already acknowledged within the research issue. 19
20
The quantitative research approach we will embrace in our study is characterized by 21
assembling numerical data. The data is often analyzed in a statistical program such 22
as SPSS where a statistical test is performed (Bryman & Bell, 2011). However, even 23
if our positivistic approach will contribute to established research, our methods will 24
also be of an exploratory character, since we intend to create a unique set of data. 25
According to Bryman and Bell (2011), exploratory studies tend to be shown as 26
introductory research prior to large studies to find premises for upcoming 27
investigations. Consequently, our quantitative exploratory research approach will 28
22
second-degree data and the foundation will be our own created dataset but its basis 1
will be formed from what is already identified from previous studies. 2
3
The process of transforming abstract parameters into measurable, to test the 4
relationship between concepts, entails risks. Bryman and Bell (2011) mean there is 5
always a risk that the chosen variables do not truly represent the area of interest. 6
Even though using old research as reference points there is often individual 7
judgment involved in the process. Bryman and Bell (2011) continue with claiming 8
that there is also a risk that the relationship between two variables in the 9
quantitative dataset is correlated to a third variable. 10
11
3.2 Research design and method 12
3.2.1 Deal characteristics 13
14
The first step in our process of analysing M&As in accordance with the purpose of 15
this report was to develop a dataset of M&A deals. Our deal characteristics were: 16
17
(1) Publicly listed Scandinavian acquirers 18
(2) Target firms within Europe 19
(3) The acquirer should acquire 100% of the target company 20
(4) Deal size of at least 10 million USD 21
(5) The deal should be executed between January 1st 2010 and December 31st 2017 22
23
We decided to narrow the nationality of the acquirer to be based within Scandinavia 24
since this market is rather homogeneous, but also since there is a remarkable lack 25
of previous research within Scandinavian acquirers. We first made an overview of 26
the data available for only Swedish acquirers, but came to the conclusion that it was 27
too scarce and therefore Scandinavian acquirers were more reasonable. Partially 28
due to lack of previous studies within these geographical areas but also since it gave 29
a larger amount of data. For the target company, we decided to narrow the 30
23
we would have constricted our area to the Scandinavian borders alone. We also 1
wanted to evaluate the difference between domestic and foreign deals, and not only 2
foreign deals within Scandinavia as those cultures are rather equal compared to a 3
target company in southern Europe. 4
5
In the article, by Knapp et al. (2005), they are using a lower limit in the deal size of 6
25 million USD. This lower limit acted as a starting point for our data gathering but 7
as we saw that a lot of smaller deals got excluded that were below 25 million USD 8
we had to tweak the limit until we found a big enough dataset of deals. Furthermore, 9
the nominal size of a deal is not of high importance. For example, a 25 million USD 10
deal could be huge for a small company with a market capitalization of 100 million 11
USD but negligible for a company with a market cap above 1 trillion USD. Therefore, 12
we set a lower limit of 10 million USD as that generated a sufficient number of deals 13
for Scandinavian acquirers as well as being acceptably in line with previous studies. 14
15
We were interested in looking at the effect of a “pure” M&A. What we mean by this 16
is that we are disregarding companies that buy a portion of a company and we are 17
only taking deals that are done on a 0-100% basis. This is because the synergies 18
created by the M&A transaction should be new to the acquirer and not something 19
that is only partially developed due to previous ownership of the targeted company. 20
The deals of interest were only fully completed M&A transactions, hence, all 21
transactions in which there is a definitive status of completion from both parties. 22
Having a specific limit of how much the acquirer is allowed to own before the deal 23
and a requirement of purchasing at least 100% is something that both Aktas et al. 24
(2011) and Parola et al. (2015), but also Fatemi et al. (2017) have in their studies. 25
26
Lastly, we have only considered deals executed between 2010-2017 as this is a period 27
without any major economic distress or crisis. This non-turbulent time period acts, 28
in our assessment, as a good measuring frame to see the true modern effect of what 29
we are researching without the disturbing data that a crisis might bring. However, 30
for M&A transactions happening in 2017 there will be an effect from the Covid-19 31
24
in activity in 2020. There will also be an effect from the 2008 crisis in the pre-M&A 1
period for the deals that were executed in 2010 and 2011. This is although something 2
that will be taken into account with the help of a market volatility variable, when 3
performing the statistical analyzes to adjust for the negative effect. 4
5
3.2.2 Time frame 6
7
According to previous research, it is typical to analyze the period before and after 8
the M&A within a certain time frame. According to DePamphilis (2018), the time 9
frame of an analysis should be three to five years as this is the time frame needed to 10
see tendencies of the synergies created and the value they bring. This is something 11
that is agreed upon by previous studies (Mikhalchuk, 2020; Fatemi et al., 2017; 12
Demirbag et al., 2007; Knapp et al., 2005). DePamphilis (2018) also argued that the 13
longer the time frame of the post mergers measurement the more likely it becomes 14
that other factors are affecting the fundamental numbers of the company. With this 15
in mind, we agreed upon using the time frame of three years post mergers as well as 16
looking at the three years prior to the merger in order to obtain a dataset with 17
comparable numbers before and after the deal. Thus, even if the deals we evaluated 18
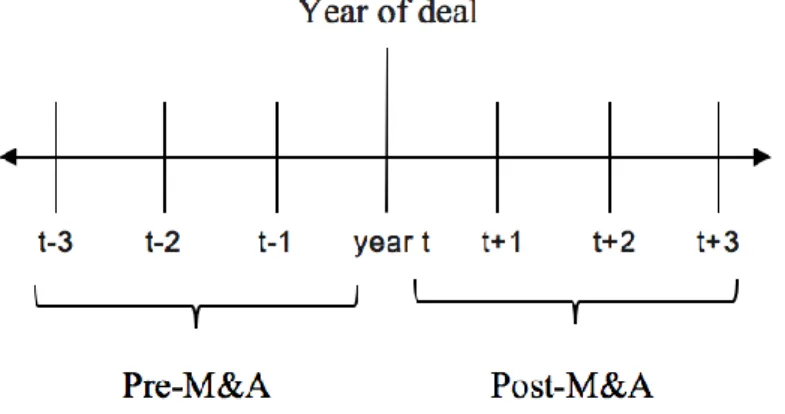
took place between 2010-2017 the investigated period became 2007-2020 as this 19
included three-year pre-M&A for the deal in 2010 and three-year post-M&A for the 20
deals in 2017. Our time frame around the year of the deal can be seen in figure 1. 21
22
Figure 1: Timeline of our years of interest around the deal 23
24 25 26
25
3.2.3 The gathering of deals 1
2
Our dataset of acquirers participating in deals, which were in line with our 3
characteristics, was collected with the help of Thomson Reuters Eikon. The initial 4
observation covered 195 public Scandinavian companies that had done an M&A 5
transaction between 2010 and 2017. For these companies, the deal size was above 6
10 million USD and had been completed in full and they had acquired no less than 7
100% of the targeted company. The dataset was then narrowed down by removing 8
non-applicable companies that were not relevant to our dataset. Just like Knapp et 9
al. (2005) removed companies that made more than one transaction during their 10
observed period, we removed acquirers that made more than one M&A during our 11
observed period. From the initial sample size, there were 34 companies participating 12
in multiple M&A transactions during the measured time period. Why these were 13
discarded was because of the desire to have a uniform dataset where no company 14
was allowed to have more than one transaction within the full seven-year time 15
period in order to avoid any potential inter-disturbance between two or more M&A 16
transactions in the same company. 17
18
Furthermore, there were 28 companies that had been delisted post-M&A which 19
made the collection of all necessary data not feasible. In addition to this, there were 20
28 companies where the acquiring company had made the transaction with a target 21
company outside of Europe and as we are only interested in analyzing data within 22
Europe these were removed. For 11 companies, we found that the acquiring party 23
had been in an M&A transaction after the deal where it acted as the target company 24
and thus, those companies had to be excluded from the sample as well. Before 25
arriving at the final sample size, we had to remove 10 companies where data was 26
partially or fully missing as well as one company that had been the victim of 27
bankruptcy. This process generated a final sample size of 83 companies that were in 28
line with our set out interests. Of these 83 companies, we saw 48 deals being 29
domestic and 35 deals being foreign. A detailed table of our reasons for exclusion 30
and how our final sample eventually was created can be seen in table 3 below. 31
32 33
26
Table 3: Excluded companies and the final sample of deals 1
2 3
The most common global industry classification standard (GICS) sector among our 4
final dataset of acquirers is the industrial sector with 28 firms. Consumer staples are 5
the least frequent GICS sector with only 3 acquisitions. Furthermore, our dataset 6
has as many as 24 deals carried out in 2017 and five deals carried out in 2010. The 7
mean deal size is pending between 33,2 million USD in 2015 to 594,8 million USD 8
in 2017. Lastly, the GICS sector with the highest average deal size is the materials 9
sector with 982,3 million USD as the mean deal size. With our descriptive tables, we 10
can also conclude that among our Scandinavian acquirers, Sweden is the most 11
popular nation of acquirers and Denmark the least frequent nation of acquirers. 12
More detailed information about our dataset of deals can be seen in table 4, 5 and 6 13
below. The deals in our final sample sorted after target nation as well as a complete 14
list of all included companies are provided in appendix A1. 15
16
Table 4: The deals in our final sample sorted after GICS sector 17
18 19 20
GICS Sector Number of deals executed
Mean deal size (million USD) SD Minimum (million USD) Maximum (million USD) Communication Services 4 314,0 431,642 12,2 934,6 Consumer Discretionary 6 90,2 101,024 20,4 289,0 Consumer Staples 3 94,3 559,590 25,2 198,0 Energy 7 733,1 821,427 15,7 2000,0 Financials 6 332,3 509,155 24,9 1344,8 Health Care 8 97,6 197,158 11,3 584,1 Industrials 28 326,8 849,082 11,7 4292,8 Information Technology 8 37,3 26,198 12,0 95,0 Materials 8 982,3 1171,833 11,3 2863,7 Real Estate 5 303,8 442,909 28,9 1083,0