Faculty of Education and Economic Studies
Department of Business and Economic Studies
The impact of club card on store loyalty
- An empirical study of a Swedish grocery retailer
Sofia Ahlström
Niklas Wangsell
January 2014
Second Cycle
Supervisor:
Aihie Osarenkhoe
Acknowledgement
We would like to thank our supervisor Aihie Osarenkhoe for his commitment to this study. Without his advice and counseling this study would not have been possible. We would also like to thank all of the respondents for answering our survey.
Sofia Ahlström and Niklas Wangsell Gävle, Sweden 2014
ABSTRACT
Title: The impact of club card on store loyalty – An empirical study of a Swedish grocery
retailer
Level: Master thesis in Business Administration Authors: Sofia Ahlström and Niklas Wangsell Supervisor: Aihie Osarenkhoe
Examiner: Maria Fregidou-Malama Date: 2014- January
Aim: The aim of this study is to investigate whether club card loyalty have an impact on
customers store loyalty. A secondary purpose is to distinguish which attributes of a loyalty card that ICA’s customers prefer, with the focus on the variables; direct- versus indirect rewards, monetary- versus nonmonetary rewards, necessary- versus luxury rewards and immediate- versus delayed rewards.
Method: A survey with 20 questions was constructed with the help of previous research
made in the field of loyalty. The data was collected outside ICA Maxi, the largest ICA store in a city in Sweden with approximately 100.000 citizens. A random sample was used and each 5th person that walked by was asked to participate. A total of 282 individuals were asked, and 114 were willing to participate. The data was analyzed with the help of the statistical analyze program SPSS, a correlation- and cluster analysis were made.
Results and conclusions: A substantial finding in the study was a positive correlation
between both behavioral- and attitudinal aspects of loyalty with club card loyalty. A positive correlation between behavioral loyalty and club card loyalty were 0.305, compared to a positive correlation of 0.292 between attitudinal loyalty and club card loyalty. The types of rewards were in line with previous research, however the findings of the timing of reward was contrariety to previous research since the respondents preferred delayed rewards.
Suggestions to further research: A comparison between two different loyalty programs
would give an enhanced perception of what the Swedish customers actually prefer. Since the lack of consensus exists, more similar studies need to be done to fill this gap.
Contribution of thesis: The thesis adds a small piece of the puzzle to the subject loyalty
programs in the Swedish market. It also gives ICA the opportunity to evaluate their program and suggestions are made on how to improve their loyalty program.
Keywords: loyalty, loyalty programs, customer loyalty, club card, behavioral loyalty,
Table of Contents
1.0 Introduction ... 7
1.1 Background ... 7
1.2 Purpose and research question ... 9
1.3 Limitations ... 9 1.4 Disposition ... 9 2.0 Theoretical discussion ... 11 2.1 Loyalty ... 11 2.1.1 Behavioral Loyalty ... 12 2.1.2 Attitudinal Loyalty ... 13
2.1.3 Club card loyalty ... 14
2.2 Type of rewards ... 16
2.2.1 Direct- versus indirect rewards ... 16
2.2.2 Monetary- versus non-monetary rewards ... 17
2.2.3 Necessary- versus Luxury rewards ... 17
2.3 Timing of rewards ... 18
2.3.1 Immediate versus delayed rewards ... 18
2.4 Reflections on the theoretical discussion ... 19
3.0 Methodology ... 21
3.1 Epistemological and ontological considerations ... 21
3.2 Research method for the present study ... 22
3.2.1 Approach ... 22
3.2.2 Data collection and respondent selection ... 23
3.2.3 Selections of scales ... 24
3.3 Research strategy ... 25
3.4 Tools for statistical measurement ... 27
3.4.1 Pearson’s Correlation ... 27
3.4.2 Cluster analysis ... 27
3.5 Reliability and validity ... 28
3.6 Possible methodology errors ... 29
3.6.1 Errors in quantitative research ... 29
3.6.2 Errors in survey research ... 30
3.7 Ethical considerations ... 30
4.0 Empirical findings ... 31
4.1 ICA Loyalty program ... 31
4.2 Result ... 32
4.3 Measurements of store loyalty ... 34
4.3.1 Behavioral Loyalty ... 34
4.3.2 Attitudinal Loyalty ... 36
4.4 Type of rewards ... 38
4.4.1 Direct vs. Indirect rewards ... 38
4.4.2 Monetary vs. Nonmonetary rewards ... 39
4.4.3 Necessary vs. Luxury rewards ... 40
4.5.1 Immediate vs. Delayed rewards ... 41
5.0 Analysis ... 42
5.1 Correlation Analysis ... 42
5.1.1 Behavioral Loyalty ... 42
5.1.2 Attitudinal Loyalty ... 43
5.1.3 Type and timing of rewards ... 44
5.2 Cluster Analysis ... 47
5.3 Summary of the analysis ... 51
6.0 Conclusion ... 52
6.1 Answering the research questions ... 52
6.2 Managerial, societal and theoretical implications ... 53
6.3 Critical reflections of our study ... 54
6.4 Proposal to further research ... 54
References ... 55 Appendices ... 59
Table of Figures
Figure 1. A disposition of the present study ... 10
Figure 2. Relationship between club card loyalty and behavioral- and attitudinal loyalty ... 20
Figure 3. Type- and timing of rewards ... 20
Figure 4. Correlation guidelines ... 27, 33 Figure 5. Number of clusters and respondents ... 28
Figure 6. Reliability Statistics ... 28
Figure 7. Bryman and Bells’s four sources of error in social survey research ... 30
Figure 8. ICA and ICA’s competitors market shares in the Swedish market ... 31
Figure 9. Question 1 ... 34 Figure 10. Question 9 ... 35 Figure 11. Question 16 ... 35 Figure 12. Question 3 ... 36 Figure 13. Question 12 ... 36 Figure 14. Question 17 ... 37 Figure 15. Question 4 ... 38 Figure 16. Question 5 ... 38 Figure 17. Question 15 ... 39 Figure 18. Question 14 ... 39 Figure 19. Question 11 ... 40 Figure 20. Question 10 ... 40 Figure 21. Question 7 ... 41 Figure 22. Question 6 ... 41
Figure 23. A revised version of figure 2 ... 42
Figure 24. A revised version of figure 3 ... 44
Figure 25. Cluster 1 ... 48
Figure 26. Cluster 2 ... 48
Figure 27. Cluster 3 ... 49
Figure 28. Cluster 4 ... 50
1.0 Introduction
This chapter intends to introduce the complete purpose with this study. The background, the aim and the research questions will be explained, as well as the limitations that have been made. Lastly, a disposition figure is presented to give an overall picture of how this study is structured.
1.1 Background
The availability of new and creative technologies gives companies the possibility to develop new tactics to implement their CRM initiatives. Customer loyalty programs is one of the tactics that companies has adapted since loyalty is an important key to an organizational success and profit (Lack, 2000) and are critical in conducting business in todays competitive marketplace (Komunda and Osarenkhoe, 2012). According to McIlroy and Barnett (2000, p. 348) loyalty can be described as “customer’s commitment to do business with a particular organization, purchasing their goods and services repeatedly, and recommending the services and products to friends and associates”
In the 1970ies, European researchers found that a business that have a close relationship with their customers simply have “better” customers, since loyal customers are more profitable to a firm (Dowling & Uncles, 1997). Selin et al., (1988) states: “that those customers that demonstrate the greatest level of loyalty toward the product, and service activity, tend to repurchase more, and spend more money” (cited in Divett et al., 2003, p. 109). Loyal customers can even become business builders if they tend to be loyal to a company over time; they are buying more, paying higher prices and generating new customers through positive word of mouth (O´Brien and Jones, 1995). “It has been estimated that attracting a new customer is three to five times more costly than retaining an existing customer” (Jang and Mattila, 2005, p. 402).
Demoulin and Zidda (2009) state that a way for retailers to retain customers is to implement a loyalty program, where the loyalty card scheme is a common tool. Retailers invest in customer loyalty programs to affect customer value as well as increase value for the firm (Demoulin and Zidda, 2009). The same study mentions that there are three purposes to why firms normally use loyalty cards: retaining customers, increase their loyalty and collect data about their customers shopping behavior. Additionally, Dowling and Uncles (1997) mention six reasons as why business chooses to engage in loyalty programs: to preserve sales, margins and profit; enhance loyalty and value for the existing customer; evoke existing
customer’s cross-product sale; diverse the brand from competitors brands; preempting the entry of a new (parity) brand; and finally preempting the competitors to introduce a similar loyalty program. The largest grocery retailers in Europe chose to implement loyalty programs and loyalty cards in the 1990ies (Mauri, 2003) and more companies continued to follow the trend (O´Brien and Jones, 1995). In the Swedish market, three of the largest grocery retailers: ICA, COOP and Willy’s have implemented loyalty programs in their operations. ICA introduced the card and loyalty program in 1990 (“En kort väg till banken - ICA-historien,” 2014), COOP introduced their “Medmera-card” in 1993 (“En hållbar historia,” 2014) and Willy’s introduced their loyalty program as late as 2013 (“Willys lanserar lojalitetsprogram - Axfood,” 2014).
Since grocery retailers has been introducing loyalty programs for the last 23 years and are still doing it today, it suggests that the issue of loyalty cards are evolving and growing due to the fact that its adaptation is ongoing. The big question is whether it is effective or not. Previous studies have disagreed if loyalty programs and loyalty cards are effective since the outcome of different studies in this topic have diverged. Lal and Bell (2003) and Noordhoff et al. (2004) have found that loyalty programs do affect purchase behavior and therefore should affect the business profitability positive, while Sharp and Sharp (1997) and Mägi (2003) presented mixed results whether loyalty programs do generate any effect on purchase behavior and therefore has no effect on profitability. The fact of mixing evidence makes this subject an interesting topic to study since the outcome is hard to predict.
To succeed with creating a loyalty program that influences purchase behavior, previous researchers conclude that different factors need to be considered. Jang and Mattila (2005) studied what kind of rewards that customers prefer, while Keh and Lee (2006) researched which timing of the reward that customers prefer. Both concepts of timing and type of reward have previously been researched in the field of loyalty programs. Type of rewards refers to what kind of attributes the reward contains, whereas the timing is referred to when the rewards are available for the customers. The most common types of reward in previous studies are direct versus indirect, monetary versus non-monetary and necessary versus luxury, while timing of rewards include immediate versus delayed (Jang and Mattila, 2005; Dowling and Uncles, 1997; Rowley, 2007; Yi and Jeon, 2003).
Loyalty programs are an important topic today, especially in the retail business. On the Swedish market the amount of grocery stores has been cut in half between 1985 to 2010, and one out of ten is operating at a loss (“Grafik: Antal butiker i dagligvaruhandeln
1985-ones can therefore be crucial if the grocery store wants to gain and retain a stable profit. Our hopes are to contribute to a greater understanding in the field of loyalty cards in general and especiallyin the Swedish grocery retailer market. This study gives a greater understanding of the reward preferences of the Swedish customers.
1.2 Purpose and research question
The purpose of this study is to investigate whether club card loyalty have an impact on customers store loyalty. The grade of club card loyalty as well as store loyalty will be analyzed and compared with the help of a survey investigation. Additionally, the purpose is to distinguish which attributes of a loyalty card that customers prefer, with the focus on the variables; direct- versus indirect rewards, monetary- versus non-monetary rewards, necessary- versus luxury rewards and immediate- versus delayed rewards. This study will hopefully help grocery retailers to evaluate their loyalty programs and construct them to fit the preferences of the Swedish customers.
Our research questions state:
- Does club card loyalty have an impact on customers store loyalty? - Which attributes of a loyalty card do customers prefer?
1.3 Limitations
This study focus on four groups of reward attributes; direct versus indirect, monetary versus non-monetary, necessary versus luxury and immediate versus delayed. The study is limited to those reward attributes since these were most mentioned in research of loyalty programs in the grocery retail business. This study is also limited to the grocery retailer ICA in Sweden and focuses on the customers’ perspective.
1.4 Disposition
The study will be presented in the order that the below figure illustrates. Firstly a theoretical discussion is included to showcase all the relevant theories used. Secondly a chapter about the methodical choices made in the study is presented. After the methodology chapter our empirical findings will be presented both graphically and in text form. The analysis will follow where it is intended to compare the findings with the relevant theories. A conclusion chapter will follow with the main points highlighted and further discussed. Lastly suggestions for further research are presented.
Figure 1. A disposition of the present study (Source: Own construction) Theoretical
discussion Methodology Empirical @indings Analysis Conclusions
Suggestions for further
2.0 Theoretical discussion
Under the theoretical discussion the intention is to give an overall perspective of the subject loyalty and its subcategories behavioral loyalty, attitudinal loyalty and club card loyalty. The different types of rewards and timing of rewards that are relevant are explained as well. This chapter ends with a reflection on the theoretical discussion including our own models.
2.1 Loyalty
In line with Sharp and Sharp (1997), Leenheer et al. (2007, p. 32) define loyalty programs as “an integrated system of marketing actions that aims to make member customers more loyal”, while Yi and Jeon (2003, p. 231) define loyalty as “repeated purchases of particular products or services during a certain period of time”. McIlroy and Barnett (2000) explain that loyalty programs are often implemented to reward the customers for their patronage, when customers enter a lasting relationship with the organization. The customers often want to continue the relationship when they feel that they receive a better offer and a better value, than they would obtain from competitors (McIlroy and Barnett, 2000). In agreement with the previous statement, Dowling and Uncles (1997) claim, “loyalty programs must enhance the overall value for the product or service and motivate loyal buyers to make their next purchase” (cited in McIlroy and Barnett, 2000, p. 349)
With help of loyalty programs, managers can increase the share of the customers’ total purchase and increase customer satisfaction (Mägi, 2003). It is more costly for a company to attain new customers, than to get the current ones to purchase repeatedly, maintaining and developing the customers’ loyalty can therefore be seen as a sustainable competitive advantage (Dowling and Uncles, 1997). A loyalty program is often based on several assumptions:
1. Customers prefer a more engaged relationship with the products they purchased. (Yi and Jeon, 2003)
2. Some of the company’s customers show a tendency to be loyal. (Yi and Jeon, 2003) 3. There is a profitable group that buys the product/service. (Yi and Jeon, 2003)
4. The possibility to reinforce and enhance these customers loyalty through the loyalty program. (Dowling and Uncles, 1997)
A loyal customer is more profitable for firms and helps firms increase their revenue since they are generally buying more, paying premium prices and introduces new customers to the firm with the help of positive word of mouth (O´Brien and Jones, 1995). McIlroy and Barnett (2000) therefore argue that a loyal customer not only develops a long-term relationship with the firm, they also act as a cost-effective link for the firm. The authors continuing by discussing that satisfaction is an important factor for the loyal customer since the customer can be satisfied without actually being loyal, however loyalty cannot exist without satisfaction, a dissatisfied customer will never return. The customer will be satisfied if their expectations are met, the degree of loyalty is shown by the customers involvement and their grade of repurchase behavior (McIlroy and Barnett, 2000).
Previous studies in the field of loyalty have shown that the aim of creating a loyalty program is to implement a win-win situation for the company and its customers, with the help of rewards and participation in these loyalty programs customers will have no negative experiences (Sharp and Sharp, 1997). Stauss et al. (2005) do however mention, in contrast to Sharp and Sharp (1997) that some customers have shown frustration against the loyalty programs, three of the reasons mentioned are:
1. If the customer does not receive the promised reward.
2. If the customer needs to add material and mental cost in order to enjoy the reward. 3. If the customer feels that he or she are treated differently in a negative context
compared to other customers.
Few firms are systematically evaluating their loyalty programs if they are truly achieving their goals with creating value for the customer, while those firms who do not evaluate their programs may never discover the problems the can occur for the customers in the loyalty program context (Stauss et al., 2005).
2.1.1 Behavioral Loyalty
In the late 1970ies loyalty was originally conceived in behavioral terms where loyalty was typically examined through the customers repeat purchase behavior (Bridson et al., 2008). Demoulin and Zidda (2009) takes this notion even further by explaining that earlier studies in customer loyalty field were strictly considered to have the characteristics of repeated purchase patterns and high shopping frequency.
The behavioral dimension of loyalty has been researched numerous times and consists mainly of two elements: repeat purchase and word of mouth behaviors (Bridson et al., 2008; Leenheer et al., 2007; Sharp and Sharp, 1997). In a study on customer loyalty in the grocery retailing business, Leenheer et al. (2007) key dependent variable to capture behavioral loyalty is characterized by a high repeat-purchase behavior. Sharp and Sharp (1997) explains that certain loyalty programs that emphasizes on building repeat-purchase behaviors operates very differently from other marketing efforts and therefore differ from the likes of marketing campaigns and sales promotions. An increased repeat-purchase loyalty can form a closer relationship with customers that allows the company to increase the knowledge about its customers needs and wants, thus being able to supply better service at a substantial lower cost (Sharp and Sharp, 1997).
Interestingly Noordhoff et al. (2004) found that there are differences on the impact that behavioral loyalty has on club card loyalty between Singapore and The Netherlands. In the study, Noordhoff et al. (2004) could not find a significant correlation in The Netherlands although the researchers did find a significant correlation in Singapore. In Sharp and Sharp (1997) study their results points to that an effective loyalty program should have an impact on purchase behavior. The study also found that it is clearly possible to alter the repeat-purchase behavior to some small degree and concludes that loyalty programs are probably the only marketing effort that can address this change.
Both Noordhoff et al. (2004) and Keh and Lee (2006) mentions that behavioral loyalty as a central dependent construct has been facing criticism from some authors since repeat purchase behavior does not always provide an accurate measure by itself as a loyalty measure. A behavioral approach is often only used when evaluating the impact of loyalty cards on store loyalty since the ease of measurement (Demoulin and Zidda, 2009). However according to the critics, using only the behavioral aspect does not capture other moderating variables such as norms and situational factors that influences the customers decision to patronize a specific store (Noordhoff et al., 2004). Noordhoff et al. (2004) stresses the importance to not only look at the behavioral aspect of loyalty but also incorporate the attitudinal aspect to get an accurate prediction of the overall loyalty.
2.1.2 Attitudinal Loyalty
Loyalty in the retail business has previously been researched and has operationalized the attitudinal concept of loyalty as the customers’ commitment (Bridson et al., 2008). Jacoby and Chestnut (1978) defines attitudinal loyalty as “the customer’s predisposition towards a
store as a function of physiological process, which includes attitudinal preference and commitment to the store” (cited in Noordhoff et al., 2004, p. 352). The attitudinal concept of loyalty captures the emotional and mental attachment of the individual to a store or brand (Noordhoff et al., 2004).
Unlike behavioral loyalty the attitudinal aspect focus on a more long-term relationship built through commitment rather than a short-term repeat-purchase behavior (Bridson et al., 2008). Attitudinal loyalty infers that customers enact in extensive problems-solving behavior that involves brand and attribute comparison which leads to a strong brand preference (Bennett and Rundle-Thiele, 2002). Noordhoff et al. (2004) explain that while attitudinal loyalty is considered a mediator that affects behavioral loyalty, the measurement is a prerequisite for understanding how it affects cognitive and affective processes that ultimately make a customer remain loyal.
Uncles et al. (2003) argue that without a strong attitudinal commitment to a brand, “true” loyalty cannot exist. Demoulin and Zidda (2009) also stress the fact that sustainable- or “true” loyalty only exists when customers have favorable attitudes or a high preference for the store or brand. Demoulin and Zidda (2009) mention that in attitudinal loyalty research, commitment is repeatedly used to measure the aspect of attitudinal loyalty. Committed customers will therefore demonstrate a higher degree of support for the loyalty program (Demoulin and Zidda, 2009). In the study made by Demoulin and Zidda (2009) it was shown that commitment (attitudinal loyalty) had a greater impact on the loyalty program than behavioral loyalty measures.
Some researches tends to argue that most loyalty programs are nothing but saving programs in disguise that do not at all contribute to the attitudinal aspect of loyalty and therefore do not create any form of sustainable loyalty (Noordhoff et al., 2004).
2.1.3 Club card loyalty
The loyalty card was created for the purpose to strengthen store loyalty and to build a stronger customer relationship (Mauri, 2003), it is also acts as a efficient way for customer to show that they deserve special attention (Dowling and Uncles, 1997). The link between loyalty and the loyalty card membership is important since it can be the deciding factor if the customer want to maintain or build a relationship with the retailer (Rowley, 2007). The loyalty card permits retailers to collect market research information of their customers shopping behavior, however this information does not represent all customers of the
company, only the ones that are enrolled in the loyalty program (Mauri, 2003; Dowling and Uncles, 1997).
Gillbert (1999) state: “loyalty card aim to build greater customer loyalty and retention; develop methods of creating long-term relationships and lead ultimately to increased sales and profit” (cited in Turner and Wilson, 2006, p. 959). According to Bellizzi and Bristol (2004) and Rowley (2000) card-based programs does often require the customer to use a individualized plastic-card every time they “check out” from the store. When the card is being scanned, the customer gets a special price on the goods, compared to the non-cardholder, or/and are able to collect point that can be used on a later occasion when they revisit the store (Bellizzi and Bristol, 2004).
According to Uncles (1994) some customers feel that the loyalty club card enacts a sense of belonging and a feeling that the retailer is ready to listen and care about them. Mauri (2003) cautions that just because customers subscribe to the loyalty scheme, customer loyalty does not automatically rise. The customer has to use the card repeatedly; optimally for the retailer is when the card is used every time the customer visits the store (Mauri, 2003). Research in the field of loyalty cards done by Wright and Sparks (1999) showed that 23% of their target group did not use their card every time they purchased goods, additionally the card was normally not used when the goods were paid with a small amount of cash.
Mauri (2003) argue that the card is an effective tool for retailers to gain additional knowledge about its customers, but only if the card is used frequently. The customer involvement with the card is however linked to the kind of reward that the customer receives, since customers’ demand of the reward is generally higher if they have a higher involvement. Moreover Mauri (2003) also discuss that because of these demands, the reward plans has become more complex and sophisticated. Many European retailers have created “pure loyalty cards”, which has lead to that the card has become an icon and a brand in itself (Mauri, 2003).
According to Rowley (2007) an additional problem for club card loyalty is that customers are members of many different loyalty programs, even within same industry. This can be seen as a disloyal move by the customer, and the retailer therefore has go the extra mile to meet the customers needs and always try to construct the best offers (Rowley, 2007). The result in the study made by Bellizzi and Bristol (2004) showed that customer that have three membership-cards were less loyal compared to the customers that only had one loyalty card.
The question if loyalty cards truly generate a loyalty behavior is discussed in different perspectives by many researchers. On one side Bellizzi and Bristol (2004) argues that loyalty cannot be received through loyalty cards. Divett et al. (2003) also supports this notion and claims that loyalty cannot be bought, as well as Jenkinson (1995) that states, “The customer’s loyalty is simply not for sale. It cannot be bought for ever by companies or deals” (cited in Rowley, 2000, p.391). In contrast, Sharp and Sharp (1997), Noordhoff et al. (2004) and Demoulin and Zidda (2008) all found in their research that loyalty cards have a positive correlation on customer loyalty, concluding that card holders are more loyal than non-card holders.
2.2 Type of rewards
In this section the four different types of rewards are described and explained thoroughly.
2.2.1 Direct- versus indirect rewards
Yi and Jeon (2003) argue that direct rewards are directly connected to the specific product and/or the brand and the value that it enhances. Indirect reward is the opposite in the sense that it is not relevant to the specific product and the reward is supposed to motivate the customers to become loyal through an indirect way (Yi and Jeon, 2003).
Dowling and Uncle (1997) states that an indirect reward can be seen as a primary reward if the outcome is out of proportion to the money that have been spent. Dowling and Uncle (1997) continues by explaining that it can however create a disadvantage for the company if the primary reason for purchase of the product or brand only is a result to achieve the indirect reward, since once the indirect reward disappear, so will the customer. For that reason a direct reward should be more efficient compared to an indirect reward in building customer loyalty since it increases the value for the product (Dowling and Uncles, 1997). Both Yi and Jeon (2003) and Keh and Lee (2006) agree with Dowling and Uncle (1997) that direct rewards are in most situations preferable to indirect rewards.
Yi and Jeon (2003) state that customers focus more on the products they purchase than products they don't, so direct rewards that are related to these products normally gets more attention and creates a greater value for the customer. Keh and Lee (2006) found in previous studies that customers are more satisfied when rewards and purchase from the same kind of categories are exchanges, compare to if the categories differ. Keh and Lees (2006) findings in their own study also supports that notion, since they conclude that direct rewards are preferable when the customers are satisfied, no form of reward is however effective when
the customer is dissatisfied. They continue by concluding that direct rewards are preferable in high-involvement conditions.
2.2.2 Monetary- versus non-monetary rewards
Monetary benefits are explained in previous research as a way for the customer to save money. Joining a loyalty program and continuously purchasing from the same retailer or the same brand, customers develop monetary savings with help of coupons and cash-back offers. An example presented in research of monetary rewards is “earn 5% cash back on purchases”. Non-monetary benefits can, in contrast to monetary, be seen as a value-added service that instead saves time and not money for the customer. Time could potentially be saved through easier and faster payment desks so the costumers can enjoy a more effortless shopping experience. Non-monetary benefits also let the customer feel that they are specially treated and the benefits therefore are easily recognized. Previous research discuss that non-monetary benefits are intangible and it is therefore harder for other firms to copy the same idea or concept. Even small benefits can differentiate very similar loyalty programs from each other. (Mimouni-Chaabane and Volle, 2010)
Mimouni-Chaabane and Volle (2010) does however not discuss whether monetary or non-monetary benefits are most preferable. They argue that a firm should focus on both monetary and non-monetary benefits, they should promote both as a reason why to enroll in their loyalty program. Jang and Mattila (2005) however do argue that their focus group showed that monetary rewards are more preferable since they provide more flexibility for the customer.
2.2.3 Necessary- versus Luxury rewards
The two factors, necessary- and luxury rewards, are measurements of the customers’ preferences and requirements of a particular reward (Jang and Mattila, 2005). A luxury reward is defined as an item or service that enhances a luxurious lifestyle, e.g. expensive wine, while necessary rewards on the other hand is defined as an essential items that a person need to consume, e.g. food, clothing and medical care (Jang and Mattila, 2005; Kivetz et al., 2004).
According to Kivetz et al. (2004) previous research found that luxury items are less preferable for customer then necessary items since they can create a feeling of guilt, on the other hand previous research also argued that luxury items are associated with a positive
sense of pleasure while necessary items can create a feeling of discomfort. Kivetz et al. (2004) continues by stating that a few previous studies has shown that respondents prefer luxury rewards over necessary rewards, one explanation in a grocery retailer setting can be that the customers perceived value of the reward is higher if the customer has to visit the store on 40 occasions instead of 10 occasions. If the requirement of the loyalty program is higher, the customers perceived value of the chosen reward would be higher as well (Kivetz et al., 2004).
Kivetz et al. (2004) research shows that customers are likely to prefer luxury rewards to necessity rewards and that customers are more likely to join a reward programs if they offer luxury rewards. Jang and Mattila (2005) result was contrary to Kivetz et al. (2004), since their study concluded that customers prefer necessary rewards rather than luxury rewards.
2.3 Timing of rewards
In this section the timing of rewards is described and explained thoroughly.
2.3.1 Immediate versus delayed rewards
According to Dowling and Uncle (1997) the availability of the reward is one of the deciding factors when attracting customers to loyalty programs. The construct of timing of reward is divided into two factors, the first being immediate rewards, which can be explain as a reward that is given to customers directly upon purchase, e.g. every time they visit the store. A delayed reward on the other hand is acquired after the customer has been visiting the store a certain amount of times (Yi and Jeon, 2003). Yi and Jeon (2003) continue by explaining that a customer’s degree of involvement in the reward process makes the customer prefer either an immediate- or delayed reward. Rowley (2007) claims that immediate rewards are more effective than delayed rewards when building loyalty in low-involvement situations. Continuing on this notion Uncles and Dowling (1997) argue that a low-involvement situation results in loyalty for the program instead of loyalty for the product or brand. Yi and Jeon (2003) also state that immediate rewards, such as lotteries, are recommended for a low-involvement customer.
The perceived value of the reward is also a depending factor whether the customer prefers an immediate- or delayed reward. Keh and Lee (2006) mentions that previous studies has shown that customers tend to prefer delayed rewards if it is of a higher perceived value, since the higher perceived value of the reward is more attractive to the customer. Keh and
Lee (2006) concludes in their own study that a delayed reward tends to be more successful if the customer is already satisfied, the opposite was also concluded that immediate rewards tends to be more successful if the customer is already dissatisfied. In general, the majority of the research concludes that costumers prefer immediate rewards to delayed rewards (Dowling and Uncles, 1997; Jang and Mattila, 2005; Rowley, 2007; Yi and Jeon, 2003). Dowling and Uncles (1997) also claim that psychological research has shown that customers tend to be less motivated towards delayed rewards compared to immediate rewards.
A frequently used system of delayed rewards used by the majority of retailers according to Jang and Mattila (2005) is based on the collection of reward points. The authors explains that the customer acquires a certain amount of points for every purchase made and a certain number of points is equal a particular reward. Jang and Mattilas (2005) result concludes that 83% of the customers in their study preferred immediate rewards to the point reward system, even though the point reward system is one of the most commonly used loyalty reward schemes today.
2.4 Reflections on the theoretical discussion
The theoretical framework in the topic of store loyalty and club card loyalty are diverged between researchers. While some researchers argue that a loyalty schemes are nothing but a marketing gimmick that does not add any affect on store loyalty, some argue the complete opposite (Bellizzi and Bristol, 2004; Lal and Bell, 2003; Mägi, 2003; Noordhoff et al., 2004; Sharp and Sharp, 1997). There is clearly a gap in the theoretical framework since researchers do not agree on the outcomes. This deviation between researchers could possibly be a result that they design their research differently; different variables are used to explain the concept of the different dimension of loyalty.
Since the loyalty programs are a quiet new entity, meaning that they have not been around for decades and therefore could not have been studied for the amount of time that it takes to create a unified theoretical framework. As most research that deals with human behavior, it is hard to measure and can be conducted is a vast amount of ways creating a barrier for researchers to come up with some form of unified theory. Because of the diverging theory this study has adapted the concepts and questions that were though relevant from our perspective to create a most accurate explanation of the concept. The following model was created to explain the relationship between club card loyalty and behavioral- and attitudinal loyalty.
Figure 2. The relationship between club card loyalty and behavioral- and attitudinal loyalty. (Source: Own construction)
In the theories surrounding customers reward preference, the theoretical framework is not as diverged compared to the theoretical framework surrounding loyalty. Notably is that most researchers agree on what types of rewards are preferable in the majority of situations and can support their claims with empirical evidence that is comparable amongst the different studies. Because of this lack of diversion it will be interesting to investigate if this study can provide evidence that contradicts the generally accepted framework. The following model was created to graphically explain the opposites sides of each type and timing of rewards.
3.0 Methodology
In the methodology section the intention is to give an overall perspective of how this study are conducted. The chapter will start with epistemological and ontological consideration to show a broad perspective on acceptable knowledge. The categories; approach, respondents selection and selection of scales will be explained, as well as the tools that has been used for the analysis. A research strategy will also be presented to show the process in the study from the start until finish.
3.1 Epistemological and ontological considerations
Epistemological issues include the notion of what is regarded as acceptable knowledge, as a central questions in the subject is whether or not the social world can or should be studied with the same procedures as natural sciences (Bryman and Bell, 2007). It is necessary that we as authors have our opinions of what our views of reality and knowledge are, in turn to be able to interpret our empirical findings.
Epistemological considerations can be explained as how to view knowledge and how to interpret it. Researchers can view knowledge from a positivistic position that claims that there has to be a clear distinction between theory and research. The intention with the theory is to generate hypotheses that can be tested thoroughly through empirical scrutiny (deductivism). Theoretical knowledge must have been extensively tested to be valid. An Inductivistic view argues that knowledge derives inductively through observations. Researches who take an interpretivism position, in contrast to positivism, focus on how humans resonate which is based on reflections of their behavior. The purpose is to understand human behavior and actions that are individually perceived in a social environment. (Bryman and Bell, 2007)
Ontological considerations regards whether a social reality exists or not. Objectivists believe that there exist things that are certain that consists outside of our reach that we cannot affect. They therefore believe that social reality does not exist. I.e. an organization; it has rules and regulations and follows standardized procedures. The same states with cultures, which are widely, shared values that civilians follow in order to be considered “good” citizens. Constructionism compared to objectivism, believes that reality only consist though individual interpretations. (Bryman and Bell, 2007)
As our aim is to capture the relation between club card loyalty and store loyalty we use a deductive approach, it can also be argued that we have taken a positivistic knowledge
stance. All theory in the subject was collected from previous validated research and our study is therefore designed with an influence from previous research. In the ontological considerations it can be argued that our research does not take a stand for either objectivists or constructionism. The people participant in our study may have opinions from both a cultural perspective, as well as from an individual perspective. We cannot therefore make a clear statement in this subject.
3.2 Research method for the present study
Our purpose of this study is to investigate whether club card loyalty have an impact in customers store loyalty, as well as to see which attributes of a loyalty card that the customers generally prefer. Through the use of a survey, collected outside the grocery store ICA to target the right segment, this study is in line with a quantitative research study (Bryman and Bell, 2007).
3.2.1 Approach
A quantitative research study aims to measure a few variables with many participants; the raw data gathered is often analyzed with the help of various statistical measurements (Bryman and Bell, 2007). With help of previous researches in the subject of loyalty programs and rewards, the purpose for this study was carried out to determine if club card loyalty has an impact in customers store loyalty, as well as which attributes the customers prefer. This study is therefore in line with a deductive research approach, since it testing previous theory (Bryman and Bell, 2007). Since this study's approach is in line with a quantitative, deductive research study, the choice fell naturally on a cross-sectional research design, as that particular method often is equated with surveys (Bryman and Bell, 2007). The method is preferable when you handle a lot of quantifiable data from surveys. The majority of previous research in the subject of loyalty programs and rewards has used surveys (Bellizzi and Bristol, 2004; Bridson et al., 2008; Demoulin and Zidda, 2009; Mägi, 2003; Noordhoff et al., 2004; Sharp and Sharp, 1997; Turner and Wilson, 2006). Bryman and Bell (2007) argues that hypothesis testing is not often used in qualitative studies but rather in studies with an experimental approach. This study therefore contains research questions instead of hypotheses.
3.2.2 Data collection and respondent selection
To be able to measure if club card loyalty have an impact in customers store loyalty in the Swedish grocery store ICA, the respondent need to posses a ICA loyalty card and be a member in the ICA loyalty program. The choice fell naturally that the surveys needed to be collected outside an ICA store, as the chance increases dramatically to actually find participants that have acquired an ICA loyalty card. The study will be conducted in a Swedish town with approximately 100.000 citizens and we chose to collect the surveys outside ICA Maxi, the largest ICA grocery store in that town, since it should consist of most people in movement. Turner and Wilson (2006) collected 60 surveys in a similar study in England; thus, we are aiming for 120 participants in the study to get the highest reliable results as possible.
Since our expectation is to be able to generalize the collected data to ICA’s members in Sweden, a probability sample will be used, with systematic random samples of respondents. Bryman and Bell (2007) states that choosing systematic random sampling, the human factor in the sampling will be eliminated, and each unit in the population has an equal chance to be selected.
Sullivan (1994, p. 1297) explains how random sampling can be used: ”A random sample – for example, taking a random start within the first x cases and then selecting every xth cast from a list that contains every case filed. The number x is a function of the desired sample size. This procedure approximates randomness because there is no selection of which particular case will fall into the sample.” Our sample will, just like Sullivan (1994) explained, be conducted so that each 5th person will be asked to participate in the study. The
non-response rate is a combination of those who did not want to participate in the study as well as those who did not possess an ICA club card. Bryman and Bell (2007) claims that there must be a certain caution on how to generalize to the population of the study. This study will therefore be generalized only to the Swedish members of ICAs loyalty program and cannot be generalized to other grocery stores in Sweden. Since previous studies such as Turner and Wilson (2006) generalized their result to all the Tesco club card members in England, with 60 participants, this study should be able to generalize the result of 120 participant to all the ICA club card members in Sweden.
To be able to analyze the data from our sample, a correlation analysis will be conducted to determine if the club card loyalty have an impact on customers store loyalty. Previous research such as Turner and Wilson (2006), Mägi (2003) and Leenheer et al. (2007)
has done a correlation analysis as well. Additionally, a cluster analysis will be conducted to segment the loyalty card customers of ICA. All the variables, the rewards, demographic, and loyalty measures will be integrated in the cluster analysis and the variables of rewards will also be presented in a descriptive way to show what is preferable.
3.2.3 Selections of scales
In our survey we chose to measure the variables except the demographic variables with the VAS (Visual Analog Scale). The VAS scale consists of a 10-centimeter long line where the respondents make a mark where on the line they see themselves according to a certain statement. At the start of the line it is written “Do not agree”, “Do not prefer” or “Never” while on the end of the line it states “Strongly agree”, “Heavily prefers” or “Always” depending on how the statements is formulated.
Most previous research has exclusively used the Likert scale, however we believe the VAS is preferred in our study. Lingjærde and Regine Føreland (1998) explains that the benefits with adopting the VAS scale is that the scale is easily understood and executable at the same time as it is not very time consuming. Additionally the VAS scale offers a higher precision since it utilizes a scale ranging between 1 and 100 while the Likert scale only utilize a scale ranging from 1 to 7 or 1 to 5.
As our study is not as extensive as previous research our intention was to make the survey as easily understandable and user friendly as possible to retain a potentially higher response rate. Our intentions were also to keep the survey short while asking the right questions. Davey et al. (2007) states that the VAS scale is preferable over the Likert scale when the amount of space is limited in the survey. Each answer is then measured with a ruler with millimeter precision resulting in a high precision of the respondent’s answers.
The demographic variable income was created with help of statistics from The Swedish statistical bureau (“Statistikskolan” 2012). Since the average income was stated in income in a year terms we opted to reduce it to income per month for the convenience of the respondents. A 7 scale were created with the average income per month in the middle and gradually expanding upwards and declining downwards.
3.3 Research strategy
To be able to achieve the purpose of this study, the first step was to search for relevant theory in the subject of loyalty programs. The terms used for searching were “loyalty + schemes” and “loyalty card + rewards”. We began our search at Google Scholar, a search engine for academic articles which led us to the broad field of loyalty, 63 000 articles were found which suggests that the subject has been researched extensively. After reading through a hefty amount of relevant academic articles it was clear that some were used as a basis for the subject (Mägi, 2003; Noordhoff et al., 2004; Sharp and Sharp, 1997; Turner and Wilson, 2006; Yi and Jeon, 2003; Dowling and Uncles, 1997). A matrix was made in order to categorize the constructs as well to more clearly see which authors discussed the different constructs. The matrix made can be found in appendix 1. By doing this extensive research in the field of loyalty it was clear that “behavioral loyalty”, “attitudinal loyalty” and “club card loyalty” were three of the most common concepts (Demoulin and Zidda, 2008; Mauri, 2003; Noordhoff et al., 2004; Rowley, 2000). Our purpose therefore became to measure “if club card loyalty has an impact on customers store loyalty”. We use a deductive approach, which is common when the research purpose is to test whether the theory works in practice (Bryman and Bell, 2007). Already tested questions from previous research were used in our questionnaire to measure “behavioral loyalty”, “attitudinal loyalty” and “club card loyalty”. Bryman and Bell (2007) argues that which variables measured and the way they are measured, reliability is an important factor. Using questions already tested by other researchers leads to a high reliability and validity in our study.
Since it is also in our interest to investigate what kind of rewards ICA’s customers prefer. The most commonly referred variables was chosen in that field of research; Direct versus Indirect (Dowling and Uncles, 1997; Rowley, 2007; Yi and Jeon, 2003), Immediate versus Delayed (Dowling and Uncles, 1997; Jang and Mattila, 2005; Keh and Lee, 2006), Monetary versus Non-monetary (Jang and Mattila, 2005; Mimouni-Chaabane and Volle, 2010) and Necessary versus Luxury (Jang and Mattila, 2005; Rowley, 2007; Kivetz and Simonson, 2002). In this case, it was natural to choose these four variables, since they were well mention in previous research. The critical aspect of this choice is however that we could not find any questions related to the rewards that were asked by any of these researchers. From our interpretation of the concept that was derived from previous knowledge we constructed questions of our own.
The choice of data collection fell on surveys since the majority of previous research used this technique. Bryman and Bell (2007) explains that a benefit with surveys is that it is adapted to each of the respondents needs, as they can in their own phase complete the survey as well as the ability to become anonymous. There are however also disadvantages to consider, it is not possible to ask any follow up questions, the non response rate can be substantial and there is a risk that not all the information can be reaped if the respondent decides not to answer all the questions (Bryman and Bell, 2007). Although weighing the benefits and the disadvantages we still consider surveys to be the best choice in this study, and our target is to collect a total of 120 surveys. Totally the survey consists of 20 questions, 9 questions regarding the variables of loyalty, 8 questions regarding the variables of rewards and 3 questions regarding the demographical variables. All of the questions were translated from English to Swedish in order for the respondents to relate to the questions more easily. We collected our data at ICA Maxi, the largest grocery store in the region. We got permission from the management to ask customers at the checkout counters, which allowed us to incorporate all of visitors into our sample. A random sample were used which in practice means that we asked every 5th person or family that passed. During a weekend in December we collected 114 surveys, which is an acceptable amount. Totally 282 individuals were asked to participate which resulted in a response rate of close to 60%. The non-response rate was however slightly higher than we initially expected. Bryman and Bell (2007) states that survey response rate has fallen in recent years due to individuals being less inclined to take the time and answer surveys. That could be the case, although we are critical to our positioning at the store since we believe we would have gotten a higher response rate if we were allowed to stand at the entrance rather than the exit of the store. Speculating why customers decided not to answer could depend on stress and a general reluctance to answer surveys. As the study is aimed at ICA’s customers the non-response rate should not have been able to been lowered by the methodological choices made in the study.
After all the surveys were collected, statistical analyses were conducted on the raw data with help of the statistical analysis program, SPSS. A correlations analysis was conducted to distinguish whether club card loyalty have an impact on customers store loyalty. Additionally a cluster analysis was conducted to segment the respondents so they could be analyzed.
3.4 Tools for statistical measurement
In this section the two relevant statistical measurements, correlation- and cluster analysis are explained.
3.4.1 Pearson’s Correlation
The information gathered concerning Behavioral-, Attitudinal- and Club card loyalty are interpreted though a Correlation Matrix that is created with the help of the statistical measurement software, SPSS. Pallant (2001) describes that a correlation analysis is used to determinate the strength and direction of the linear relationship between two different variables. Correlations are different from causality in the sense that a correlation does not reveal whether one factor caused the other (Pallant, 2001). Therefore it is not possible to determine if question 1 prompted a high rating for question 2 and vice versa. The result of a Pearson’s correlation can only take on values from -1 to +1 (Pallant, 2001). Meaning that the result can either have a positive or negative correlation. The size of the value does however reveal the strength of the relationship between the two variables (Pallant, 2001). A correlation result close to 1 is regarded as strong. For the analysis of the correlations Cohen (1988) provides the following guidelines:
Figure 4. Correlation guidelines. (Cohen, 1988)
The whole correlation matrix that was used to interpret the empirical findings can be found in appendix 4.
3.4.2 Cluster analysis
As a complement to the correlation analysis, a cluster analysis will be conducted with the help of the statistical analyst program SPSS. The cluster analysis uses different algorithms and methods to group the respondents into categories without giving explanation or interpretation (“Cluster Analysis”, 2012).
In an optimal cluster analysis the clusters should be evenly spread amongst women and men. However in our cluster analysis this could not be achieved and the clusters ended
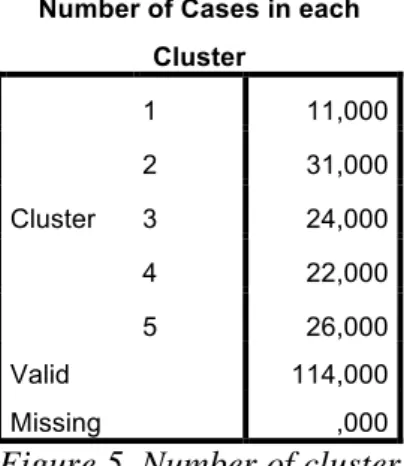
with 2 female clusters and 3 male clusters. The number of respondents in each cluster should also be as evenly spread as possible. Below in figure 5 the respondents spread amongst the cluster can be observed. The entire cluster analysis can be found in appendix 6.
Number of Cases in each Cluster Cluster 1 11,000 2 31,000 3 24,000 4 22,000 5 26,000 Valid 114,000 Missing ,000
Figure 5. Number of clusters and respondents
3.5 Reliability and validity
Reliability is whether the concept and the result are reliable and if the study can be replicated with the same result (Bryman and Bell, 2007). Since the theoretical foundation for this study derives from previous research, where authors have researched the subject for many years (e.g. Uncles et al., 2003; Uncles, Mark D., 1994; Uncles and Dowling, 1997) as well as that their articles have been used in similar research by other researchers, indicates that the sources used for this study are reliable. To further clarify the credibility, we as authors have both participated with collecting the surveys as well as that all the questions were closely controlled and measured by both authors. To get a measurement of how reliable the gathered data is the statistical measurement Cronbach's alpha is used. According to Tavakol and Dennick (2011), the Cronbach’s alpha value should lie between 0.7 and 0.95 to be acceptable, the maximum value is 1. A lower value than 0.7 can depend on a low amount on questions or too heterogeneous variables. The Cronbach’s alpha is also a measurement if the gathered data is good enough to endure even more advanced statistical procedures. As seen in figure 6 the data achieved a Cronbach’s alpha of 0.83, which is considered reliable.
Reliability Statistics
Cronbach's Alpha
N of Items
,830 20
Validity concerns whether the conclusions from a survey make sense to the aim that was intended and there is according to Bryman and Bell (2007) different types of validity. Internal validity regards if the relationship between two or more variables are sustainable, for example if variable X affect variable Y, or if there is another reason which allows X and Y to indicate an apparent relationship. External validity regards how high the validity is for the individuals that has been chosen to participate in the study, i.e. the importance of creating a representative sample. To increase the validity in this study, questions from previous researches have been used so the relationship between store loyalty and club card loyalty will be credible. The selection of respondent is also carefully chosen, since it only consists of individuals who possess an ICA club card. The external validity is therefore considered high, since all of the respondents are in the target group and have a complete understanding for ICA and the loyalty program.
3.6 Possible methodology errors
There are possibilities that methodological errors can occur during a study. The intention with this chapter is to present possible errors in a quantitative research as well in a survey research.
3.6.1 Errors in quantitative research
Bryman and Bell (2007) mention that direct criticism against quantitative research exists: • This kind of research do not take into consideration that the participant of the study
has a different perception of the concepts, and that they understand the questions in a similar way.
• It often ignores the fact that the participant of the study may not have enough knowledge to do a correct answer on the questions.
• The statistic data can show a misleading picture of the reality, since it’s not clear that result is linked to the “everyday” context. The social reality in the statistic can be separated from the individuals that create it.
Bryman and Bell (2007) claim that there are mainly two reasons why it can be hard to carry out research in general. The first being that teachers of research methodology cannot teach about all the eventualities that may occur, they may show an acceptable way to do a research. The second problem is that even the researchers are competent and follow the praxis of how
research should be conducted, factors such as time; money and feasibility can also be reasons for not being able to go through with the study.
3.6.2 Errors in survey research
There is, according to Bryman and Bell (2007) four errors that can occur during a survey research.
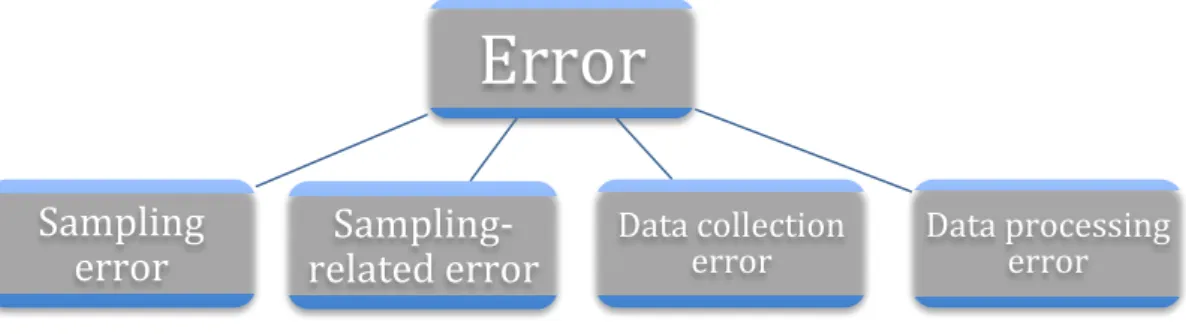
Figure 7. Bryman and Bells’s four sources of error in social survey research (Bryman and Bell, 2007, p. 202)
Sampling error is referred to as not able to collect a representative sample, even probability samples are used. Sampling-related error refers to if the selection of data is too small or if the grade of incorrect samples and non-response is too extensive. This is a problem that can occur during the sampling procedure. Data collection error consists of questions that weren't formulated good enough in the survey. The fourth and last one, data processing error, refers to mistakes in handling the collected data, such as uncorrected coding. (Bryman and Bell, 2007)
3.7 Ethical considerations
Bryman and Bell (2007, p. 138) mention that Code of Ethical conducts suggests: “It is the duty of Academy members to preserve and protect the privacy, dignity, well being, and freedom of research participant. Informed consent means explaining to potential participant the purpose and the nature of the research so they can freely choose whether or not to become involved”. It is important that the participants know all the facts before contributing anything to a study, therefore making sure they are fully aware of what they are participating in is important. Since our intention was to give all our respondents an overall picture of our study, we carefully mention that we were student, the purpose with the study as well all the components of the study. All the respondent of our study were also anonymous, which they were told in an early stage.
Error
Data processing error Data collection errorSampling-‐
related error
Sampling
error
4.0 Empirical findings
This chapter will start with an introduction of the company that is in focus in this study, ICA, with an explanation of ICA’s loyalty program. This chapter also consists of the empirical findings, graphically displayed in histograms. The intention is to, with the help of a correlation analysis; show whether club card loyalty have a correlation with behavioral- and attitudinal loyalty. Type– and timing of rewards are showed graphically in histograms as purpose to show statistical means what kind of reward the respondents prefer.
4.1 ICA Loyalty program
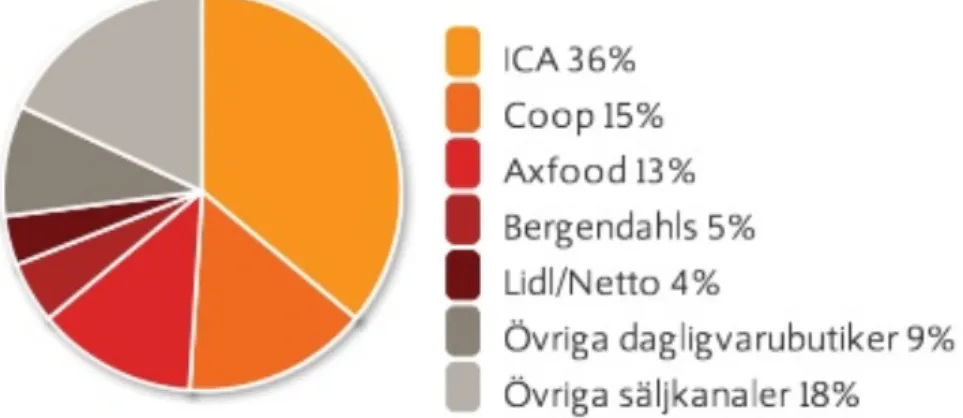
ICA is the market leader on the Swedish grocery retail market with a market share of 36%. ICA’s annual report 2012 states that a Swedish customer spends on average 12 % of their total income on groceries and that their customers has shown an increased interest for healthy, environment friendly and convenient solutions when purchasing their groceries. 30 % of the Swedish customers are keeping an eye out for special offers when they decide where to purchase their groceries. The growing market of technical solutions enabling customers to easily compare prices on their smartphones has made the market even more competitive than before. (ICA Annual Report 2012, 2012) (ICA Organization Report 2012, 2012)
Below is ICA’s market share in the Swedish market presented graphically with the addition to competitor’s market shares in percentages.
Figure 8. ICA and ICA’s competitors market shares in the Swedish market graphically and percentage. (ICA Annual Report 2012, 2012)
The “ICA-card” was introduced on the Swedish market in 1990 and ICA states: “You that shop with the ICA-card always gets more. More food you like. More inspiration in your everyday life. And more money for other things.” (“Förmåner med ICAs kort,” 2013)
The benefits with the ICA-card are: • Bonus on everything
• Special prices on different products every week • Discounts on trips and entertainments
• Personal discount on the products that you regularly buy
For every Swedish Krona spent at ICA, the member earns ICA-bonus point in. Once the member has accumulated 2500 points, a check of 25 Swedish kronor is received and can be used at any ICA-store. A loyal member that spends more than 1200 kronor a month at ICA also receives the magazine “Buffe”, that contains of special offers and recipes. (“Förmåner med ICAs kort,” 2013)
ICA also offers scanning to their members that have ICA-cards. The self-scanning system implies that the customer scan their groceries directly in the story and pack them in their bags during the time collecting groceries in the store. This benefit helps the customer to save time while allowing members to avoid long queues at the checkout points at busy hours. (“Vanliga frågor och svar | ICA.se,” 2013)
ICA reward card is free of charge, but ICA also provides an ICA-debit/credit card, that is offer at a low monthly cost. The ICA-debit/credit card thus acts as both a reward card and a debit/credit card.
4.2 Result
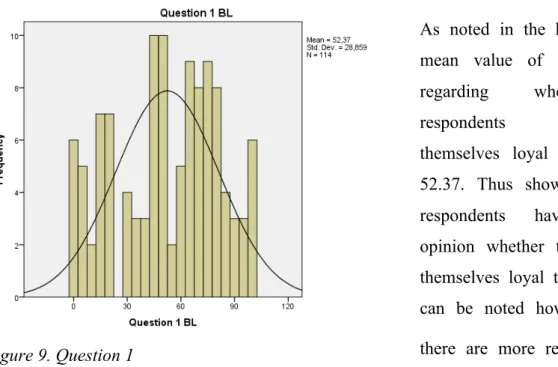
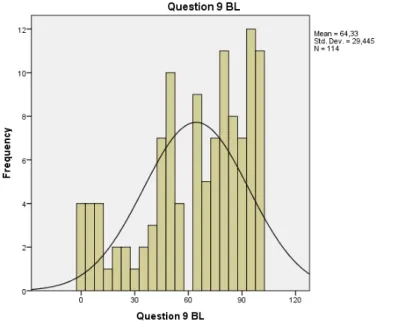
A total of 114 surveys were collected and five categories of question were asked; behavioral loyalty, attitudinal loyalty, club card loyalty, type of rewards and timing of rewards. The intended purpose with the empirical section is to firstly show the correlation between the behavioral/attitudinal aspects of loyalty with club card aspect of loyalty. The correlation matrix from SPSS is found in appendix 4. The result will be show graphically in a histogram with an explanation of what the histogram implies and the mean values from the respondents will be presented. Since the intention is to see whether club card loyalty have an impact on customers store loyalty, a correlations analysis have only been made for the nine questions under these categories. The questions for each category will be explained in the same
paragraph and the questions are therefore not in same order as it was in the survey. There will furthermore not be a correlation explanation between the questions in the same category since they naturally have a high correlation, there will also be no correlations explained between the behavioral and attitudinal aspects. As our purpose is to investigate the relation between club card loyalty with behavioral- and attitudinal loyalty these are the only correlations presented.
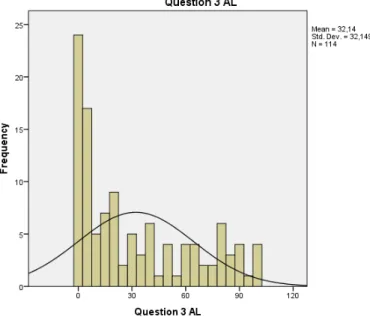
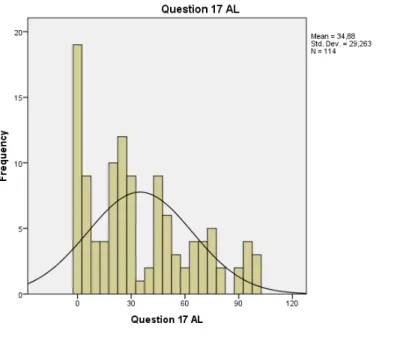
Secondly, the questions under the categories type of reward and timing of reward will be shown graphically and explained, with the purpose to get en overall picture of what kind of rewards that the respondents prefer. The VAS scale that has been used contains of 100 steps, where 0 stands for “Do not agree”, “Do not prefer” and “never”, while 100 stands for “Heavily agree”, “Strongly agree” and “always”.
Instead of presenting the correlation numbers in a numeric sense the correlation scale of Cohen (1988) is used as seen below.
Figure 4. Correlation guidelines. (Cohen, 1988)