ANALYSIS OF PFAS OVER TIME IN SOIL AT VENETUCCI FARM
by
ERIC PATRICK GAULKE
B.S. University of Colorado Colorado Springs, 2017
A thesis submitted to the Graduate Faculty of the
University of Colorado Colorado Springs
in partial fulfillment of the
requirements for the degree of
Master of Sciences
Department of Chemistry and Biochemistry
ii
This thesis for the Master of Sciences degree by
Eric Patrick Gaulke
has been approved for the
Department of Chemistry and Biochemistry
by
Janel Owens, Chair
Kevin Tvrdy
Wendy Haggren
iii
Gaulke, Eric Patrick (M.Sc., Chemistry)
Analysis of PFAS over Time in Soil at Venetucci Farm
Thesis directed by Associate Professor with Janel Owens
ABSTRACT
Per- and polyfluoroalkyl substances (PFAS, previously known as PFCs)
have been a concern as an environmental contaminant for decades. They are
resistant to degradation and commonly referred t
o as “forever chemicals.” Their
use has led to extensive groundwater pollution across the globe and have
polluted the aquifer below our very own local Venetucci Farm. This study used
high performance liquid chromatography coupled to tandem mass spectrometry
to look at PFAS concentrations in soil at Venetucci Farm over a one-year period
in multiple sample sites across the farm. Results have shown relatively stable
PFAS concentrations over time at sample sites with low total organic carbon
levels (p = 0.163, 0.213) and significant variability of PFAS concentrations over
time at sample sites with higher total organic carbon levels (p = 3.670×10
-3,
3.171×10
-8, 5.273×10
-11). Overall, long chain PFAS such as PFOA and PFOS
have been found with concentrations over 1.82 ng/g while other PFAS were
undetected or below the limit of quantitation of 0.04 ng/g.
iv
ACKNOWLEDGEMENTS
The Shimadzu Corporation and National Science Foundation
(CHE-1429567) are acknowledged for funds to purchase the Shimadzu LCMS-8030
system. The Pikes Peak Community Foundation, Sam Clarke, Tim Zant, and
Susan Gordon are acknowledged for their roles in providing access to the farm
and all of their help providing information about the farm. The Department of
Chemistry and Biochemistry are acknowledged for the tremendous support and
encouragement imparted onto me during my time at UCCS and for the Graduate
Teaching Assistantship opportunity which allowed me to develop leadership skills
and pay for my tuition. Dr. Tvrdy and Dr. Haggren are acknowledged for joining
me in my pursuit of a graduate degree as members of my thesis committee and
helping me throughout this process. I also want to acknowledge Dr. Owens
specifically for giving me the opportunity to work in her research lab as an
undergraduate student, which truly changed the course of my life.
v
Table of Contents
CHAPTER 1 ... 1
BACKGROUND AND LITERATURE REVIEW ... 1
1.1 Definition and History ... 1
1.2 Chemical Properties ... 3
1.3 Toxicity ... 5
1.3.1 Toxicity of PFOS and PFOA ... 5
1.3.2 Toxicity of Other PFAS ... 11
1.4 Use of PFAS on Military Bases in U.S.A. and Resulting Pollution ... 14
1.5 EPA Health Advisory Limit, Impact on Venetucci Farm, and Impact on
Surrounding Areas ... 16
1.6 PFAS Transport and Prediction for Venetucci Farm ... 17
1.7 Experiment Parameters and Hypothesis ... 19
CHAPTER 2 ... 24
MATERIALS AND METHODS ... 24
2.1 Chemicals and Supplies ... 24
2.2 Sample Collection and Preparation ... 25
2.3 Instrumentation... 31
vi
2.3.2 Tandem Mass Spectrometry ... 33
2.4 Quality Assurance and Quality Control ... 34
2.5 Statistical Analysis of Data ... 38
CHAPTER 3 ... 40
METHOD DEVELOPMENT AND OPTIMIZATION ... 40
3.1 Validated Changes ... 40
3.2 Invalidated Changes ... 44
CHAPTER 4 ... 46
RESULTS AND DISCUSSION ... 46
4.1 “Soil 1” Sample Site Data ... 46
4
.2 “Pinello” Sample Site Data ... 47
4.3 “Lower Field” Sample Site Data ... 48
4.5 “Raised Bed” Sample Site Data ... 50
4.6 Discussion ... 51
CHAPTER 5 ... 55
CONCLUSIONS AND FUTURE WORK ... 55
REFERENCES ... 57
Appendix ... 62
Condensed Sample Site Data with Associated Error ... 62
vii
Standards Raw Data ... 117
Spike Recovery Raw Data ... 219
viii
List of Figures
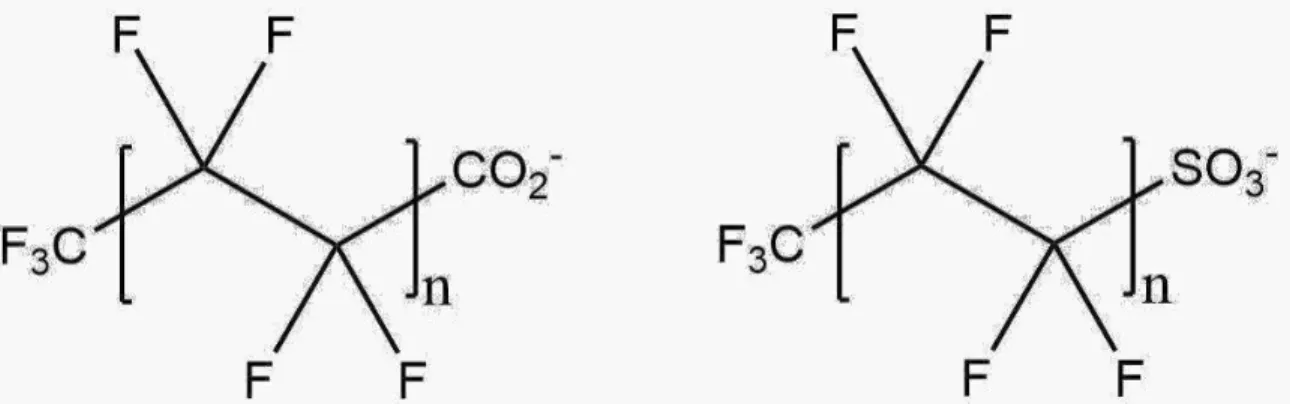
Figure 1
- Image showing generic stick structure of PFAS anions capped with
either a carboxylic acid or sulfonate group, n denotes that the hydrophobic C-F
chain can be longer or shorter depending on the specific PFAS molecule
……….1
Figure 2
- Map showing location of Venetucci Farm in greater Colorado area and
sample locations on the farm with Pinello (A), Soil 1 (B), Raised Bed (C), Hoop
House Basil (D), and Lower Field (E)
………..19
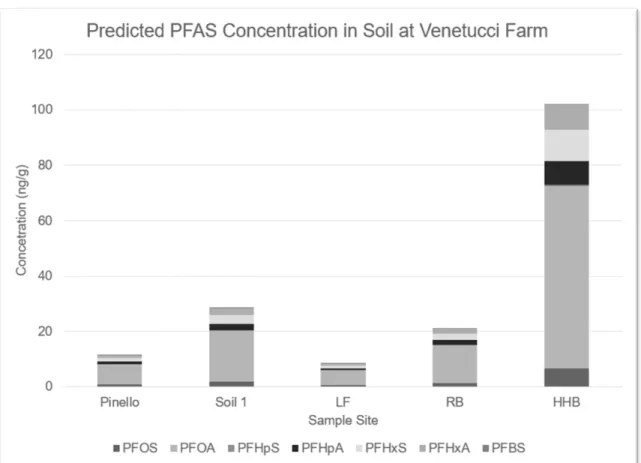
Figure 3
- The predicted concentration of PFAS in soil at the five sample sites
chosen for this study
………..22
Figure 4
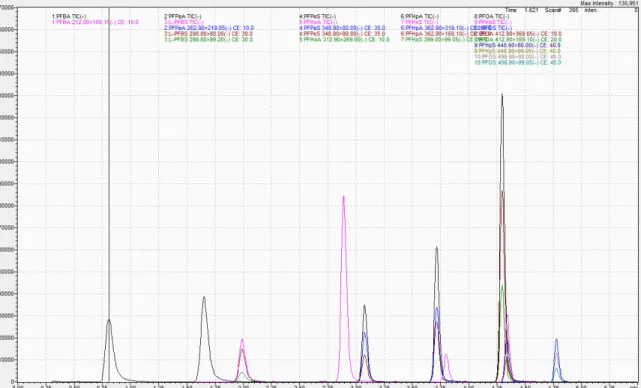
- A total ion chromatogram (TIC) of a 1.82 ng/mL analytical standard for
the PFAS compounds analyzed in this study
……….32
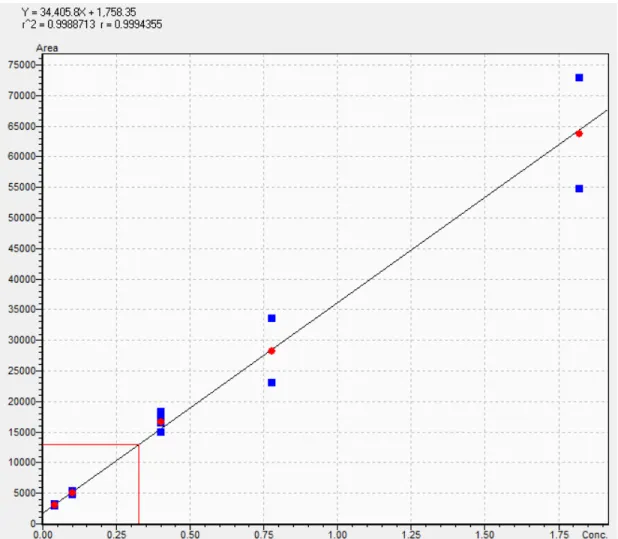
Figure 5
- Calibration curve for PFPeS generated from the instrument response
of standards in the sample batch
……….35
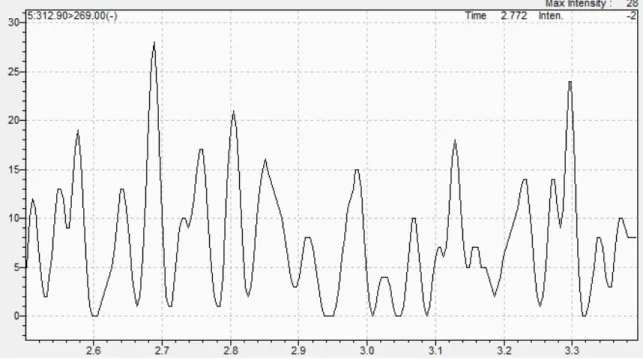
Figure 6
- Chromatogram of blank water for PFHxA with time along the x-axis
and instrument response measured by the y-axis
………37
Figure 7
- Average spike and recovery data for not shaking Falcon tubes by
hand prior to sonication and shaking Falcon tubes by hand. Sample sets 1-3
were not shaken by hand and sample sets 4-6 were shaken by hand. Error bars
denote standard deviation
………..………..41
Figure 8
- Graph showing the ratio of a 0.77 ng/mL standard filtered using a
nylon GMF filter and unfiltered
……….42
Figure 9
- Graph showing the peak height ratio of a 0.77 ng/mL standard filtered
ix
Figure 10
- Graph depicting the ratio of peak heights for an unfiltered 0.77 ng/mL
standard and the same standard filtered with a RC 15 (0.45 μm) filter………….44
Figure 11
- Graphical representation of the data generated from the Soil 1
sample site over the duration of the study
………..47
Figure 12
- Graphical representation of the data generated from the Pinello
sample site over the duration of the study
………..48
Figure 13
- Graphical representation of the data generated from the LF sample
site over the duration of the study
………49
Figure 14
- Graphical representation of the data generated from the HHB sample
site over the duration of the study
………50
Figure 15
- Graphical representation of the data generated from the RB sample
x
List of Tables
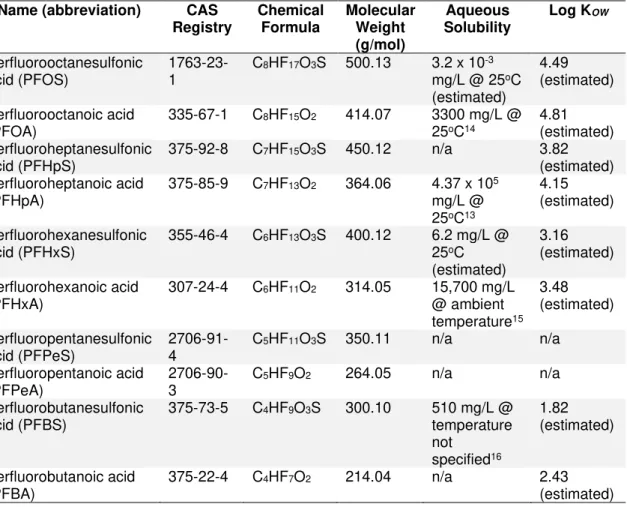
Table 1
- PFAS compounds studied in this experiment with abbreviations,
chemical properties, and identifying information
……….…3
Table 2
- Mass spectrometry specifications, compounds are listed in order of
elution with PFBA being the first to elute
………33
Table 3
- Average percent recovery and percent relative standard deviation for
all spiked samples (n=2) in each batch throughout the entire duration of the
study
……….36
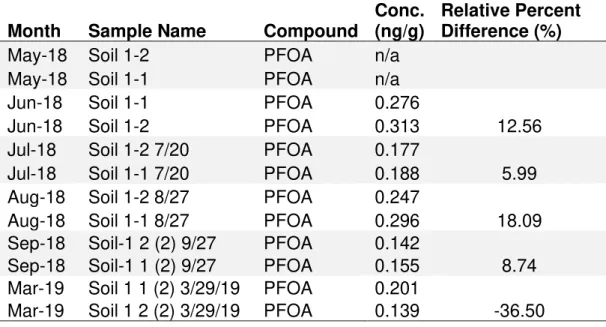
Table 4
- Data for PFOA concentrations at Soil 1 sample site with relative
percent difference (%RPD) for all months that Soil 1 samples were ran in
duplicate to show as an example for %RPD
………..38
Table 5
- Total organic carbon (TOC) in the soil at Venetucci Farm for the five
xi
List of Abbreviations
AFFF
aqueous film-forming foam
ALC
adult Leydig cell
ANOVA
analysis of variance
ATSDR
Agency for Toxic Substances and Disease Registry
CAS
Chemical Abstracts Service
CID
collision induced dissociation
C
solidconcentration in solid
CV
cartridge volume
C
waterconcentration in water
DI
de-ionized
DoD
Department of Defense
dpf
days post fertilization
EDS
ethane dimethyl sulfonate
EPA
Environmental Protection Agency
ESI
electrospray ionization
ƒ
OMfraction of organic matter
GMF
glass microfiber
HHB
hoop house basil
hpf
hours post fertilization
HPLC-MS/MS
high performance liquid chromatography coupled to tandem mass
spectrometry
ILC
immature Leydig cell
K
dsolid-water distribution coefficient
K
OMorganic matter partition coefficient
K
OWoctanol-water partition coefficient
LF
lower field
LHA
lifetime health advisory
LOAEC
lowest observed adverse effect concentration
LOQ
limit of quantitation
m/z
mass-to-charge ratio
MCT
microcentrifuge tube
MeHg
methyl mercury
NMDA
N-methyl-D-aspartate
PFAS
per- and polyfluoroalkyl substances
PFBA
perfluorobutanoic acid
PFBS
perfluorobutanesulfonic acid
PFC
perfluorinated chemical
xii
PFHpA
perfluoroheptanoic acid
PFHpS
perfluoroheptanesulfonic acid
PFHxA
perfluorohexanoic acid
PFHxS
perfluorohexanesulfonic acid
PFOA
perfluorooctanoic acid
PFOS
perfluorooctanesulfonic acid
PFPeA
perfluoropentanoic acid
PFPeS
perfluoropentanesulfonic acid
PPARα
peroxisome proliferator-activated receptor-alpha
ppb
parts per billion
ppt
parts per trillion
QA/QC
quality assurance and quality control
Q-RT-PCR
quantitative-real time-polymerase chain reaction
RB
raised bed
RC
regenerated cellulose
RCF
relative centrifugal force
ROS
reactive oxygen species
RPD
relative percent difference
RSD
relative standard deviation
SLC
stem Leydig cell
SPE
solid phase extraction
TOC
total organic carbon
USA
United States of America
1
CHAPTER 1
BACKGROUND AND LITERATURE REVIEW
1.1 Definition and History
Per- and polyfluoroalkyl substances (PFAS), previously known as
perfluorinated chemicals (PFCs), are a large class of anthropogenic chemicals.
They consist of an alkane chain of carbon atoms saturated with fluorine atoms
with one end of the carbon chain capped with either a carboxylic acid or a
sulfonate group. A generic structure for both the carboxylic acid and sulfonate
capped PFAS is shown in Figure 1. The carbon chains can range from very few
carbon atoms in the chain to very many, thus making the class of PFAS very
large. Owing to the physical properties of the C-C bonds, C-F bonds, and
–oic
acid/sulfonate functional groups, PFAS are amphiphilic in nature. The saturated
fluorine tail is highly hydrophobic and the functional head groups are hydrophilic.
This makes them resistant to both oils and water as well as being good
surfactants useful for aiding in extinguishing petroleum based fires.
1,2Because of
their wide array of useful properties and applications, PFAS have been heavily
Figure 1
. Image showing generic stick structure of PFAS anions capped with
either a carboxylic acid or sulfonate group, n denotes that the hydrophobic C-F
chain can be longer or shorter depending on the specific PFAS molecule
2
used worldwide in cookware, food packaging, clothing, carpets, firefighting foam,
and many other products. Annual worldwide production of these chemicals is on
the order of millions of kilograms.
2,3PFAS have now been found in air, soil,
water, rain, snow, biota, and human serum in many countries across the globe
and are now realized as ubiquitous pollutants.
4-11PFAS have a fairly long history of use around the world. Perfluorooctanoic
acid (PFOA) and perfluorooctanesulfonic acid (PFOS) were first synthesized by a
company named 3M (makers of
Scotch™ tapes and Post-it
®notes) in the
1940s.
12After being studied, the compounds were quickly realized as being
resistant to both oils and water. These observations resulted in PFOS and PFOA
being mass produced. By the 1960s, PFOS was being used to develop aqueous
film-forming foam (AFFF), which was used primarily at airports and military bases
in the USA to extinguish petroleum based fires.
12In the 1970s, both the National
Academy of Sciences and 3M independently determined that PFOA was
completely resistant to environmental degradation and would likely persist in the
environment. In the early 2000s, this was re-determined by the EPA. Currently,
all American companies that have used PFAS in the past have phased out
legacy PFAS (7 or 8 carbons long) and have begun switching to shorter chain
PFAS (fewer than 7 carbons long). However, now that some legacy PFAS are
ubiquitous pollutants and resistant to degradation, switching to shorter chain
PFAS will likely do little to impact the general widespread environmental pollution
by PFAS chemicals.
3
1.2 Chemical Properties
As mentioned previously, the chemical properties of PFAS compounds
make them very unique with a large number of different commercial and
industrial applications. This section will briefly cover some of the typical chemical
properties as well as identifiers such as CAS registry numbers. Due to the nature
of the PFAS chemicals, some properties are difficult to determine experimentally
so models are used to estimate some chemical properties such as solubility in
water and the octanol-water partition coefficient, or K
OW.
13In order to estimate
Table 1
. PFAS compounds studied in this experiment with abbreviations,
chemical properties, and identifying information
Name (abbreviation) CAS Registry Chemical Formula Molecular Weight (g/mol) Aqueous Solubility Log KOW Perfluorooctanesulfonic acid (PFOS) 1763-23-1 C8HF17O3S 500.13 3.2 x 10 -3 mg/L @ 25oC (estimated) 4.49 (estimated) Perfluorooctanoic acid (PFOA) 335-67-1 C 8HF15O2 414.07 3300 mg/L @ 25oC14 4.81 (estimated) Perfluoroheptanesulfonic acid (PFHpS) 375-92-8 C7HF15O3S 450.12 n/a 3.82 (estimated) Perfluoroheptanoic acid (PFHpA) 375-85-9 C 7HF13O2 364.06 4.37 x 10⁵ mg/L @ 25oC13 4.15 (estimated) Perfluorohexanesulfonic acid (PFHxS) 355-46-4 C6HF13O3S 400.12 6.2 mg/L @ 25oC (estimated) 3.16 (estimated) Perfluorohexanoic acid (PFHxA) 307-24-4 C6HF11O2 314.05 15,700 mg/L @ ambient temperature15 3.48 (estimated) Perfluoropentanesulfonic
acid (PFPeS) 2706-91-4 C5HF11O3S 350.11 n/a n/a Perfluoropentanoic acid (PFPeA) 2706-90-3 C 5HF9O2 264.05 n/a n/a Perfluorobutanesulfonic acid (PFBS) 375-73-5 C4HF9O3S 300.10 510 mg/L @ temperature not specified16 1.82 (estimated) Perfluorobutanoic acid
4
the Log K
OWvalues for these PFAS compounds, the Kowwin version 1.67
provided by the USEPA.
An interesting trend in PFAS molecules is the decreasing value of log K
OWas tail length decreases. The octanol-water partition coefficient measures how a
chemical species behaves when introduced to a system of octanol and water. It
is used to show if the chemical species in question will congregate more in the
octanol layer or the water layer. This value is used commonly in environmental
chemistry to predict whether a chemical is likely to be retained in the fatty lipids
inside of someone’s body, or if the body is able to excrete the chemical as
waste.
17The implications of the observed trend in decreasing log K
OW
based on
tail length are that legacy PFAS like PFOS and PFOA are much more
bioaccumulative than their shorter chain counterparts, such as PFBS. This is
because the chemicals will be retained in fatty areas of the body and are much
more difficult for the body to excrete. Reported elimination half-lives in human
adults for PFOA and PFOS have shown to be around 3 years and 5 years
respectively, with some studies showing elimination half-lives on the scale of
decades.
13Conversely, elimination half-lives in human adults for shorter chain
PFAS like PFBA and PFBS have shown to be around 72 hours and 665 hours
respectively.
13Clearly, the length of the hydrophobic tail has significant effects on
how these compounds interact with the environment and living organisms. The
effect of how tail length affects PFAS transport through soil will be discussed
later in the chapter.
5
1.3 Toxicity
Toxicity of the PFAS compounds studied in this experiment will be broken
into sections based on the individual compounds, starting with the more common
legacy PFAS.
1.3.1 Toxicity of PFOS and PFOA
1.3.1a PFOS
Few data exist regarding the toxicity of PFAS in humans. There are,
however, many studies regarding the toxicity of various PFAS in different animals
and plants. Because PFOS was one of the most widely used PFAS for decades,
many toxicity studies concerning PFAS were done on PFOS specifically. The
range of these studies has been very wide, including studies on mice and rats,
marine biota, and even some plants. These studies have shown various effects
on these living organisms. This section on PFOS toxicity will highlight some of
these various studies and cover some key results, particularly from recently
published data.
The first study mentioned here is one reported by Reardon et al. (2019).
This team studied the neurodevelopmental and metabolomic responses in
Sprague-Dawley rats from prenatal co-exposure to PFOS and methyl mercury
(MeHg).
18Although the study focused mainly on co-exposure with these two
chemicals, part of the study included prenatal exposure to PFOS alone without
the addition of MeHg. Beginning on the first day of pregnancy, the mother rats
were dosed orally with gelatin capsules containing 1 mg/kg body weight of
PFOS. Dosage continued until weaning at 21 days after birth. After many
6
different behavioral tests and studies conducted on the offspring and
metabolomics tests performed on select regions of the brain, the results showed
that administration of PFOS alone did not affect the growth of the pups but did
affect the behavior of the pups as shown with increased activity or hyperactivity
when compared to the control group. In pups exposed to PFOS an increase in
aspartic acid, glycine, serine, and N-methyl-D-aspartate (NMDA) receptor
agonists was observed in the frontal cortex. It was hypothesized that the
observed hyperactivity resulted from stimulated NMDA receptors due to the
increased agonists for these receptors. In addition to these increased amino
acids and NMDA receptor agonists, the researchers observed lower levels of
cortical lipids such as phosphatidylcholine and sphingomyelins. The data from
this study suggest that prenatal exposure and pre-weaning exposure to PFOS
results in altered lipid metabolism in the frontal cortex, as well increased levels of
various amino acids and NMDA receptor agonists which manifests as
hyperactivity. More research needs to be done to better understand the exact
mechanism by which PFOS affects the levels of amino acids and NMDA receptor
agonists in the brain.
Another study done by Martínez et al. (2019) aimed to define the actual
mechanisms of PFOS toxicity in zebrafish embryos by combining morphological
and transcriptomic analyses.
19This study first took zebra fish embryos at 2-5
days post fertilization (dpf) and exposed them to varying levels of PFOS in order
to determine the lowest observed adverse effect concentration (LOAEC) by
observing any morphological changes in the embryos. Once the LOAEC was
7
determined, concentrations below the LOAEC were used for the transcriptomic
analyses. The results from the transcriptomic analyses showed that at low
aqueous concentrations of PFOS (similar to environmental concentrations at
ng/L scale), genes related to natural immunity and defense against infections
were significantly affected as well as other genomic regions. Specific regions of
the genome affected included ones that influence cell adhesion, cell-cell
signaling, apoptosis, and immune response. Essentially, this study confirmed that
PFOS exposure at a molecular level comparable to levels already found in
human serum can adversely affect the immune system of zebrafish. These
results led the authors to push for revised regulations on tolerable levels of PFOS
for human health.
Different from animal studies, a study done by Qian et al. tested PFOS
exposure on two different species of riparian plants, Acorus calamus and
Phragmites communis
in order to determine the toxic effects of PFOS on these
plants.
20The study took these two different riparian plants and used a hydroponic
system to expose the plants to natural lake water that had been spiked with
varying levels of PFOS over 48 days. Random plants were selected for testing at
0, 3, 6, 12, 24, and 48 days into the experiment. The team analyzed samples
from the leaf, stem, and root regions of the plants. The study looked at multiple
indicators of plant health including chlorophyll levels, soluble protein contents,
and oxidative stress response. The results showed that with higher
concentrations of PFOS (up to 50 mg/L) there were lower levels of chlorophyll
until day 24, at which point the chlorophyll levels seemed to stabilize and, in most
8
cases, began to rise again. This gave an indication that the plants were able to
adapt somehow to the PFOS exposure and work to regain their natural levels of
chlorophyll. The results from this part of the study showed that at lower levels of
PFOS (0.1 mg/L and 1 mg/L) the soluble protein content of the plants actually
rose. At higher levels of PFOS (50 mg/L), however, the soluble protein content
decreased significantly. PFOS was also shown to increase oxidative stress
resulting from higher levels of malonaldehyde and hydrogen peroxide and
actually decreased the activities of various antioxidant enzymes such as
superoxide dismutase, catalase, and peroxidase. Overall the study showed that
the levels of PFOS that have been found in the environment can have noticeable
effects on plant health such as reduced chlorophyll levels, increased oxidative
stress, and decreased levels of various soluble proteins.
Unfortunately, animal and plant studies are not always comparable to
human toxicity or effects from chemicals in humans. However, there have been
large-scale studies done on human populations that have looked for correlations
between PFOS exposure and health effects in various populations. A division of
the U.S Department of Health and Human Services called the Agency for Toxic
Substances and Disease Registry (ATSDR) has published a toxicological profile
for PFAS substances with information from studies done on PFAS up to June of
2018.
13Due to the nature of these studies on various populations, only
correlations can be drawn and direct causality cannot necessarily be proven.
Regardless, results from these large scale studies have shown that there is a
correlation between PFOS exposure and pregnancy-induced
hypertension/pre-9
eclampsia, liver damage characterized by increased serum enzyme levels and
decreased serum bilirubin, increases in serum lipids (mostly total cholesterol and
low-density lipoprotein cholesterol), increased risk of thyroid disease, decreased
antibody response to vaccines, greater risk of decreased fertility, small
decreases in birth weight, and greater risk of testicular and kidney cancer.
13Between results from various animal and plant studies and results from studies
on human populations exposed to PFOS, it seems that PFOS is toxic to
biological systems and has the capacity to adversely affect human health and
homeostasis.
1.3.1b PFOA
Although the chemical structure of PFOA is very similar to PFOS, the
carboxylic acid functional group lends some unique characteristics to PFOA that
differentiate it from PFOS. This section looks at several studies focused on
PFOA for various toxicity effects in living organisms.
The first study highlighted here for PFOA toxicity was one done by Crebelli
et al. and focuses on the ability of PFOA to induce genotoxic effects in mice.
21While PFOA has not been shown to directly cause genotoxic effects, it has been
thought to generate various reactive oxygen species (ROS) that can then lead to
subsequent genotoxicity through oxidative stress. Interestingly, the results from
this study showed that extended PFOA exposure in mice (up to 5 mg/kg body
weight) from drinking water did not lead to genotoxicity through oxidative stress.
However, the study did show that the PFOA exposure led to liver toxicity,
10
weight, and increased liver weight at both exposure levels of 1 mg/kg body
weight and 5 mg/kg body weight. The liver toxicity from PFOA exposure at 5
mg/kg body weight was manifested as less compact and less homogenous liver
parenchyma tissue which showed cytoplasmic vacoulation and hepatocellular
hypertrophy (thought to be the reason for increased liver weight).
A second study done by Lu et al. has observed the relation between
PFOA exposure and reproductive organ toxicity in male rats.
22The goal of this
study was to mimic pubertal development in 49 day old Sprague-Dawley rats by
using ethane dimethyl sulfonate (EDS) to eliminate adult Leydig cells (ALCs) in
the rats and then expose the rats to PFOA orally to study the progress of
transformation of stem Leydig cells (SLCs) into immature Leydig cells (ILCs) and
finally into a new generation of ALCs. Results from this study showed that PFOA
has the capacity to significantly delay the maturation of SLCs into ALCs resulting
in lower levels of testosterone in the rats. Overall, this study showed that PFOA
can be toxic to SLCs in testis and is of concern to pubertal boys exposed to
PFOA.
A third study by Du et al. intended to characterize the toxic effects of
PFOA as an endocrine disrupting chemical in zebrafish and steroidogenic effects
in H295R human cancer cells.
23The study took zebra fish embryos that were
forming normally at 4 hours post fertilization (hpf) and exposed them to PFOA at
concentrations of 100, 200, and 500 µg/L. After exposure to the PFOA solutions
for 120 hours, results from quantitative-real time-PCR (Q-RT-PCR) showed that
the gene expression levels for esr1 at 500 µg/L were significantly elevated and
11
expression levels for hhex and pax8 were significantly up-regulated in the
zebrafish. When the H259R cells were studied, they found that PFOA exposure
had decreased levels of testosterone
and induced gene expression of 17βHSD1,
CYP19, 3βHSD2, and CYP11B2—all of which are enzymes that play significant
roles in the endocrine system. PFOA exposure in the H295R cells also reduced
17βHSD4 expression and lowered levels of SF-1. The results from this study
show that PFOA has the capacity to affect estrogen receptor genes, early thyroid
development genes, and steroid synthesis genes showing toxicity to the
endocrine system.
The ATSDR also included PFOA in their toxicological profile report for
PFAS chemicals. Interestingly, PFOA showed many of the same results as
PFOS when exposed populations were studied.
13This may be because both
PFOS and PFOA are considered ubiquitous pollutants, so many of the
individuals included in these studies may have had both PFOS and PFOA
present in their bodies. Nonetheless, results from these studies summarized by
the ATSDR showed that PFOA is correlated with pregnancy-induced
hypertension/pre-eclampsia, liver damage, increases in serum lipids, increased
risk of thyroid disease, decreased antibody response to vaccines, increased risk
of asthma diagnosis, increased risk of decreased fertility, and small decreases in
birth weight.
131.3.2 Toxicity of Other PFAS
The vast majority of health and toxicity studies done on PFAS compounds
are focused on PFOS and PFOA which have historically been the most widely
12
used PFAS compounds. The focus on PFOA and PFOS has led to very little data
generated on the toxicity of other PFAS. For example, the ATSDR toxicological
review on PFAS compounds included 187 animal studies of which only seven
included PFHxS and PFHxA and only six included PFBA. None of the studies
included in the ATSDR review (animal or human) include PFBS, PFPeS, PFPeA,
or PFHpS. The toxicity of these other PFAS compounds should be of great
concern because now that legacy PFAS have been phased out, the shorter chain
PFAS compounds are now being used as replacements in the products that used
to contain legacy PFAS. This increased use of short chain PFAS results from an
effort to replace legacy PFAS in products that still have a high demand for use,
such as the AFFFs at airports and military bases.
1.3.2a PFHpS and PFHpA
No significant toxicology data exists for PFHpS. PFHpA has been shown
to activate mouse and human peroxisome proliferator-activated receptor-alpha
(PPARα) in COS-1 cells, suggesting there are some hepatotoxic effects.
241.3.2b PFHxS and PFHxA
According to the ATSDR review, PFHxS in humans may cause liver
damage marked by increase in serum enzymes and decreases in serum bilirubin
levels and can also affect response to vaccines by decreased antibody levels.
13PFHxS and PFHxA have shown to activate mouse and human
PPARα in COS-1
cells, suggesting there are some hepatotoxic effects.
1313
1.3.2c PFPeS and PFPeA
No significant toxicology data exists for PFPeS. PFPeA has been shown
to activate mouse and
human PPARα in COS-1 cells, suggesting there are some
hepatotoxic effects.
241.3.2d PFBS and PFBA
Since legacy PFAS have been phased out, the main replacement for
PFOS has been PFBS. Because of this, there has been more focus on the
toxicity of PFBS than there has been on other short chain PFAS. A study done
on zebrafish embryos by Sant et al. found that when zebrafish embryos were
exposed to up to 32 µM PFBS, the embryos showed a slight increase in tail
deformities, cranial malformations, and failure to inflate the swim bladder. The
PFBS exposure also affected several genes related to lipid metabolism.
25A
different study done by Chen et al. on how PFBS exposure at environmentally
relevant concentrations affects marine medaka, O. melastigma, showed that
PFBS has the ability to accumulate in the eyes and resulted in potential adverse
effects to visual function through neural signaling pathways.
26A third study by
Chen et al. compared the toxic effects of PFBS to PFOS by exposing
Caenorhabditis elegans
to high levels of PFBS that resulted in similar internal
concentrations as PFOS.
27The results from this study showed reproductive
toxicity marked by decreased egg production and brood number, increased
capacity of germ cell apoptosis through upregulated expression of pro-apototic
genes egl-1 and ced-13, and increased ROS levels. So far, many of the studies
done on PFBS toxicity have concluded that PFBS is much less bioaccumulative
14
than PFOS but if high enough concentrations are reached in the body, it can
have similar toxicities to PFOS, the compound it has been intended to replace.
The study done by Wolf et al. on PPARα activation also included PFBA,
and similar to other PFAS carboxylates, showed that PFBA can activate mouse
and human
PPARα in COS-1 cells, suggesting there are some hepatotoxic
effects.
13Other than this, studies included in the toxicological review by the
ATSDR showed that PFBA is not toxic developmentally, immunologically, to the
respiratory system, cardiovascular system, gastrointestinal system, renal system,
bone and skeletal muscle system, endocrine system, brain, spinal cord, or
reproductive system. Th
e only finding other than PPARα activation was that
PFBA can affect the hematological indices manifested as reduced red blood cell
count and hemoglobin.
131.4 Use of PFAS on Military Bases in U.S.A. and Resulting Pollution
One of the major uses of legacy PFAS has been in AFFFs at military
bases. As stated earlier, these AFFFs containing legacy PFAS are used to
extinguish petroleum-based fires. AFFFs are effective at rapidly extinguishing
petroleum-based fires because they are able to spread across the surface of the
fire separating the fuel source from the flames. A secondary characteristic of
AFFFs containing fluorosurfactants is that after they separate the fuel source
from the flames, the film that forms across the surface of the fuel prevents
flammable vapors from escaping and spreading. This makes these AFFFs
effective at both extinguishing a fire and preventing re-ignition of the fuel, which
is a serious concern in any petroleum-based fire. This multi-action effectiveness
15
of these foams has vast use across the country in very large quantities for either
training or extinguishing actual fires that occur, particularly on military bases and
airports.
Since their implementation in AFFFs in the 1960s and the beginning of
their phase out by American manufacturers in 2000, it has been shown that the
decades of use has led to extensive PFAS pollution in drinking water and
groundwater within and around military bases.
28This water pollution has affected
many communities near military bases across the country and at/near American
military bases in other countries as well.
28In March of 2018, the Department of
Defense (DoD) published a document outlining PFAS levels in drinking water
sourced by any branch of the DoD (Air Force, Army, Navy, and Defense Logistics
Agency) as well as some private drinking water sources located nearby military
bases. The document also detailed any actions that might have been taken by
the military in attempts to sever the exposure pathway of PFAS into humans from
drinking water
—for example, providing bottled water to residents of an affected
community.
28The published results showed that out of 2,668 private groundwater
wells located near military bases, 1,621 tested above the EPA Lifetime Health
Advisory (LHA) for PFOS/PFOA set in 2016.
28Results from the testing of military
supplied drinking water showed that out of 524 drinking water systems supplied
by the DoD, 24 tested above the EPA LHA for PFOS/PFOA.
2816
1.5 EPA Health Advisory Limit, Impact on Venetucci Farm, and Impact on
Surrounding Areas
In 2016 the EPA set new LHAs on two PFAS compounds, PFOS and
PFOA.
28These LHAs were set at 70 parts per trillion (ppt or ng/L) individually or
combined for PFOS and PFOA. Soon after the new LHA was set by the EPA, it
was found that the water supplied by Venetucci Farm from the Widefield Aquifer
in Colorado Springs exceeded the new LHA. Owners of the farm quickly stopped
all food production since PFAS were being found in the water above the LHA
limit. The caretaker of the farm also privately sent samples of various crops and
food from the farm to a private lab, which reported that the samples had been
contaminated by PFAS compounds. This has been a significant point in time for
the farms history as being the last historical farm in El Paso County, and now all
food production on the farm has been stopped. This pollution by PFAS chemicals
has essentially shut the farm down.
Venetucci Farm sits on top of a very shallow and long aquifer called the
Widefield Aquifer. For decades, the farm watered all of it crops using water
pumped up from this aquifer. The owners of the farm also leased water to the
Colorado Springs Utilities company, which was then used to supply many homes
in the Census-Designated Place of Security-Widefield. Water from these homes
also tested above the EPA LHAs for PFOS and PFOA. Results from an official
investigation by the Air Force concluded that the use of AFFF and water
containing PFAS at a nearby Air Force base was the leading cause of
groundwater pollution with PFAS in the Widefield Aquifer.
2917
1.6 PFAS Transport and Prediction for Venetucci Farm
Over the years, many locations and methods of PFAS release into the
environment have been identified. As previously stated, one of the major
methods of release has been from the use of AFFFs on military bases and
airports. However, there are many other pathways for PFAS to enter the
environment, such as through the waste of consumer products containing PFAS
or wastewater treatment plants discarding sludge containing PFAS.
30A typical
transport path of PFAS through the environment starts with the pollution of
groundwater, and from there makes its way through soils, sediments, surface
water, and even through the atmosphere.
31An important consideration of how
PFAS move through the environment is their characteristic hydrophobic tails and
polar heads. Because of this amphiphilic property, PFAS typically gather at
media interfaces, for example a water/soil interface or a water/air interface.
30In
addition to media interfaces, there are also factors within soil that also affect
PFAS transport and adsorption to soils, such as the organic carbon content of
the soil.
32-34Furthermore, different PFAS will have different adsorption behavior
in soils based on the tail length of the fluorinated carbon chain or whether the
head group is a carboxylate or sulfonate.
32Overall, the research that has been
done on PFAS transport and adsorption to sediments has thus far shown that the
amphiphilic nature of PFAS molecules and their broad range of structures makes
PFAS transport very complicated, and is still not well understood.
Venetucci Farm has been an agricultural location for many decades,
which means the soil is rich with organic carbon. Furthermore, some soils on the
18
farm have been more heavily farmed than other parts of the farm. These
attributes of the soil and farming patterns over decades can have several
implications for PFAS transport through the soils at the farm. It has been shown
that longer chain PFAS will sorb more strongly to soils with higher amounts of
organic carbon, implying that organic carbon content in the soil is a large factor of
influence on PFAS transport and adsorption.
34The reason for this is that organic
carbon in soil is generally a product of natural decay from once living organisms.
A lot of the organic carbon from this decay exists as nonpolar carbon chains that
can interact with the nonpolar tails of PFAS more strongly based on tail length.
When a PFAS has a longer tail, there is more opportunity for interaction with the
organic carbon found in a soil, leading to stronger sorption. For Venetucci Farm,
this means that PFAS are more likely to strongly adsorb to organic carbon in the
soil on the farm rather than travelling with water flow and being transported off
the farm. Also, this means that some soils on the farm are more likely to have
higher concentrations of legacy PFAS relating to how heavily the soil was farmed
and amended compared to other parts of the farm. Shorter chain PFAS
molecules do not follow the same type of adsorption chemistry as the longer
chain PFAS.
34The shorter hydrophobic chain leads to a weaker hydrophobic
interaction with any surrounding material, mainly organic carbon in soil.
Therefore, adsorption and transport of shorter chain PFAS in soils or sediments
is more strongly driven by things like electrostatic potential, the mineral
composition of the soil, and the actual chemistry of the water travelling through
the soil.
19
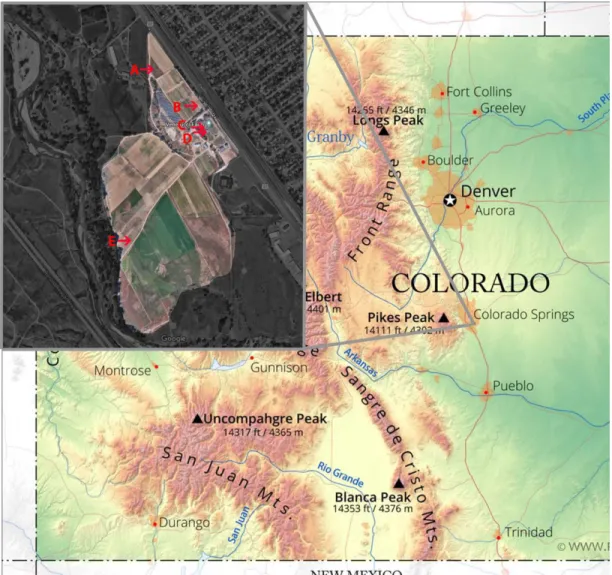
1.7 Experiment Parameters and Hypothesis
For this experiment, five locations spread across Venetucci Farm were
chosen to measure the concentration of several PFAS once a month over the
course of one year. The molecules listed in Table 1 are the PFAS compounds
that were monitored in this study. The sample locations ranged from a heavily
farmed location at a higher elevation on the property (Soil 1, see Figure 2), a
heavily farmed location at a higher elevation on the property further away from
Figure 2
. Map showing location of Venetucci Farm in greater Colorado area and
sample locations on the farm with Pinello (A), Soil 1 (B), Raised Bed (C), Hoop
House Basil (D), and Lower Field (E)
20
the main house (Pinello, Figure 2), raised bed soil (RB, see Figure 2), soil from
inside a small hoop house not exposed to natural precipitation (HHB, see Figure
2
), and soil that was very lightly farmed at a lower elevation on the property (LF,
see Figure 2). To obtain the soil samples, a trowel was used to dig down
approximately 3 inches beneath the surface and soil was scraped from the side
of the small hole into a 50-mL Falcon tube. Samples were then labeled and
frozen until analysis. Extraction of target PFAS was carried out using a simple
liquid extraction and clean up was carried out using solid phase extraction (SPE)
in order to isolate the analytes into a clean solvent in order to protect the
instrumentation. Quantitation of PFAS in samples was carried out using high
performance liquid chromatography coupled to tandem mass spectrometry
(HPLC-MS/MS) detector using a triple quadrupole mass analyzer.
Due to the nature of the different sample locations and history of the farm,
there are several hypotheses for PFAS concentrations in the soil over time at
Venetucci Farm. First, it is hypothesized that soil from the raised bed will have
some of the highest concentrations of legacy PFAS due to the organic carbon
rich soil, while the in-ground locations of Soil 1 and Pinello will have slightly lower
concentrations of legacy PFAS because of natural water flow through these
locations. Second, LF soil will likely have the lowest concentrations of legacy
PFAS due to having less organic carbon in the soil from less intensive farming
over the years. Third, Concentrations of shorter chain PFAS will most likely be
highest in the HHB samples because of the protection from natural precipitation
and weathering. Finally, over time, it is expected that legacy PFAS and shorter
21
chain PFAS concentrations in all sample sites will remain relatively steady over
the course of a single year, with only minor fluctuations. This predicted resistance
to changes in concentration are because of the persistent nature of PFAS
molecules mentioned earlier (the resistance to degradation in a natural
environment and their ubiquitous presence).
In order to get a more quantized prediction on the levels of PFAS that will
be found during this study, data regarding the concentration of PFAS in the well
water from Venetucci Farm and several equations can be used.
17By using the
water data gathered by UCCS previously, the estimated log K
OWvalues for the
PFAS compounds, and the total organic carbon in the different sample sites,
actual concentrations can be predicted. First using the estimated log K
OWof a
PFAS and Equation 1, the organic matter partition coefficient (K
OM) can be
calculated.
𝐿𝑜𝑔 𝐾
𝑂𝑀= +0.82𝐿𝑜𝑔𝐾
𝑂𝑊+ 0.14
Equation 1
Once KOM is calculated, the relationship between fraction of organic matter
(ƒ
OM), the solid-water distribution coefficient (K
d), and K
OMcan be used to
calculate K
dusing Equation 2. Soil from each sample site was sent to the
Colorado State University Soil, Water and Plant Testing Laboratory in Fort
Collins, Colorado to be tested for Total Organic Carbon (TOC). This TOC is
converted to decimal form and used for
ƒ
OM.
𝐾
𝑂𝑀=
𝐾𝑑22
Finally, Equation 3 can be used to calculate the predicted concentration
that will be found in the soil at Venetucci Farm. The value for C
waterwas used
from the UCCS data of PFAS concentration in well water at Venetucci Farm.
𝐾
𝑑=
𝐶𝑠𝑜𝑙𝑖𝑑𝐶𝑤𝑎𝑡𝑒𝑟