THESIS
ALTERATION OF ORGANIC MATTER AND COPPER MINERALIZATION IN THE MIDCONTINENT RIFT, USA
Submitted by Max Schultz
Department of Geosciences
In partial fulfillment of the requirements For the Degree of Master of Science
Colorado State University Fort Collins, Colorado
Summer 2017
Master’s Committee:
Advisor: John Ridley Sally Sutton
Copyright by Max Schultz 2017 All Rights Reserved
ABSTRACT
ALTERATION OF ORGANIC MATTER AND COPPER MINERALIZATION IN THE MIDCONTINENT RIFT, USA
This study applies petrographic, organic and isotopic geochemical analyses in an effort to discern the vertical and lateral dimensions or conduits of detectable main stage mineralization partial oxidation, heating, and fluid flow in and near the sediment-hosted stratiform Cu deposits in the Midcontinent Rift. Field and core samples from a 100 km traverse along strike of the Nonesuch Formation are analyzed at atomic, molecular, micro- and macroscopic levels for comparison to address the problem. Analytical tools - optical petrography (68 samples), Rock-Eval II (RE; 74 samples) pyrolysis, gas chromatography and gas chromatography-mass
spectroscopy (GC and GC-MS; 9 samples), as well as stable isotopic analyses of C and O (δ13C and δ18O; 27 samples) - and their results here compared indicate that partial oxidation of organic matter (OM) does not exclusively co-occur with Cu mineralization.
Two morphologies of OM with distinct geochemical and petrographic characteristics have been identified. Filamentous organic matter (FOM) is generally darker colored opaque inertinite while amorphous organic matter (AOM) is lighter in color and commonly translucent. Reflected and transmitted light microscopy identified disseminated chalcocite and chalcopyrite mineralization; this mineralization coincides with darker average AOM color (higher thermal alteration index or TAI). Most of the seven identified vertically breached dark gray shaley laminations are Cu mineralized and situated in the lower to middle portion of their respective sections.
Outcrop samples show significantly lower quotients of RE hydrogen index to oxygen index (HI/OI) and values of total organic carbon (TOC) than do drill core specimens. Core profiles show gradients of increasing HI and decreasing OI stratigraphically up-section, when outlier values are excluded, and the HI gradient is steeper with respect to stratigraphic position than is typical for sedimentary basins. Oxygen index values increase with proximity to Cu minerals and the lowest HI samples are from in and adjacent to mineralized rock at or near White Pine, MI. Most Cu mineralized samples show OI above 30 mg CO2/g TOC with HI under 72 mg
HC/g TOC and the opposite is true for the HI of most unmineralized samples.
The FOM shows a lower H/C ratio than does the AOM. Darker colored AOM and lower HI/OI quotients than in unmineralized Nonesuch Formation material are apparent in Cu
mineralized samples. The lowest Tmax and highest HI values are in unmineralized orange (low
TAI) AOM, and nearly 70% of the darker brown AOM samples are Cu mineralized. No overall correlation between other RE parameters, Cu mineralization and TAI is apparent, however. All of the samples containing breached shaley laminae show low TOC but show no other relation to RE parameters.
Four measures of organic maturity - the production, thermal alteration, and methylphenanthrene-1 indices, and the C29 Ts/(C29 hopane + C29 Ts) parameter - show
bidirectionally increasing thermal maturity of OM outward from the four central sampling sites. This aligns with multiple previous studies which have reported a paleothermal low in the vicinity of the Iron River syncline. A strong linear correlation on cross plot of C29 sterane ββ/(ββ+αα)
versus C29 sterane S/(S+R ααα) suggests that the gas chromatography-mass spectroscopy
A single organofacies source is suggested by the pristane/n-C17 and phytane/n-C18
quotients and their crossplot. The distribution of tricyclic terpanes and the presence of 1,2,5-TMN in all samples, with the occurrence of C32 αα methylhopanes a majority of gas
chromatography-mass spectroscopy samples concur with recent paleobiological reports of a significant cyanobacterial contribution to Nonesuch Formation OM.
Three generic patterns of OM alteration are distinguished by GC and GC-MS: least altered, partially altered, and altered; no relation to Cu mineralization is apparent for any of the three categories. Least altered samples have whole rock extract chromatograms typical of source rocks in the upper half of the oil window - a broad, smooth GC trace, dominated by alkanes n-C11 to n-C14 with associated peak clusters of monomethyl alkanes commonly associated with
Proterozoic carbonaceous rocks. Altered samples show sharp narrow whole rock extract GC traces distinguished by 2-4 dominant n-alkanes, lack peaks of clusters of homologous sets of monomethyl alkanes, and have lesser abundance of alkanes, and a conspicuous higher abundance and broader array of polycyclic aromatic hydrocarbons (PAHs). The partially altered sample shows a bimodal GC trace distinct from those of the other two categories. Rock-Eval II HI values overlap for the altered and least altered samples, whereas the OI values are higher for altered samples, with the latter also showing the highest Tmax value.
The presence of sterane and terpane biomarkers at White Pine, MI discounts previous studies' assertion that their absence indicates a strictly localized oxidative destruction of such compounds during Cu mineralization. All analyzed samples have significant non-biomarker PAHs and derivatives thereof, including: 3-methylbiphenyl, phenanthrenes,
trimethylnaphthalenes, dibenzothiophene (DBT), dibenzofuran (DBF), fluorene,
associated with localized Cu mineralization. In contrast, diminished values of DBT and DBF relative to either methylated or dimethylated homologues in Cu mineralized samples are
interpreted to reflect a localized effect of epigenetic OM oxidation associated with mineralization and alteration. The pristane/n-C17 is elevated in the Cu mineralized samples, consistent with
localized oxidative destruction of n-alkanes during mineralization. It is suggested that dehydrocyclization of phenylphenanthrenes during Cu mineralization formed the observed benzofluoranthenes and benzopyrenes. The phenanthrene/Σmethylphenanthrene parameter shows regular relation to HI/OI quotient, although it is less well correlated to Cu mineralization, HI or OI than in other studies.
Decreased concentrations of saturated compounds associated with Cu mineralization, as well as moretane/hopane, C29 Ts/(C29 hopane + C29 Ts), and trimethylnaphthalene index
measures, and an interpreted thermal cracking of long chain hydrocarbons to form diamantanes during Cu mineralization, indicate localized increases in maturity of OM occurs in Cu
mineralized samples in the central portion of the sampling traverse (within the overall thermal maturity low in the central sites of the sampling traverse). However, aside from diminished abundance of saturated hydrocarbons, some counterexamples to these Cu
mineralization-associated organic maturation parameters exist, and no regular relation of any of these measures to depth is apparent.
A ternary plot comparing relative abundances of DBT, DBF and fluorene shows the gas chromatography-mass spectroscopy samples clustered nearest to the thiohydrocarbon DBT vertex of the plot, with the implication of relatively little oxidative alteration but considerable S introduction for the subset of GC-MS samples. In contrast, the position of the GC-MS samples
on the DBT/phytane axis of the plot comparing DBT/phytane versus pristane/phytane suggests relatively little introduction of S with significant aromatization.
An overall trend of low δ18O at lower δ13C exists for carbonates of the Nonesuch
Formation. No relation between carbonate vein, concretion or laminite isotopic ratios of C or O and depth or proximity to mineralization or between isotope ratios and elemental composition is apparent. Still, the most negative stable isotopic ratios co-occur with sections of Nonesuch Formation in which OM is mostly strongly oxidized, based on OI values. The upper end of isotopic ratios of carbonate C and O approximates that of Copper Harbor Formation
stromatolites, which is taken to be the primary carbonate composition in the sequence. The relatively broad spread to more negative δ13C values can be interpreted as a result of variable degrees of mixing with C derived by oxidation of indigenous OM. The lack of relation of carbonate isotopic ratios to distance to Cu mineralization suggests that OM oxidation likely took place throughout the Nonesuch Formation and was neither restricted to, nor strongly heightened in, Cu mineralized rocks.
ACKNOWLEDGEMENTS
This work would not have been possible without financial and intellectual support at CSU, particularly from John Ridley. Sally Sutton, Sven Egenhoff, and Judy Hannah each drove me forward, shared knowledge and enthusiasm for this project. The SEG Graduate Student Fellowship and the Malcolm McCallum Scholarship smoothed my path forward and brighten the way ahead. I am fortunate to have had such strong graduate program compatriots – Marissa Boraas, Jake McCane, and others – to assist in the many steps to this final product. My journey would not have been possible without the three human fundaments of any task that I tackle: Bob and Donna, and my dear Desirée. I cannot thank Philip Wells, Daniel Gourley, Z.L. Lucius, Teddy Schafer, Tom Kasper and Lucile Fiske enough for their support.
DEDICATION
A #2 dot-filling standardized test might not seem like a ticket to the Promised Land, but that is how my Uncle Orton Lynn Gray sprung my mother from the dead-end of servile Middle American womanhood. Rural North Dakota, late 1960s, Orton said, “Hey Donna, so there is this test called the ACT and I think that you should take it.” She did so, and the joys of university and biochemistry and worldliness became her. Orton Gray’s thirst for knowledge, his genuine egalitarian equanimity, his very offbeat self, and his humanitarian nature made Woodworth, North Dakota just the right spot for my mother to be in that time. We miss him, and work to carry on in his noble steps.
TABLE OF CONTENTS
ABSTRACT ... ii
ACKNOWLEDGEMENTS ... vii
DEDICATION ... viii
TABLE OF CONTENTS ... viiii
Chapter 1: Introduction ... 1
1.1 Problem and Context ... 1
1.2 Objectives ... 2
1.3 Study Area and Geologic History ... 2
1.3.1 Physiography and Genesis of the Midcontinent Rift ... 2
1.3.2 Stratigraphy of the Midcontinent Rift System ... 6
1.3.2.1 Bergland Group ... 8
1.3.2.2 Oronto Group ... 9
1.3.3 Climate ... 12
1.4 The Nonesuch Formation Sediment Hosted Stratiform Copper Deposits ... 12
1.5 Organic Geochemical Background ... 20
1.5.1 Kerogen Classification ... 26
1.6 Organic Geochemistry with Specific Reference to Precambrian Organic Matter ... 31
Chapter 2: Studies of Relations Between Organic Matter and Metal Ore ... 37
2.1: Kupferschiefer Stratiform Copper ... 38
2.1.1 Organic Geochemical Studies of the Kupferschiefer ... 39
2.2 Alligator Ridge Gold and Organic Alteration ... 51
2.3 Idrija Mercury Deposit ... 55
Chapter 3: Previous Organic Geochemical Studies of the Nonesuch Formation ... 57
3.1 Origin and Character of Nonesuch Formation Organic Matter ... 58
3.2 Organic Maturity of the Nonesuch Formation ... 59
3.2.1 Petrographic Appearance and Maturity ... 59
3.2.2 Geochemical Maturity ... 60
3.3 White Pine Oil Studies ... 62
3.4 Other Thermal Constraints for the Nonesuch Formation ... 64
3.5 Stable Isotope Ratios of the Nonesuch Formation ... 66
3.5.1 Nonesuch Formation Carbonate Carbon and Oxygen Isotopes ... 66
3.5.2 Nonesuch Formation Kerogen Pyrolyzate Carbon Isotopes ... 67
3.6 White Pine Chlorite Homogenization Halo ... 68
3.7 Organic Matter-Copper Relations at White Pine ... 68
3.8 Water-Washing and Organic Geochemistry at White Pine ... 71
Chapter 4: Methods ... 72
4.1 Thin Section Microscopy ... 72
4.2 Rock-Eval Pyrolysis ... 73
4.2.1 Total Organic Carbon Analysis ... 75
4.2.2 Rock-Eval and LECO TOC Inaccuracies and Thresholds for Reliability ... 75
4.4 Soxhlet, Gas Chromatography and Mass Spectrometry ... 78
4.4.1 Extract Gas Chromatography ... 79
4.4.2 Gas Chromatography-Mass Spectroscopy Principles and Analysis ... 79
Chapter 5: Sampling ... 82
5.1 Core Samples ... 84
5.1.1 Michigan Department of Environmental Quality Core Samples ... 84
5.1.2 Michigan Technical University Core Samples ... 85
5.2 Outcrop Samples ... 85
5.2.1 Copper Falls, Potato Creek, Saxon Falls, and Presque Isle River Outcrop Samples ... 89
5.2.2 Big Iron and Little Iron River Outcrop Samples ... 98
Chapter 6: Results ... 100
6.1 Petrography of Organic Matter, Copper and Calcite ... 100
6.2 Rock-Eval and LECO TOC Overall Pattern ... 103
6.2.1 Rock-Eval and LECO TOC Relation to Copper Mineralization ... 112
6.3 Stable Isotopes ... 120
6.4 Molecular Makeup of Organic Matter ... 127
6.4.1 Whole-Rock Extract Gas Chromatography ... 127
6.4.2 Saturate Gas Chromatography-Mass Spectroscopy ... 133
6.4.3 Aromatic Gas Chromatography-Mass Spectroscopy ... 136
6.4.3.1 Aromatic Gas Chromatography-Mass Spectroscopy Total Ion Current Chromatograms ... 136
6.4.3.2 Aromatic Gas Chromatography-Mass Spectroscopy Ion Chromatograms ... 145
6.4.3.3 Polycyclic Aromatic Compound Ternary Plot ... 153
Chapter 7: Discussion and Interpretation ... 156
7.1 Regional Variations in Apparent Maturity ... 156
7.1.1 Production and Thermal Alteration Indices ... 156
7.1.2 Methylphenanthrene and Methyldibenzothiophene Indices ... 157
7.1.3 Methylnaphthalene Indices ... 158
7.1.4 Pristane and Phytane Versus Associated Normal Alkanes ... 159
7.1.5 Moretane and Hopane Comparison ... 159
7.1.6 Ts/Ts+Tm Trisnorhopane and C29 Ts/(C29 Hopane +C29 Ts) Parameters ... 160
7.1.7 Geographic Distribution of Sterane Maturity Parameters ... 161
7.1.8 Pregnane ... 162
7.1.9 Soxhlet Extractable Organic Matter Yield ... 163
7.1.10 Long Versus Short Chain Triaromatic Steroids ... 163
7.1.11 Diamantanes ... 163
7.2 Variations in Apparent Maturity Related to Depth and Mineralization ... 164
7.2.1 Production and Thermal Alteration Indices ... 164
7.2.2 Methylphenanthrene and Methyldibenzothiophene Indices ... 165
7.2.3 Pristane and Phytane Versus Associated Normal Alkanes ... 165
7.2.4 Moretane and Hopane Comparison ... 165
7.2.5 Ts/Ts+Tm Trisnorhopane and C29 Ts/(C29 Hopane +C29 Ts) Parameters ... 165
7.2.6 Diamantanes ... 166
7.2.7 Methylnaphthalene Indices ... 167
7.2.8 Sterane Maturity Parameters, Copper Mineralization and Depth ... 167
7.3 Evidence for Organic Matter Oxidation ... 167
7.3.1 Rock-Eval Evidence for Organic Matter Oxidation ... 168
7.3.2 Relation of Hydrogen/Oxygen Index Ratio to Mineralization ... 167
7.3.3 Petrographic and Geochemical Distinction of Filamentous Versus Amorphous Organic Matter ... 169
7.3.4 Aromatization and Oxidation of Organic Matter ... 170
7.3.5 Phenanthrene and its Methylated Homologues ... 171
7.3.6 Fluorene and its Methylated Homologues ... 175
7.3.7 Dibenzofuran and its Methylated Homologues ... 175
7.3.8 Dibenzothiophene and its Methylated Homologues ... 176
7.3.9 Pristane to Phytane Ratio and Depositional Environment by Comparison to Dibenzothiophene Versus Phenanthrene ... 176
7.3.10 Pristane to Normal Heptadecane Ratio ... 178
7.3.11 Sterane Maturity Parameters and Oxidation of Organic Matter ... 179
7.3.12 Fluorene and Heteroatomic Fluorene Homologues ... 182
7.3.13 Polycyclic Aromatic Compound Ternary Plot ... 183
7.3.14 Stable Isotopes of Carbonate ... 184
7.4 Distribution of Organic Matter Oxidation ... 185
Chapter 8: Conclusion ... 189
References ... 192
Appendix A: Photomicrographs and Hand Sample Images ... 202
Appendix B: Sample and Analysis Listing ... 277
Appendix C: Locality, Field, and Core Log Descriptions ... 279
Appendix D: LECO TOC and Rock-Eval II Data ... 287
Appendix E: Carbonate Carbon and Oxygen Stable Isotope Data ... 293
Appendix F1: Total Extract Gas Chromatography Data ... 294
Appendix F2: Aromatic Gas Chromatography-Mass Spectroscopy Data ... 322
Appendix F3: Saturate Gas Chromatography-Mass Spectroscopy Data ... 369
1. Introduction
1.1 Problem and Context
Industry estimates suggest that many kilotons of recoverable Cu as fine-grained
disseminated sulfides are in place in and near the White Pine Mine, northern Michigan (Johnson, 2014). Current commercial interest, historic production greater than 3.5 billion pounds Cu, and incomplete understanding of the mode of metallization in the SSC deposits of northern Michigan justify the present analysis: A combined geochemical investigation with the goal of identifying pathways of Cu-associated hydrothermal fluid flow (Sirois, 2015).
Economic Cu ores, with variable minor Ag, sit near the base of the 200 m thick shaley siltstones of the 1.08 Ga Nonesuch Formation; the ores are stratiform bodies up to a few kilometers strike extent and up to a few meters thick in the lowest few meters of the Nonesuch Formation or extending up to 5 meters into the underlying redbed clastic sedimentary rocks of the Copper Harbor Conglomerate (Ensign et al., 1968; Brown, 1971). At the White Pine Mine and the Copperwood prospect, Cu emplacement is thought to have occurred by reduction of oxidized, Cu-bearing fluids upon flow into and through the dark gray shales and interaction with reduced C therein. Cu deposition by this mechanism would likely overlap spatially with
oxidation of OM in the Nonesuch Formation; such hydrothermally affected OM would plausibly show distinct organic geochemical alteration signatures. This mode of emplacement may also have imprinted distinct isotopic signatures in carbonates in the Nonesuch Formation.
Genetic models for this style of deposit will benefit from a clearer understanding of the
relationship of fluid flow to structural features (e.g.: the Keweenaw Fault, basement topography). Future Cu extraction could be streamlined by better constraints on zones of greatest Cu
concentration. Future exploration for analogous deposits elsewhere in the region will benefit from this study’s determination if haloes of organic alteration of barren hostrocks adjacent to Cu
mineralization can serve as indicators of proximity to economic Cu deposits or of hydrothermal fluid conduits.
1.2 Objectives
Comparative analysis of RE pyrolitic and GC-MS parameters with organic petrography to ascertain the degree of syn-mineralization oxidation of organic matter (OM) in the Nonesuch Formation is the main objective of this study. Ideally this provides a means of delineating paleohydrothermal fluid conduits. Stable isotope data on C and O from carbonate laminites, concretions, and veins provide supporting data to identify the extent of hydrothermal
mobilization of Corg to neomineralized, Ccarb.
1.3 Study Area and Geologic History
1.3.1 Physiography and Genesis of the Midcontinent Rift System
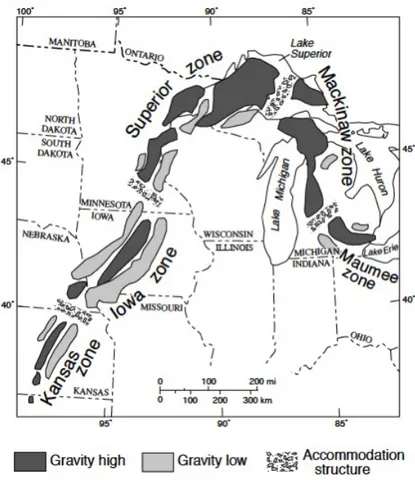
The samples in this survey come from a short segment on the southeast margin of the more than 2,000 km long, 40-90 km wide, Superior arm of the Mesoproterozoic Midcontinent rift system of North America (Figure 1). The rift cuts across Precambrian basement terranes of ages ranging from 1.85 Ga to older than 2.5 Ga (Bickford, 1988). Rift opening and abundant rift-filling volcanism likely occurred between 1109 and 1087 Ma (Davis and Sutcliff, 1985). Major magmatic activity in the rift was focused in two pulses -1109-1105 Ma and 1100-1094 Ma (Paces and Miller, 1993). Volcanic rocks dominated during active rifting and sedimentation dominated the post-rift subsidence phase, depositing what became the more than 30 km thick rift fill beneath today's Lake Superior (Behrendt et al., 1988). Twenty kilometers of mostly
subaerial volcanic rocks underlie a 5 km-thick mixed series of sedimentary and volcanic rocks; a further 7 km sedimentary rock sequence sits above the mixed unit (Ojakangas et al., 2001).
Figure 1: Location of the North American Midcontinent rift system, from Ojakangas et al. (2001). Samples in this study come from the red-highlighted lineament in the Superior arm of the rift.
Near to the end of rift extension, the Grenville Province to the southeast experienced tectonic compression (Cannon and Hinze, 1992). Grenville compression partially inverted the original graben-bounding normal faults into major reverse faults. This, and broad folding at 30-50 m.y. after extension ceased, suggest that tectonic stresses of the Grenville orogen
The nature and form of the Midcontinent rift are attributable to at least two different driving forces. Basinal void space formed first by rift extension and later, flexural crustal subsidence/sagging caused by rift-fill loading above low-viscosity mantle material (Nyquist and Wang, 1988). During rift extension a system of axial half-grabens developed, separated along the length of the rift by structural accommodation zones (Ojakangas et al., 2001). It is generally accepted that tectonic extension energized by a mantle plume caused initial rift opening and voluminous volcanism (Van Schmus, 1992; Cannon and Nicholson (1992). Basin filling
occurred both along the rift axis and in basins flanking a central, post-volcanic horst. See Figure 2. Paleomagnetic measurements and interpretation by Elmore and van der Voo (1982) and others suggest that rift filling occurred at low latitudes in a tropical to subtropical climate.
Figure 2: Schematic map of the gravitational trend of the Midcontinent rift system showing major tectonic zones. The geophysical trends seen here result from differences in the lithology of rift-fill rock sequences. From Ojakangas
et al. (2001).
The conditions that formed the Midcontinent rift provided some important elements for SSC deposit genesis, namely a thick pile of mafic rocks, a sufficiently steep geothermal gradient, and a low-latitude rift basin setting. Isotopic, petrochemical, and geophysical evidence support the presence of a hotspot in the genesis of the rift (Miller and Nicholson, 2013). The massive volume (1.3-2.0 x 10⁶ km3) of primitive, mafic rock extruded over a geologically short period and the comparatively moderate crustal extension of the rift would require the anomalous hot asthenosphere of a mantle plume (Cannon, 1992; Hutchinson et al., 1990).
1.3.2 Stratigraphy of the Midcontinent Rift System
Rift fill rocks, the Keweenawan Supergroup, are exposed only in the Lake Superior area, commonly in thick monoclinal columns that dip toward the rift axis beneath the lake. Reverse faults associated with Grenville compression repeat the section in some areas. Three major lithologic components are present: 1) a thick edifice of subaerial lava flows, 2) local
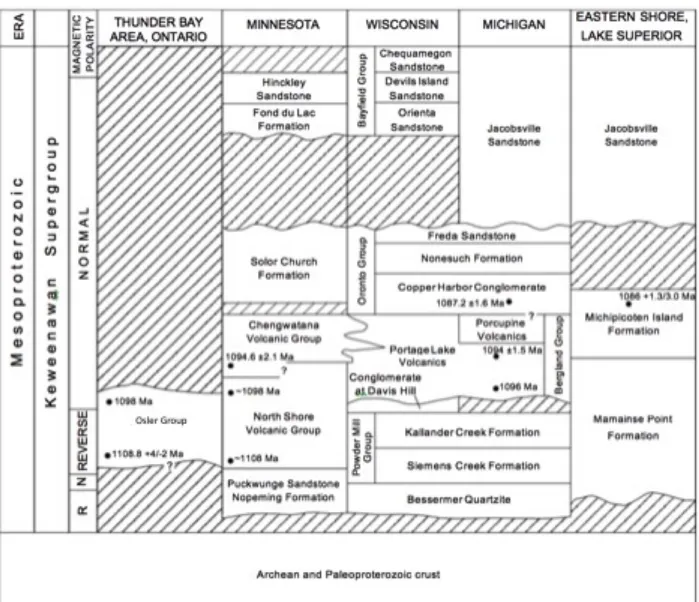
accumulations of plutonic to hypabyssal intrusive rocks, and 3) the upper sequence of post-extension, sag-period sedimentary rocks (Miller and Nicholson, 2013). The bulk of the Keweenawan Supergroup rocks are extrusives of the Bergland and Powder Mill Groups and consist of huge volumes of subaerial tholeiitic basalts with minor rhyolite. Early post-rift red-bed sedimentary rocks are mostly intrabasinally-derived material that was dominantly deposited in fluvial settings: this is the Oronto Group. Above the Oronto Group is the progressively more mature red-bed fluvial sediment of the Bayfield Group, of extra-basinal provenance (Ojakangas et al., 2001; Figure 3 and Figure 4).
Figure 3: The comparative stratigraphy of the full Keweenawan Supergroup in the Lake Superior region. From Ojakangas et al., 2001.
Figure 4: Stratigraphic column of the Midcontinent Rift, Upper Peninsula Michigan, showing SSC deposits of the Nonesuch and the native Cu deposits more intimately associated with mafic rocks. The detail shows Cu
concentration in layers of Nonesuch Formation at White Pine. Notice the “fringe zone” slightly cutting across stratigraphic horizons. From Schmidt and Rogers, 2007.
1.3.2.1 Bergland Group
The Portage Lake Volcanics are the base of the Bergland Group in northern Wisconsin and Upper Michigan. These are dominantly olivine-rich flood basalts, 3-5 km thick in the Keweenaw Peninsula, with minor interlayered felsic volcanic and sedimentary units (Davis and Paces, 1990). The Bergland Group bears about 1% rhyolite in the deep central grabens of the Midcontinent rift. Rift flanking zones, like those preserved as the Porcupine Volcanics and the North Shore Volcanic Group, show as much as 10-25% rhyolite (Cannon and Nicholson, 1992). Indeed, the Porcupine Volcanics, intersected by the sampling traverse of this study, are a
1.3.2.2 Oronto Group
The transgressive-regressive sequence of the Oronto Group was deposited in three units atop the Bergland Group Volcanics as extrusive volcanism diminished (Elmore et al., 1989). The Copper Harbor Formation, up to 2 km thick, shows intermittent, upward-decreasing, basalt flows of the Lakeshore Traps in its lower 1,000 m. Clast-supported conglomerate composes the lower part of the Copper Harbor Formation; clasts are dominantly volcanic, mainly sourced from Bergland Group rocks. The upper part of the Copper Harbor Formation is largely volcanic-derived sandstone with minor siltstone. This fining-upward and fining-basinward sequence records a prograding alluvial fan complex (Ojakangas et al., 2001). Pauses in Copper Harbor Formation sedimentation are evidenced by the presence of rare stromatolitic beds, sometimes associated with calcite pseudomorphs after gypsum, as well as carbonate-filled syneresis or mud-desiccation shrinkage cracks (Elmore, 1984). Evaporite mineral pseudomorphs, the red color of the unit and shrinkage cracks may be interpreted as recording deposition in an arid or semi-arid environment. Formation water encountered in the Copper Harbor conglomeratic sandstones at White Pine Mine is an alkaline brine with a chloride and TDS content approximately twice that of seawater, a condition which partly satisfies the requisite Cu solubility for economic SSC deposition (Johnson, 2014, Ridley, 2013).
Red conglomeratic sandstone and dark-gray siltstone to shale are interbedded and interlaminated in the lowest 6 m of the Nonesuch Formation and the basal contact (atop the Copper Harbor Formation) is arbitrarily placed at the base of the lowest 1 m thick unit containing dark-gray siltstone and shale (cf. White, 1971). The Nonesuch Formation is a mostly
fine-grained sequence of gray to black shale and siltstone with minor light gray sandstone. Cu-ore and petroleum seeps are found in the lowest 10 m of the Nonesuch Formation at the White Pine Mine (Ojakangas et al., 2001). The lower portion of the Nonesuch Formation shows textures
suggesting sedimentation of mud and silt from suspension in a low-energy, standing-water, depositional setting. A transition from quiet-water to an increasingly fluvial-influenced
depositional system is inferred from coarsening-upward sequences observed in the upper portion of the Nonesuch Formation (Imbus, 1988).
The fine-grained, often carbonaceous, sediment of the Nonesuch Formation and its association with continental red-bed alluvial fan and fluvial deposits, suggest a lacustrine
environment of deposition. Sedimentary structures observed by the author (Figure 5, cf. Suszek, 1997) recent Os isotope data (Cumming, 2012), rare but partially preserved anhydrite/gypsum nodules, and paleogeographic reconstructions suggesting that the nearest coastline was 800 km distant, further support lacustrine, non-marine, deposition (Ojakangas et al., 2001; Elmore et al., 1989). However, marine embayment/estuarine environment of Nonesuch Formation deposition have also been suggested. Evidence for marine deposition includes: 1) the presence of organic molecular fossils similar to those found in Phanerozoic oils of marine origin (Pratt et al., 1991), 2) high total S content, S/C ratio and S isotope dispersion that is characteristic of syngenetic sulfides formed by reduction of seawater sulfate (Burnie et al., 1972; Hieshima and Pratt, 1991), and 3) an intimate association of framboidal pyrite to OM in the Nonesuch Formation.
Figure 5: Straight to semi-arcuate infilled cracks 15 m stratigraphically above Nonesuch Formation base, Presque Isle River. Rock hammer head at right for scale.
The Freda Formation, up to 3600 m thick, shows stacked cyclic sequence packages of red-brown sandstone, siltstone, mudstone, and shale. Freda Formation depositional sequences are both fining-upward and coarsening-upward. The environment of deposition was a braided
stream network; this system interfingers with, and ultimately overlaps the top of the Nonesuch Formation (Daniels, 1982).
1.3.3 Climate
The samples in this study come from a present-day continental to semi-maritime climate. Lake Superior's proximity moderates air temperatures in the sample area and prevailing northerly winds provide for cold winters, cool summers, and regularly high humidity throughout the year (U.S. E.P.A., 1992). The mean annual temperature for the area is 40° F, with summertime highs in the low 80's and wintertime lows near 0° F, according to the National Oceanic and
Atmospheric Administration. Annual precipitation by rainfall is 80 cm, and yearly snowfall regularly totals 450 cm (Michigan State University, 1998).
1.4 The Nonesuch Formation Sediment Hosted Stratiform Copper Deposits
At White Pine Mine the Cu-bearing beds are mainly in the lower 7 m of the Nonesuch Formation. There, local usage describes four stratigraphic units, which are, in ascending order, the lower sandstone (the upper most Copper Harbor Formation conglomeratic sandstone bed), the parting shale, the upper sandstone, and the upper shale (White and Wright, 1955). The extent of individual Cu-bearing beds at White Pine is measurable in square miles (White and Wright, 1955). At White Pine Cu is present mainly in the upper and parting shales where mining nomenclature provides 12 distinct lithostratigraphic units through which five laterally extensive foci of greatest Cu enrichment (up to 3% Cu by weight) are recognized. An informal naming scheme has been developed for the lowermost Nonesuch Formation’s beds, to aid miners in distinguishing the ore zones (Figure 6, from White and Wright, 1955). Overall stratigraphy at White Pine Mine and the Copperwood deposit are depicted in Figures 7 and 8.
Figure 6: Mining nomenclature and typical thicknesses, ore grades of beds in the area of the White Pine Mine. From White and Wright, 1955.
Sediment hosted stratiform Cu deposits worldwide rank second only to porphyry Cu deposits in terms of Cu production (Robb, 2003). The Cu deposits of the Nonesuch Formation show many of the characteristic features of this deposit type. Recent economic Cu-focused studies of the Nonesuch Formation include those by Bornhorst and Williams (2013) Johnson (2014) and Sirois (2015). The thin but laterally extensive White Pine main stage cupriferous zone, localized in reduced carbonaceous horizons near to the boundary between reduced and oxidized sedimentary facies shows many hallmarks of the deposit type, especially the association with continental redbeds and evaporites (Brown and Chartrand, 1983). Total organic content (TOC) is generally less than 0.3% for the Nonesuch Formation in northern Michigan and Wisconsin, but select finely laminated calcareous and non-calcareous silty shales show TOC ranging from 0.25 to 2.8%, with an average of 0.6% (Imbus et al., 1988; Hieshima et al., 1989).
The lowest 15 m of the White Pine Nonesuch Formation can be divided into packages that display chemical and petrographic evidence of penetration by ascending fluids (Sutton et al., 2013). Copper mineralization as sulfides is mainly restricted to the lowest 5 m, sometimes with modest enrichment of Ag, V, and Zn (Sutton et al., 2013). This basal zone has the greatest abundance of vertical fracture fillings and vertically breached shale laminae (Sutton et al., 2013). The next 5 m package is low in S, trace metals and Cu, although native Cu does occur. Greater S concentration, with modest increases in Cu, As, Cd, Mo, Pb, Sb, characterizes the third 5 m package (Sutton et al., 2013). Content of Corg varies according to the 5 m packages above; TOC
is below 0.5% in the lowest 5 m package, below 0.2% in the second package and rises gradually above (Sutton et al., 2013).
Three structural domains recording three deformation episodes and two stages of Cu mineralization are recognized at the White Pine Mine. Mauk et al. (1989) describe: 1)
synsedimentary extensional growth faults; 2) a set of NE-SW trending high angle normal faults crosscutting (post-dating) main-stage mineralization, and; 3) S-dipping thrust faults
accompanying second stage Cu mineralization. The first Cu mineralization stage is the early diagenetic SSC event, the "main stage" of White Pine ore emplacement (e.g. White and Wright, 1955). The distinct second stage Cu mineralization accompanied thrusting and introduced mainly native Cu focused in calcite-rich veins, especially in the southwestern portion of the mine (Ruiz et al., 1984). Ho and Mauk (1996) instead reported second-stage mineralization as
dominantly chalcocitic, concluding that it resulted from reduction of sulfate introduced as a component of the mineralizing fluids.
Similar to other SSCs, ore is found mainly as very fine-grained disseminated Cu sulfides (White and Wright, 1966). Native Cu, silver and silver sulfides (e.g. acanthite) are also
important ore minerals (Johnson, 2014). As at other deposits of this type, White Pine and Copperwood sulfide minerals (and metals) show lateral and vertical zonation, although the Nonesuch Formation deposit ores are dominantly chalcocitic (Brown, 1978). The general main stage sulfide zonation is: barren (no sulfide, often with hematite) => native Cu => chalcocite => bornite => chalcopyrite => galena => sphalerite => greenockite => pyrite (Brown, 1978). This zonation progresses upward through the Nonesuch Formation as well as inward from the paleo-margin of the basin (Brown, 1978).
The geometry and textural relations of sulfide minerals of the transition between the cupriferous and pyritic zones (the fringe surface) are important to genetic explanation (Seasor and Brown, 1989). The top of the cupriferous zone is independent of lateral facies changes and transgresses bedding (Brown, 1971). Significantly, the fringe surface is stratigraphically lower where greater amounts of introduced Cu were precipitated in the basal Nonesuch Formation beds
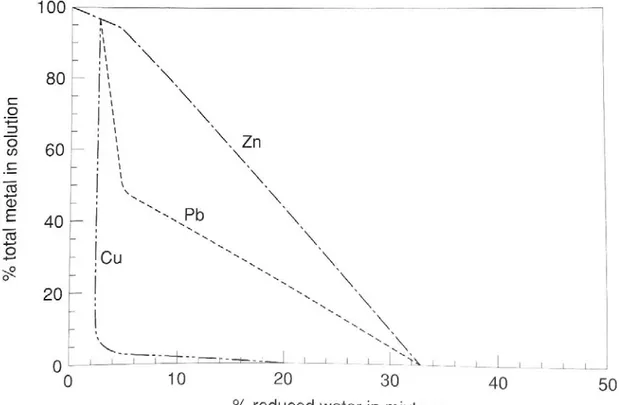
(Misra, 2000). Sulfide minerals at the fringe show textures interpreted to reflect a systematic step-by-step replacement of fine-grained diagenetic pyrite by chalcopyrite, bornite, digenite, and, finally, chalcocite (White, 1960). Most workers now accept a post-sedimentary, syndiagenetic ore emplacement model (Robb, 2003). Ore fluids are thought to have evolved by interaction with Cu-substituted minerals (e.g., hematite, magnetite, biotite, hornblende and pyroxene) in the clastic, oxidized sedimentary sequence of the Copper Harbor Formation (Brown, 2009). These fluids are likely to have been characterized by low temperatures (under 130°C), a near-neutral pH (6-7.5), moderate salinity (up to 20 wt% NaCl equivalent), and oxidized conditions (Robb, 2003). Such conditions, would favor Cu transport as cuprous chloride complexes with aqueous S species as dominantly sulfate ions (Rose, 1976). See Figures 9 and 10. Ore fluids encountering the reducing environment of the Nonesuch Formation then precipitated metals by three
mechanisms: 1) deposition of native Cu; 2) conversion of precursor pyrite to chalcocite, and; 3) deposition of chalcocite with Cu and S derived entirely from the fluid phase (likely by
thermochemical sulfate reduction; Ho and Mauk, 1996). These mechanisms explain ore mineral replacement textures, geometry and relation of the fringe surface to ore concentrations, and vertical mineral zoning with the most soluble sulfide minerals (galena, sphalerite, greenockite) farthest along the path of the upward circulating fluids (Brown, 1978; Seasor and Brown, 1989). All three mechanisms require a reducing agent external to the ascending ore fluid.
Figure 9: Pourbaix (Eh-pH) plot for the system Cu-O-H-S-Cl at 25°C (with ΣS = 10-4 m and Cl- = 0.5 m). Illustrated fields show the range of stability for hematite, various S species and the cuprous-chloride complex for conditions most likely compatible with the formation of SSC deposits (Robb, 2003). The brine ascending through the Copper Harbor Formation is thought to have had Eh-pH conditions in the zone of stability for cuprous chloride complexes (at center, CuCl32-). Copper became unstable in solution after mixing of brine with reductive fluids in the lower
Figure 10: Model showing the effects of mixing a typical SSC-type ore fluid with a reduced fluid on metal
precipitation. The sequence of deposition is the same as the zonation of metals observed in at White Pine and in the Kupferschiefer (Robb, 2003).
Ho and Mauk (1996) used differences in S isotope signatures to conclude that S enrichment in the Nonesuch Formation might have occurred by hydrothermal activity. If chalcocite formation occurred by reduction of sulfate in the ore fluids, this would result in net S addition to the sediments as well as increased S to C ratios in mineralized versus unmineralized samples (Ho and Mauk, 1996). Indeed, molar S/C ratios show trends associated with Cu deposition in the lower Nonesuch Formation at White Pine, especially in areas affected by second-stage mineralization (Mauk and Hieshima, 1992).
1.5 Organic Geochemical Background
Organic matter (OM) refers to material formed by living organisms and containing C-C bonds. Given suitable conditions, OM accumulates and is preserved in the rock record;
durations of burial and heating. Bitumen (organic matter soluble in organic solvents), kerogen (the organic-insoluble portion of OM in sedimentary rocks), pyrobitumen (infusible and insoluble bitumen), and petroleum form by burial, diagenesis and catagenesis of primary OM. See Figures 11 through 15. Tissot and Welte (1976), Hunt (1995), among others, cover these processes in detail.
Figure 11: Schematic structural characteristics of Type II kerogen: a) at the end of diagenesis (atomic H/C = 1.25, O/C = 0.09); and b) at the end of catagenesis (H/C = 0.73, O/C = 0.03). Kerogen and bitumen each increase in aromaticity with increasing thermal maturity, especially above artificial levels Ro greater than 0.9% (Craddock et al.,
Figure 12: Maturation trends by Rock-Eval pyrolysis are generally predictable: increasing maturity coincides with increasing S1 and Tmax but decreasing S2 values. From Tissot and Welte, 1984.
Figure 13: Schematic HC formation as function of source rock burial. The evolution of the HC composition is shown in insets for three structural types. Depths are illustrative only and correspond to an average for Mesozoic and Paleozoic rocks. Other actors exerting significant influence include: kerogen type, burial history, and geothermal gradient. From Taylor et al., 1998.
Figure 14: Gas chromatograms of saturated HCs from an immature extract of coaly organic matter (top) and from an oil believed to have been sourced from a similar facies (bottom). Both show many of the same characteristics - high wax content, odd Cn preference in the wax range, high pristane/phytane ratio - but maturity effects have altered
Figure 15: Gas chromatograms of two oils from Wyoming. Both were sourced from the Permian Phosphoria Formation but are hosted in different strata. The bimodal distribution of n-alkanes in the top oil is consistent with a lower thermal maturity than that of the unimodal n-alkane distribution of the oil at the bottom. (Waples and Curiale, 1999).
1.5.1 Kerogen Classification
The nature of precursor OM determines the kerogen type produced in early diagenesis. See Figure 16. Kerogen is typified by ratios of contained Corg, H, and O, commonly on van
Krevelen diagrams, as in Figure 17. Organic petrologists refer to distinctive kerogen types, which they subdivide based on their chemical composition, inferred origins and appearance (Tissot and Welte, 1984). See Table 1.
Figure 16: The nature of the primary organic matter determines the kerogen type formed during diagenesis. From McCarthy et al., 2011.
Figure 17: Kerogen types and maturation paths, defined by atomic H/C and O/C ratios (van Krevelen diagram) and also by hydrogen and oxygen indices (Modified van Krevelen diagram). Potter et al., 2005.
Table 1: Types of kerogen, as classified by van Krevelen diagram, with respective matter source/nature. Potter et
al., 2005.
The distribution of components in parent kerogens influences the HCs generated at the peak of oil formation; see Figure 18. Type I kerogens consist mainly of algal and amorphous kerogen, and are prone to oil generation. Type II kerogens are derived from mixed terrestrial and marine material; waxy oil is the dominant economic product of Type II kerogen maturation. Woody, terrestrial material most prone to gas generation upon maturation comprises Type III kerogen. Type IV kerogen is derived from residual organic matter found in sediments that have been reworked after erosion. Type IV kerogen may have experienced alteration by subaerial weathering, combustion or biologic oxidation prior to ultimate burial and is considered dead or inert C due to its relatively H-poor chemistry; there is no potential to generate HCs in these inertinites (Hunt, 1995). Kerogens of the first three types are indistinguishable from Type IV inertinites at very high maturities using only Rock-Eval pyrolysis (Tissot and Welte, 1984).
Figure 18: Distribution of HCs generated from samples representing different kerogen types at the peak of oil formation. Areas are proportional to amount of HCs per unit mass of Corg. From Killops and Killops, 2005.
The biota from which kerogen is derived are constructed from a relatively few simple molecular components that are mostly unchanged over geologic time (Hunt, 1995).
Carbohydrates, proteins, lipids, resins, pigments, and other classes of organic building blocks are the structures of life and metabolic systems. Flora and fauna contain differing proportions of the major constituents that produce unique chemical signatures - biochemical fossils or biomarkers. Together, these factors lead to production of different, distinct kerogen types and a broad array
of biochemical fossils. These biomarkers can be isolated from whole rocks (as bituminous extracts and kerogen pyrolyzates) and also from crude oils. Bituminous extracts (rock extracts) are obtained by organic solvent extraction of 5 grams of sample pulp (finely ground rock) placed in a cellulose thimble and extracted with dichloromethane using Soxhlet apparatus (Bjorlykke, 2013). The ratios and distributions of such biomarkers (and, to some extent, those of HCs generally) are utilized to interpret the provenance, the depositional and thermal history of
preserved OM (cf. Peters et al., 2005; Engel and Macko, 1987; Killops and Killops, 2005). This is depicted in Figure 19.
Figure 19: Approximate correlation of various maturity parameters with stages of petroleum generation. Killops and Killops, 2005.
1.6 Organic Geochemistry with Specific Reference to Precambrian Organic Matter
Organic matter preserved in Precambrian rocks is unique in that it has persisted despite its vast period of existence in crustal rocks vulnerable to tectonic recycling and significant stresses related to high pressures and temperatures. Such ancient OM is also unique in that it was generated in differing biotic and ecosystemic regimes, leading to distinct chemical differences from more recently generated OM.
The mean TOCs of Precambrian sedimentary rocks are lower than those of comparable Phanerozoic lithofacies, probably reflecting lower primary productivity/biomass generation, as well as metagenetic C loss and erosion of many representative Precambrian environments (Engel and Macko, 1993). The UCLA Precambrian Paleobiology Group showed 67% of their 315 samples as below 0.5% TOC, 17% of their samples as between 0.5 and 1.0% TOC, 14% of their samples with TOC between 1 and 5% TOC, and 2% of samples with TOC greater than 5% (Hayes et al., 1983). Reimer et al. (1979) reported Early Archean sediments of the South African Swaziland Sequence with an average of 0.43% TOC. This is similar to the mean TOC finding of 0.38% by Imbus et al. (1988) for the Nonesuch Formation. Precambrian kerogens display as much chemical variability as kerogens in the Phanerozoic record (McKirdy and Hahn, 1982).
Precambrian Type I kerogen, H-rich, presents petrologically as thin films of lamellar alginite and also as discrete ellipsoid or disc-shaped algal bodies (McKirdy and Kanstler, 1980). Type I organic morphologies are derived from bloom or mat-forming cyanobacteria, partially reworked by anaerobic bacteria, thus incorporating lipid-rich bacterial cells (McKirdy et al., 1980). The inferred depositional environments for this material are: 1) evaporitic, alkaline playa-lacustrine facies similar to those of the Observatory Hill Beds, Officer Basin, S. Australia (atomic H/C = 1.19-1.37 with atomic O/C = 0.05-0.1), and 2) marine phosphorites of the
Ordovician Beetle Creek Formation, Georgina Basin, Queensland, Australia (atomic H/C = 1.13 with O/C = 0.05-0.1), and the similar Lesser Karatau deposit, Former USSR (atomic H/C = 0.53), and the Areyonga Formation, Amadeus Basin, N. Territory, Australia (atomic H/C = 0.53 and O/C = 0.05-0.2; Powell et al., 1975). The latter two lower H/C values reflect their higher degree of thermal alteration due to deeper burial (McKirdy and Hahn, 1982). Precambrian Type I kerogen generally presents a pyrolysis-hydrogenation-gas chromatography (PH-GC) pyrogram in which n-alkanes up to C25 or higher are dominant; simple aromatics (benzene, toluene, etc.)
occur in very low concentrations relative to aliphatic moieties of equivalent Cn, though this is
dependent upon kerogen rank (McKirdy and Hahn, 1982). Likely precursors of this highly aliphatic OM include lipid-rich planktonic chlorophytes, or bacterial/microbial mats (McKirdy et al., 1980).
Precambrian Type II kerogen, such as that of the 1.45 Ga McMinn Formation, McArthur Basin, N. Territory, Australia occupy an intermediate position on a van Krevelen plot (H/C = 0.5-0.9 and O/C = 0.07-0.2, at low levels of maturity/oxidation; Peat et al., 1978). This material can be a mixture of Type I and III kerogens, but has also been described as a derivative of acritarchs, bacterial lipids, or amorphous sapropelized algal/protozoan remains (McKirdy and Hahn, 1982). It may be in some part a derivative of sporopollenin, a chemically resistant
biopolymer in the cell walls of certain algae (Brooks and Shaw, 1972). It presents petrologically mainly as lamalginite although some reports indicate the presence of amorphous algal or
protozoan remains and some acritarchs (Engel and Macko, 1993). This material differs little in PH-GC pyrograms from Precambrian Type I OM but it is significantly more naphthenic. The maturation of such Precambrian Type II OM occurs by progressive shortening of aliphatic chains and a loss of alkyl groups, as well as generally increasing aromatization of alicyclic rings
(McKirdy and Hahn, 1982). Such Precambrian Type II OM has been isolated from bituminous shales and carbonates of the 0.8 Ga Bitter Springs Formation, Amadeus Basin, Australia (atomic H/C = 0.80-0.85) and from several units within the 1.6-1.7 Ga McArthur Group, McArthur Basin, Australia (atomic H/C = 0.75-0.92; Saxby, 1976). Among the Precambrian sequences known to contain kerogens that have not matured well past the peak oil window (Rock-Eval Tmax
below 450°C) are a number of units generally of a similar composition (H/C = 0.70-1.66 and HI = 150-740; Engel and Macko, 1993). This group contains kerogen of Type I and Type II.
Oxygen-rich, H-poor kerogen (Type III or Type IV) is preserved in very low
concentrations in certain Proterozoic and also Paleozoic stromatolitic carbonates and cherts (atomic H/C 0.5-0.8 with O/C = 0.05-0.4, and atomic H/C = 0.4-0.6 with O/C = 0.1-0.4, respectively) presuming minimal maturation/oxidation (McKirdy, 1976). Such kerogen of this age is likely derived from cyanobacterial mucillage and from algal and bacterial pectic tissue (McKirdy et al., 1980). Type IV kerogen presumably underwent partial oxidation during early diagenesis (McKirdy and Hahn, 1982). The saturated portion of these and other humic
Precambrian kerogens often shows an odd Cn preference in the C10+ range, possibly reflecting
derivation from bacterial cell-wall lipids (McKirdy et al., 1980). A distinct group of Precambrian Type II/III (H/C = 0.90-1.17 and HI = 100-484) kerogens have been reported (Engel and Macko, 1993). Significantly, at least one member of this latter group is thought to have undergone bacterial degradation (sapropelization) of the primary algal biota, and possibly partial oxidation prior to compaction and lithification, which may explain the trend towards Type III kerogen (Crick et al., 1988). See Table 3.
Table 3: Origins, chemical characteristics, typical associated depositional environments, and Cambrian and Precambrian examples of kerogen. Engel and Macko, 1993.
The saturate fraction of typical Precambrian extracted OM generally presents a classic "marine signature;" that is, a prevalence of C12 to C20 n-alkanes, often with predominantly odd
over even Cn homologs in the vicinity of n-C15 and n-C17 (Tissot and Welte, 1984). This
n-alkane signature is thought to result from the decarboxylation of the corresponding normal fatty acids (especially n-C16 and n-C18 homologs) which are important lipid constituents of planktonic
and benthic organisms (Engel and Macko, 1993).
Branched alkane species increase in abundance in oils with increasing geologic age (Hoering, 1981). Both iso- and anteiso-alkanes (2- and 3-methyl-substituted, respectively) are common components of most Precambrian oils and extracts (Engel and Macko, 1993).
Monomethyl alkanes such as the 4-, 5-, and 6-methyl-substituted alkanes and the midchain methyl-substituted isomers - so-called "X compounds," first reported in Omani oils by Klomp (1980) - are found in unusual abundances in Precambrian oils and extracts. These singly branched alkanes, among the most distinctive compounds found in Precambrian-sourced hydrocarbons, and are widely believed to form by rearrangements and cracking of C skeletons during long periods of kerogen maturation (Engel and Macko, 1993). Summons et al. (1988) posited a bacterial origin to the midchain methyl-substituted alkanes found exclusively in Precambrian and Early Paleozoic oils and extracts, whereas later workers ascribe them to cyanobacterial input (George et al., 2008).
A broad selection of isoprenoid HCs have been reported from Precambrian oils and extracts. The C12 to C20 regular (head-to-tail linked) isoprenoid alkanes are the most commonly
reported isoprenoid compounds (Engel and Macko, 1993).
Steranes (tetracyclic compounds derived from steroids and sterols via diagenetic and catagenetic degradation and saturation) in Precambrian oils and sediments provide definitive
evidence of eukaryotic inputs to their precursor OM, and to their thermal maturity. The presence of steranes in the 1.7 Ga Barney Creek Formation of the McArthur Basin provides evidence for the presence of eukaryotes which is significantly earlier than the age of well-established fossil evidence for these organisms (1.4 Ga; Summons and Walter, 1990). Sterane distributions and ratios may be used to infer maturity levels of Precambrian rocks, despite their lesser abundance in Neoproterozoic as compared to Mesozoic rocks. Hopanes associated with bacterial inputs are generally abundant in Precambrian rocks as compared to their occurrence in younger strata (Ourisson and Rohmer, 1992).
2. Studies of Relations Between Organic Matter and Metal Ore
The general view that OM plays a role in some forms of ore mineralization is evidenced by occurrence of OM in sedimentary rocks in association with metallic ores at, for example, the Pb, Zn and Ag deposits of the McArthur Basin of Australia (Logan et al., 2001; Summons et al., 1988), Cu deposits of the European Kupferschiefer (Püttman et al., 1989) and SSC deposits of northern Michigan, USA (Ho et al., 1990; Ho and Mauk, 1996). Additional accounts of organics-ore association include those of U (e.g., Gize, 2000), Au (e.g., Fairmaid et al., 2011; Ilchik et al., 1986), Hg (e.g., Lavric et al., 2003; Gize, 2000), and in particular the large deposits of Mississippi Valley Type Pb-Zn deposits (e.g., Disnar and Sureau, 1990).
Organic geochemistry has been applied to OM-associated mineral deposits to identify HC biomarkers of major organic precursors and molecular alterations indicative of important Earth processes such as thermal maturity and biodegradation (e.g., Logan et al., 2001; Rieger et al., 2008). Some workers have reported correlation of trends between biomarker/abiotic HC
parameters and metal enrichments (Hulen and Collister, 1999; Spangenberg and Macko, 1998). With analytical advances it is now possible to use organic geochemical parameters to search for thermal anomalies associated with hydrothermal ore deposits and to map conduits of ore-emplacing paleofluids (Ilchik et al., 1986). Significantly, the organic parameters inferred to represent hydrothermalism may occupy larger areas than the orebodies themselves, potentially offering a means of exploration. Still, few would confidently claim to totally understand the relevance of organics to the mineralization process, although the review by Greenwood et al. (2013) highlights promising insightful outcomes from several well-studied OM-ore associations. See also the 2000 edition of Reviews in Economic Geology on Ore Genesis and Exploration, v. 3: The roles of organic matter (eds. T.H. Giordano et al).
2.1 Kupferschiefer Stratiform Copper
The Upper Permian cupriferous shale, or Kupferschiefer, of northern Europe shares many geologic and interpreted genetic features with the Nonesuch Formation SSCs (Ridley, 2013). The stratigraphic term Kupferschiefer describes a thin (less than 4 m) bed of marine bituminous marl occupying an estimated 600,000 km2 extent, from Poland in the east across Germany and the North Sea to northeast England, where it is called the Marl Slate and lacks reported economic Cu concentrations (Vaughan et al., 1989). It has been exploited for Ag, Cu, and other base metals since the Middle Ages and is regarded as the type example of a shale-hosted, strata-bound, disseminated sulfide deposit (Speczik et al., 1986). The term Rote Fäule was first used by miners to describe barren, red-colored rocks found in the vicinity of the ore. It is applied to rocks of the Weisseliegende (white sandstone), Kupferschiefer, and Zechsteinkalk layers which exhibit various types of red coloration caused by disseminated hematite and goethite (Vaughan et al., 1989). Some workers early on interpreted the Rote Fäule to represent a shallow-water
equivalent of the black, Cu-bearing shales but a diagenetic origin is suggested and widely accepted based on the presence of hematite pseudomorphs after syngenetic pyrite (Jowett et al., 1987).
Organic C content generally decreases from bottom to top in the Kupferschiefer, which reflects decreasing preservation with increasing oxygenation of the Zechstein Sea (Püttman et al., 1989). However, the lowest TOC values are found in the bottom-most samples of the basal, most-altered Rote Faule (Bechtel et al., 2000). The change from black shale to red shale (Rote Fäule) across Cu ores in the Kupferschiefer is interpreted to be a result of near complete
epigenetic oxidation and dissolution of indigenous OM during flow of Cu-bearing fluids on the up-flow margins of the ores (Speczik and Püttman, 1987).
2.1.1 Organic Geochemical Studies of the Kupferschiefer
The Kupferschiefer has been a topic of OM-ore study since the middle 1980s. Kotarba et al. (2006) applied RE, GC/GC-MS, and compound class-specific SI methods to examine thermal maturity and source rock prospectivity of the Permian Kupferschiefer, building upon a
significant body of organic geochemical studies of Cu ore-organic relations in the region. Overall Kupferschiefer mineralized and highly oxidized ore-adjacent areas) show: 1) kerogens depleted in H equivalents (low HI; Sun and Püttman, 2001); 2) a dominance of aromatic compounds in EOM, especially PAHs; 3) lower MPI1 (demethylation) and lower MDR; 4) saturated HCs depleted in n-alkanes of intermediate to high molecular weight; and, 5) a higher degree of OM degradation indicated by increasing phenanthrene/methylphenanthrene ratio (demethylation), than do barren, least-altered samples (Bechtel et al., 2000). Barren
samples do however show increasing maturity with depth as reflected by generally decreasing HI and increasing Tmax values, diminished EOM yields and correlation of MPI1 and depth in
agreement with the relation of MPI1 to organic maturity (Bechtel et al., 2000).
The Bechtel et al. (2000) study is most closely analogous to this study, in terms of
deposit type, analytical tools and end goals, although Sun and Püttman (2001) replicated some of their findings. Sun (1998) showed that mineralized and barren Kupferschiefer samples are Type II and Type III kerogens on modified van Krevelen plots (cf. Bechtel et al., 2000). All barren Kupferschiefer samples fall within the area where Type II OM dominates, whereas the Rote Fäule and some of the mineralized samples do not (Bechtel, et al., 2000). Departures from the expected thermal evolution pathways for a given kerogen are seen in Figure 20 from Bechtel et al. (2000). Sun (1998) suggested that secondary oxidation of OM during mineralization altered Type II kerogen to the Type II-III mixture observed. Alternatively, this could reflect multiple OM source types, Ccarb interferences during pyrolysis of organic-lean, carbonate-rich samples.
Discrimination thereof necessitated kerogen typing by crossplots of HI versus Tmax, as in Figure
21. The mineralized Kupferschiefer samples show a slight negative correlation between HI and burial depth (Figure 22), with HI values significantly reduced at a given depth compared with the barren samples.
Figure 20: Modified van Krevelen diagram of Rock-Eval pyrolysis on Kupferschiefer SSC samples. Maturation pathways typical for the different kerogen types are indicated. Bechtel et al., 2000.
Figure 21: Relationship between HI and temperature of maximum pyrolysis yield (Tmax) for Kupferschiefer SSC
samples. Fields in the diagram are labeled according to the predominance of the respective kerogen type. Bechtel et
Figure 22: Correlation plot of HI versus downhole depths of the Kupferschiefer. Bechtel et al., 2000.
Organic matter from highly mineralized samples adjacent to Rote Fäule and especially from Rote Fäule samples show low HI and higher OI values than does the whole sample set of Bechtel et al. (2000; cf. Sun and Püttman, 2001). Bechtel et al. (2000) interpreted their similarly broad scatter of HI versus OI data points (Figure 20) to reflect OM degradation due to both burial-induced thermal maturation and oxidation associated with base metal mineralization.
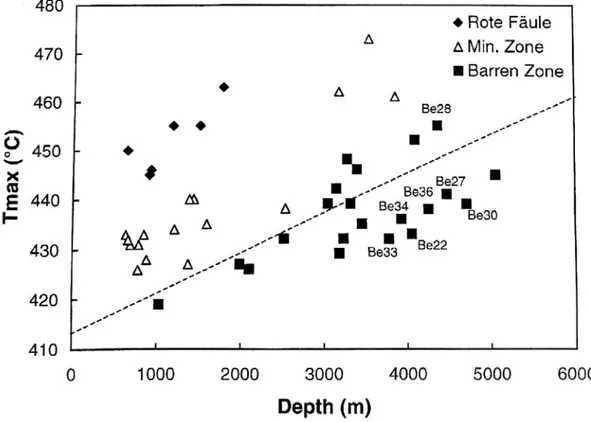
The vast majority of barren Kupferschiefer samples show relatively low Tmax values
(Figure 23). In comparison, mineralized and ore-proximal Kupferschiefer samples plot in different fields on the Tmax versus depth diagram. The Rote Fäule samples show highest Tmax
values (despite the present shallow burial depth of Kupferschiefer in the localities from which these samples were collected). In fact, the increasing Tmax values towards the Rote Faule are
characteristic of OM degradation by partial oxidation by ascending oxidizing brines in and just above the Rote Faule.
Figure 23: Correlation plot of Tmax versus downhole depths of the Kupferschiefer. Bechtel et al., 2000.
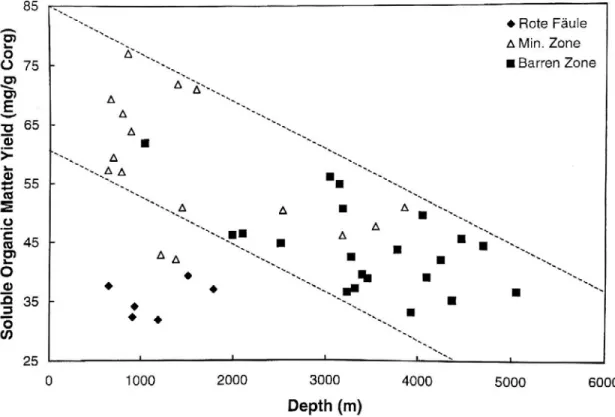
With decreasing distance to the Rote Fäule, the EOM yield decreased from 50-70 mg/g Corg to values between 25-35 mg/g Corg (Bechtel et al., 2000). See Figure 24. This trend
parallels a general increase in the aromatic portion of EOM from 20-38% in Pb-Zn mineralized samples (lacking Cu) up to 40-54% aromatics in the most-altered Rote Faule samples.
Increasing aromatic EOM yield accompanies a decrease in the proportion of saturated HC in EOM from Pb-Zn mineralized samples to Rote Fäule samples. Barren zone samples give greater yield of EOM and a wider range of values (33-61 mg/g Corg); the wider spread of values is in part
due to this subset's broader span of sample collection depths due to km-scale vertical structural offsets (Bechtel et al., 2000).
Figure 24: Plot of the Corg-normalized, C15+ soluble organic matter yield vs. downhole depths of the Kupferschiefer
(Bechtel et al., 2000).
Multiple studies of the Permian Kupferschiefer describe distinct differences in the saturate and aromatic fractions of extracted OM and of the vitrinite reflectance for ore-proximal versus ore-distal samples (Sun, 1998; Bechtel et al., 2000). This evidence for oxidative
alteration of OM in highly mineralized Kupferschiefer samples near the most-altered Rote Fäule zones coincides with correlations of RE and EOM yields versus the present sample depths. Aromatic compositions changed with decreasing distance to the most-altered and mineralized zones by increasing abundance of PAH (Bechtel, et al., 2000). This trend was posited by Sun and Püttman (2001) to result from dealkylation of oxy-alkylated aromatics to produce DBF, among other aromatics. Sun (1998) found that vitrinite reflectance increased with proximity to ore and Rote Fäule, coincident with increasing aromaticity. Proximity to mineralized and
most-thus, also to decreases in the MPI1 with proximity to ore, possibly by demethylation of methylphenanthrenes; Bechtel et al., 2000).
The aromatic portion's GC traces from Pb-Zn mineralized samples at greater distance to the Rote Fäule zone are successively dominated by phenanthrene, methyl-, dimethyl-, and trimethyl-phenanthrenes (Figure 25, Bechtel et al., 2000). Further aromatic constituents include biphenyl, DBF, and DBTs. The Cu-mineralized zone shows the same compounds, but with reduced intensities of the methylphenanthrene and increasing number of aromatic rings.
Increased aromaticity is defined by the appearance of PAHs including fluoranthrene, pyrene, and benzo(k)fluoranthrene (Figure 26). Rote Fäule samples show these PAHs and also
benzo(a)anthracene, triphenylene, and chrysene as the dominant aromatic compounds (Figure 27). Barren zone samples show PAHs at only minor intensities in comparison (Bechtel et al., 2000).
Figure 25: Gas chromatogram of the aromatic HC fraction from a Kupferschiefer sample representative of the Pb-Zn mineralized zone. B = biphenyl; DBF = dibenzofuran; DBT = dibenzothiophene; Ph = phenanthrene; MPh = methylphenanthrenes; DMPh = dimethylphenanthrenes; TMPh = trimethylphenanthrenes. Bechtel et al., 2000.
Figure 26: Gas chromatogram of the aromatic HC fraction from a Kupferschiefer sample representative of the Cu mineralized zone. DBF = dibenzofuran; DBT = dibenzothiophene; Ph = phenanthrene; MPh =
methylphenanthrenes; DMPh = dimethylphenanthrenes. Bechtel et al., 2000.
Figure 27: Gas chromatogram of the aromatic HC fraction from a Kupferschiefer sample representative of the Rote Faule zone. Ph = phenanthrene; MPh = methylphenanthrenes. Bechtel et al., 2000.
The methylphenanthrene index (MPI1) averaged 0.8 for Rote Fäule and mineralized samples, and ~0.96 for the barren, ore-distal samples; MPI1 values decrease towards the Rote Fäule, as shown in Figure 28 (Bechtel et al., 2000; cf. Sun, 1998). The observed MPI1 depression in highly mineralized samples is thought to result from H donation during thermochemical sulfate reduction by alkylated phenanthrenes.
Figure 28: Correlation plot of the methylphenanthrene index, sensu Radke, et al., 1982. From Bechtel et al., 2000.
The values of the methyldibenzothiopene ratio (MDR) increase continuously from 2.2 to 7.2 with increasing depth (Figure 29). For samples presently at less than 2000 m depth, there is a broad scatter of MDR values; this is thought to reflect varied degrees of OM degradation by oxic brines associated with Cu ore emplacement in the Kupferschiefer.
Figure 29: Correlation plot of the methyldibenzothiophene ratio (MDR of Radke et al., 1982) of the Kupferschiefer. From Bechtel et al., 2000.
The depletion of MPs relative to phenanthrene in EOM can be used to quantify the extent of OM alteration by the oxidizing hydrothermal brines (Püttman et al., 1989). Speczik (1994) tied increasing Cu grade to vitrinite reflectance as well as Ph/ΣMPh to plot a classic bell-curve by these three parameters from GC/GC-MS and VR data. Speczik (1994) showed that values for the Ph/ΣMPh provide a measure for the intensity of alteration. Unoxidized and weakly oxidized samples showed Ph/ΣMPh = 0.6-1.2, while oxidized samples give values between 1.5 and 3.0 (Speczik, 1994). Bechtel et al. (2000) showed averaged Ph/ΣMPh for Rote Fäule and
Rote Fäule, mineralized, and barren Kupferschiefer samples are apparent in the plot of HI versus Ph/ΣMPh, shown in Figure 30 from Bechtel et al. (2000).
Figure 30: Hydrogen index vs. the Ph/ΣMPh ratio of Kupferschiefer samples, from barren, mineralized, and Rote Faule zones. Bechtel et al., 2000.
Bechtel et al. (2000) showed that mineralized and ore-proximal rocks have higher abundances of pristane and phytane relative to heptadecane (n-C17) and octadecane (n-C18) than
do unmineralized ore-distal barren samples in the Kupferschiefer. Their values for ore-proximal and mineralized samples averaged 0.76 and 0.79, respectively, and ore-distal samples averaged 1.22 for pristane/n-C17 and 1.54 for phytane/n-C18 (Bechtel et al., 2000).
The isotopic composition of Corg and Ccarb showed changes corresponding to the
alteration patterns of OM elucidated by GC-MS and RE data (Bechtel et al., 2000).
Kupferschiefer kerogens as well as bitumens in and proximal to the most altered zone showed enrichment of 13C relative to ore-distal, unaltered samples as in Figure 31 (Bechtel et al., 2000;
Sun and Püttman, 2001). This can be explained by preferential release of isotopically light Corg
through progressive degradation of OM (Sun and Püttman, 2001). Conversely, Kupferschiefer calcites of Rote Fäule samples are depleted in 13C and 18O to the highest extent relative to barren samples, followed by calcite of the mineralized zone as shown by Figure 32 (Bechtel et al., 2000). This negative correlation suggests the generation of carbonate from isotopically light CO2 liberated by degradation of OM. Oxidative conversion of Corg into carbonates after
deposition of the sediment is the best explanation given the trends in C isotopic composition of OM and calcite (Bechtel et al., 2000).
Figure 31: Histogram of the δ13C values of the total Corg from the Kupferschiefer of the Polish Zechstein Basin.
Figure 32: δ13C vs. δ18O diagram of calcites from the Kupferschiefer of Poland. Bechtel et al., 2000.
The multiple independent lines of evidence corroborate and convince this observer of the veracity of the conclusion of Bechtel, et al. (2000): Within the Polish Cu deposits, the OM of the Kupferschiefer acted as a geochemical trap by its reducing potential, precipitating metal sulfides from ascending, oxidizing brines caused by decreasing Eh conditions.
2.2 Alligator Ridge Gold and Organic Alteration
Ilchik et al. (1986) quantified OM maturation by RE to map Au hydrothermal enrichment conduits. They showed that OI and HI values more accurately reflect Au, As and Sb
enrichments than did mineral alteration patterns observable in the field. Mineralized samples showed HI values ranging from 1 to 55, while the HI range for unmineralized samples was 10 to 76; deposit-distal background samples showed a similar HI range to those of unmineralized mine samples. Select pyrograms (Figure 33) representing each of the three classes of all samples show