Degree Thesis
15 högskolepoäng, grundnivå
The impact of UI design
on reseller behavior
Elias Andersson
Degree: Bachelor of Science, 180 hp Examiner: Thomas Pederson
Main area: Media Technology Mentor: Fredrik Rutz
Abstract
The study assesses the influence certain individual factors have on reseller employees online purchasing behavior, after various UI alterations were implemented on a leading tech manufacturer’s web application.
A total of 207 reseller employees, from 46 different countries, participated in an 8 week long within-subjects designed A/B test. By examining four different individual factors (age, gender, education/income and culture) and the participants usage analytics data, it was possible draw some pertinent conclusions as to how resellers are affected by UI alterations.
The results confirm what have been largely theoretical ideas of linkages between reseller employees individual factors and online purchasing behavior. Correlations on gender and culture exist, and these can be explained and supported by the quantitative data collected.
Keywords
Sammanfattning
Studien utvärderar det inflytande vissa individuella faktorer har på återförsäljaranställdas e-handelsbeteende, efter att olika användargränssnittsförändringar implementerats på en ledande tekniktillverkares webbapplikation.
Totalt 207 återförsäljaranställda, från 46 olika länder, deltog i ett 8 veckor långt within-subjects designat A/B-test. Genom att undersöka fyra olika individuella faktorer (ålder, kön,
utbildning/inkomst och kultur) och deltagarnas användningsanalysdata var det möjligt att dra några relevanta slutsatser om hur återförsäljare påverkas av UI-förändringar.
Resultaten bekräftar vad som till stor del har varit teoretiska idéer om kopplingar mellan
återförsäljaranställdas individuella faktorer och e-handelsbeteende. Kön- och kulturkorrelationer finns, och dessa kan förklaras och stödjas av de kvantitativa uppgifter som samlats in.
Nyckelord
Acknowledgement
This study is a thesis within the subject Media Technology at the Faculty of Technology and Society at Malmö University.
First and foremost I would like to thank the friends and relatives who supported me during this journey. Special thanks to my wife Anna Andersson and my two sons.
I am grateful for all the people who contributed to the research. Also, I want to thank the supervisor Fredrik Rutz for the guidance and for sharing valuable knowledge. Finally, thanks to Henriette Lucander for giving me the opportunity to finalize this thesis.
Gratitude! Elias Andersson
Word list
Transaction log (also referred to as search log) = Transaction log is a file (i.e., log) of the
communications (i.e., transactions) between a system and the users of that system.
Web application is a website but in the shape of an application that runs on the web, unlike
regular websites, they provide more functionalities and features and are made for interaction. Every day we use numerous web applications such as Gmail, Google Drive, Facebook, LinkedIn, Jira, Slack, etc.
Website is a page on the internet which is there to provide information and there is no or
minimal user interaction.
User Interface (UI) is the graphical layout of an application. It consists of the buttons users
click on, the text they read, the images, sliders, text entry fields, and all the rest of the items the user interacts with.
User Experience (UX) is the user’s experience of the app. It is determined by how they interact
with it. UI is one part of the UX. UI designers are tasked with deciding how the user interface will look while UX designers are in charge of determining how the user interface operates.
Routes-to-Market (RTM) is a simple but very powerful methodology for driving profitable
growth. Leading global companies use RTMs to take their products and services to market in the most productive way possible. RTMs provide a quick and proven methodology for aligning marketing, sales and distribution, and for optimizing spending in these areas.
Business-to-consumer (B2C) refers to the process of selling products and services directly
between a business and consumers, who are the end-users of its products or services.
Business-to-business (B2B) is a form of transaction between businesses, such as one involving
a manufacturer and wholesaler, or a wholesaler and a reseller. Business-to-business refers to business that is conducted between companies, rather than between a company and individual consumer.
Carry-over effects (also referred to as learning effects) within UI testing, is the result when a
person has completed a series of tasks on one website and gained more knowledge about the domain. Then when moving onto the second website, the person will be more efficient, thanks
to the knowledge from the first website, even though that second website might be very different.
Adjusted Wald Method exists to adjust the observed proportion of task successes to take into
account small sample sizes, commonly used in usability tests.
Confidence Interval is a range of values we are fairly sure our true value lies in.
Pageview is an instance of a page being loaded or reloaded.
Pageviews is a metric defined as the total number of pages viewed. Repeated views of a single
page are counted.
Unique pageview aggregates pageviews that are generated by the same user during the same
session. A unique pageview represents the number of sessions during which that page was viewed one or more times.
Sessions are the period of time a user is active on your site or app. By default, if a user is
inactive for 30 minutes or more, any future activity is attributed to a new session. Users that leave your site and return within 30 minutes are counted as part of the original session.
Pages/Session is the average number of pages viewed during a session. Repeated views of a
single page are counted.
Avg. Time on Page is the average amount of time visitors spent viewing a specified page or set
of pages.
Avg. Session Duration is the average length of a Session.
Demographics is the study of a population based on factors such as age, race, and sex.
Demographic data refers to socio-economic information expressed statistically, also including employment, education, income, marriage rates, birth and death rates and more factors.
Firmographics are the attributes B2B companies use to describe their target market in order to
discover their ideal consumers.
Psychographics is a qualitative methodology used to describe traits of humans on
Table of content
1 Introduction 1 1.1 Background 2 1.1.1 Context of study 3 1.2 Purpose 3 1.2.1 Research questions 3 1.3 Delimitations 3 1.4 Target audience 4 1.5 Disposition 4 2 Method 52.1 Scientific research method 5
2.1.1 Between-subjects design 6
2.1.2 Within-subjects design 6
2.2 Data analysis procedure 7
2.2.1 Conversion rates 8
2.2.2 Binary success 8
2.2.3 Confidence interval – Adjusted Wald Method 8
2.3 Validity and reliability 10
2.4 Ethics 10
2.5 Method discussion 11
3 Theoretical framework 12
3.1.1 High task-relevant changes 13
3.1.2 Low task-relevant changes 14
3.2 A/B tests 15
3.3 Data collection 16
3.3.1 User grouping 16
3.3.2 Type of data collected 17
3.3.3 Data enrichment 17
3.4 Influences from individual factors 17
3.4.1 Firmographics and psychographics 17
3.4.2 Age 18
3.4.3 Gender 19
3.4.4 Education and income 20
3.4.5 Culture 20
4 Result 24
4.1 Individual factors 25
4.1.1 Pageviews per session 26
4.1.2 Task completeness 27
4.2 Time spent on subpages 28
4.3 Task completeness 29
4.4 Searches 31
5 Discussion 32
5.1.1 Navigation enhancement 32
5.1.2 Gender influences 33
5.2 Justifiable results 33
5.2.1 Task completeness increase 34
5.2.2 Cultural influences 34
5.3 Reseller, but yet a consumer 35
6 Conclusion 36
6.1 Future work 36
1
1
Introduction
E-commerce exists today thanks to the development of electronic data interchange (EDI), the exchange of documents from one computer to another (Tian & Stewart, 2007). EDI was invented in the mid-1960s, when some retail and transportation companies were attempting to create “paperless” offices (Tian & Stewart, 2007). A few years later EDI came to allow companies to place orders and conduct electronic funds transfer through computers (Tian & Stewart, 2007). Right around the same time Web analytics started to emerge. Web analytics (including transaction log analysis) is an approach to data collection and research methodology, respectively, for both system performance and user behavior analysis. This method has been used since 1967 (Jansen, 2009), when NASA studied scientists, engineers and librarians
reactions to an operational test of an online document citation retriever system (Sullivan, 1967). It wasn’t until the World Wide Web and browsers appeared in the early nineties, when e-commerce really started to take off (Goel, 2007). In 1995 Dell, Cisco, Amazon etc. aggressively started to use the internet for commercial transactions (Goel, 2007).
Today, with the development and wide-spread use of mobile technology, customers can shop anytime and anywhere through an e-commerce shopping platform (Zhang, Wang, & Huang, 2016). Nowadays web analytics has become a very important part of many websites and helps in taking business decisions (Kumar, Singh, & Kaur, 2012). Visitors might end up on your website through numerous different paths, e.g., search engine results, banner ads, pop-up ads, and links from social media sites. To understand what is effective for the business, you need to be able to track all these behaviors (Semmelroth, n.d.). Another key reason for why web analytics is critical for business growth, is to know your visitors well and enhance the user experience according to their needs (Rai, 2019). What devices are your visitors using? What language are they speaking? What are their location? How old are they? What interests do they have? If you are able to improve the user experience, considering the answers to these
questions, you can make your website audience stay longer and ultimately turn them into customers. (Rai, 2019) It is predicted that, by year 2040, 95% of purchases will be eased by an e-commerce business (Castillo, 2019).
2
1.1
Background
Whether or not the customers buys the products or not, it is important to understand the supply chain, from where the product origins – manufacturers. A manufacturer is a person or a
company which produces finished products, ready to be sold ("What is a Manufacturer?," n.d.). There are multiple route to markets (RTM), two of the most common are Resale and Direct sale. Manufacturers can sell their product through resellers/retailers (resale) while others sell directly to the end customers (direct sale), although some even sell in both ways (see Figure 1).
The focus of this study is on resale and resellers online purchasing behavior, as it is distinct and has its own characteristics, compared to other organizational customers, e.g. end-customers (Buchanan, 1992). Fairhurst and Fiorito (1990) say, a reseller purchase is different in so many aspects, compared to business-to-consumer (B2C) and other business-to-business (B2B) markets, e.g.,
• A reseller buys products from the manufacturer and their competition • The purchase is made to directly resell
• The purchase is not for consumption
Stampfl and Hirschman (1981) also mean that a reseller usually buys different brands from the same product category. This habit does not normally occur in other B2B markets. The resale RTM demonstrate that a purchase decision is made by an individual person, while organizations make their purchase decisions in group (Stampfl & Hirschman, 1981).
Bearing in mind the fact that the resellers are companies, but purchases are made by individual employees makes this B2B market rather unique and complex, e.g., the current mood of the reseller employee might affect from whom the reseller buys.
Manufacturer → End customer = Direct sale
Manufacturer → Reseller/Retailer → End customer = Resale
3
1.1.1
Context of study
This study will not be written for a specific company, but it will leverage data from a
multinational information technology (IT) manufacturer, headquartered in United States. This company is listed on the Fortune 500 list ("Fortune 500," 2020), a ranking of the largest corporations in the United States. This company was selected to be investigated as the author currently works there and is managing a product web application.
1.2
Purpose
The purpose of the study is to research and see if user interface (UI) design alterations, on a manufacturer’s web application, affect reseller employees behavior. The study explores the web analytics data within common groups, identifying similar and/or different trait alterations, to see if there are factors which play a major role in how the UI alterations affect the reseller
employees.
1.2.1
Research questions
How does UI design alterations, on a manufacturer’s web application, affect reseller employees behavior?
• How can changes, in reseller employees behavior, be interpreted via web
analytics?
• Which individual factors influences on how UI alterations are perceived by
reseller employees?
1.3
Delimitations
Due to the lack of research around resellers behavior change, after implementing a new UI design, the focus of this study will be on resale – from a single technology manufacturer. Among the resellers for this manufacturer, the expert users were separated from the novice users (see chapter 3.3.1). This because the study will shed light on the behavior change and for that it is out most important that the users are frequent visitors even before the new UI design gets implemented. The analytics data will be collected during a specific time frame, 8 weeks starting from the 27th of January 2020.
4
1.4
Target audience
As this study wants to examine the impact on a manufacturer’s web design has on resellers, this naturally makes the manufacturers the primary target audience. It could also be a resource for anyone who designs digitally for resellers.
1.5
Disposition
In the next chapter the methodological choices, that underpins this study, will be described and discussed. Thereafter the theoretical chapter will both present the study’s theoretical context, along with methodological theory to better understand the methods used. In the next chapter the result is summarized and thereafter discussed, in relation to the theory. Finally this study’s main conclusions are presented.
5
2
Method
As the analytics data for 207 resellers has been collected through an analytics tool, the approach of this study is quantitative. Vogt (2011) explains that quantitating refers to the process of assigning numerical values to data conceived as not numerical. The purpose of quantitating is to answer research questions or test hypotheses addressing relationships between
explanatory/predictor variable(s) and response/outcome variable(s) built from both qualitative and quantitative samples (Vogt, 2011). In this study the research questions will be answered through a quantitative approach constructed from quantitative data.
A qualitative approach was considered, but Jiang et al. (2019) list below of three shortcomings to why a qualitative approach isn’t suitable when evaluating an application’s UI design.
1. Many of the UI features within the application are difficult to isolate and evaluate separately, with a qualitative analysis, as they are synergistic.
2. It is difficult to scale a qualitative analysis to analyze additional applications and it is rather impossible to evaluate thousands of applications individually and manually. 3. Qualitative analysis cannot be easily generalized to infer important design insights and
use them to guide new designs.
After settling on the research approach, a scientific research method was selected for data collection.
2.1
Scientific research method
This study will analyze and evaluate the usability of a new design which was created and implemented on a leading tech company’s web application.
There are generally two different kinds of usability tests – finding and fixing usability issues (formative tests) and describing the usability of an application using metrics (summative tests) (Sauro & Lewis, 2016). Formative, meaning giving direct feedback to improve learning, and summative, meaning evaluating what was learned (Sauro & Lewis, 2016). This study will take a summative approach. There are typically two types of summative tests – Benchmark test, where the goal is to describe how usable an application is to a set of benchmark goals, and
Comparative test, where the goal is to compare multiple applications to evaluate which is more effective and efficient (Sauro & Lewis, 2016). A comparative test can be performed in two
6
different ways, either by letting participants attempt the tasks on all applications (within-subjects design) or let different set of participants work on each application (between-(within-subjects design). The next chapter will elaborate on how these two comparative test approaches operate and which one will be used for this study.
2.1.1
Between-subjects design
The most common approach when evaluating an application design is to run an A/B test. The approach of a traditional A/B test is to run it with a between-subjects design. Poulos, Korfiatis, and Papavlassopoulos (2020) defined an A/B test as a randomized controlled experiment technique that involves the experimental assessment of an overall evaluation benchmark (e.g., the performance of an alteration on a website) against a baseline. Meaning that the experience is split in two versions, an A test (Original) and a B test (Redesign). Normally 50% of the users gets randomly redirected to the A test and 50% to the B test, see Figure 2. These two tests run at the same time. The experiment may run for a few weeks, to later compare and analyze the web analytics from the two versions.
A test (Original)
B test (Redesign)
Analyze and compare the data 50% Users
100% Users
50% Users
Figure 2 Illustration of an A/B test with a between-subjects design, based on
illustration by Kohavi, Longbotham, Sommerfield, and Henne (2009)
2.1.2
Within-subjects design
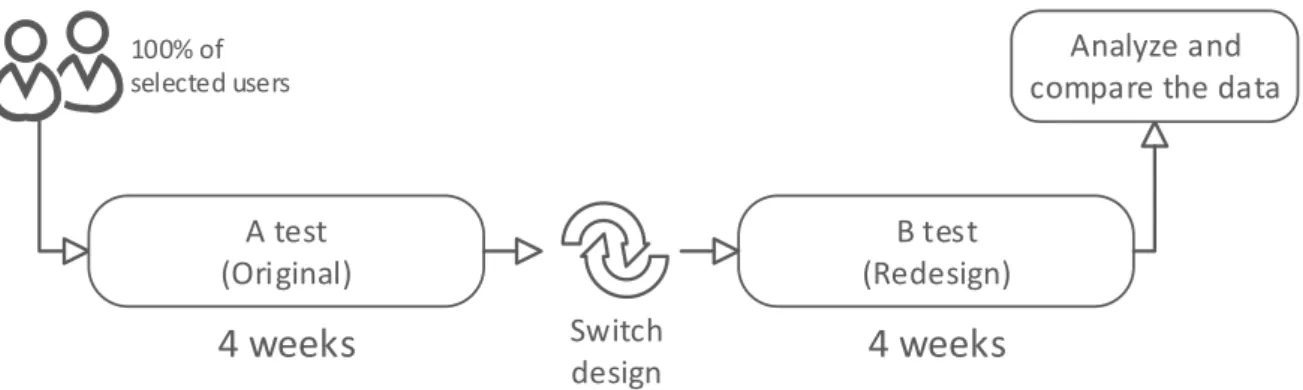
For this study a within-subjects design seemed to be the better approach, see Figure 3. An A/B test will be performed, where the A version will be the original UI design and the B version will be the new UI design. 207 reseller users were selected (see Chapter 3.3.1), and they will be exposed to the two versions consecutively. During the first 4 weeks of the test, 100% of the
7
selected users will be exposed to the A test. Then the design will be changed for the B test and during the last 4 weeks 100% of the selected users, will be exposed to the redesign. Reseller usage and behavior analytics will then be analyzed after testing the A and the B version for 8 weeks. 100% of selected users A test (Original) B test (Redesign) Analyze and compare the data
4 weeks
Switch4 weeks
design
Figure 3 Illustration of an A/B test with a within-subjects design
Sauro and Lewis (2016) recommends to alternate the first encountered test version (changing between A and B), to avoid carry-over (learning) effects in a within-subjects designed test. They mean that if all users were to test the A version first, it would risk biasing the users while testing the B version – either for or against the A version. This start order alternation of users should also be randomized, meaning the users should be randomly assigned to either the A or the B version (Budiu, 2018). If the order wasn’t randomized, the researcher could for example assign the users he/she likes to the A version and when the test concludes he/she would discover that the A version performed better than the B version (Budiu, 2018). This kind of selection would have an impact on the result and therefore a randomization is recommended.
2.2
Data analysis procedure
In the analysis, the users continuous traits will be reviewed to see if there were changes after implementing the B version (Sauter, 1998). These analytical findings were then used to discover reseller behavior patterns. Tullis and Albert (2013) mean that it is good to collect data around three topics, task success, time and satisfaction. Task success and time are considered to be performance metrics and these will help you understand how efficient (time) and effective (task completeness) your application is (Tullis & Albert, 2013). Satisfaction metrics relates to what users think and feel about the application. This study will analyze the two first – task success and timing. Satisfaction is the only measure which won’t be included, simply because there is no web analytics data, in this test, where this is being measured.
8
2.2.1
Conversion rates
A conversion rate is the number of users who perform a specific task, divided by the sum of a certain user type, like returning visitors, unique visitors etc., during a time interval. If the conversion rate increases after implementing a new strategy, it is an indication that it was successful, but if it were to decrease, then you most likely need to rework the strategy. (Jansen, 2009) In the case of this study, the B test is considered to be the new strategy which will be implemented.
2.2.2
Binary success
Tullis and Albert (2013) mean that binary success measuring is the most common way of measuring task success. Each time a user performs a given a task, they will receive a “success” or “failure” score, in the shape of 1’s and 0’s, depending if they completed it or not. Out of this, it is easy to calculate a percentage. The following formula will be used to calculate the
probability value (probability value), i.e., task success rate: 𝑆𝑢𝑐𝑐𝑒𝑠𝑠𝑓𝑢𝑙 𝑈𝑛𝑖𝑞𝑢𝑒 𝑃𝑎𝑔𝑒𝑣𝑖𝑒𝑤𝑠
𝑇𝑜𝑡𝑎𝑙 𝑈𝑛𝑖𝑞𝑢𝑒 𝑃𝑎𝑔𝑒𝑣𝑖𝑒𝑤𝑠 = 𝑇𝑎𝑠𝑘 𝑆𝑢𝑐𝑐𝑒𝑠𝑠 𝑅𝑎𝑡𝑒 (𝑝𝑟𝑜𝑏𝑎𝑏𝑖𝑙𝑖𝑡𝑦 𝑣𝑎𝑙𝑢𝑒) As an example, if 10 users were to reach the order confirmation page, while the total unique pageviews were 100. This means that your website has 10% success rate of completing the purchase task.
A task was defined, which include a UI alteration, to see if task completeness was higher with the A or B version. When reviewing the task success rate, the unique amount of page views will be analyzed. A unique page view means that it is counted only when user clicks it the first time during the active session, all additional clicks on the same page, during the active session, won’t be counted.
2.2.3
Confidence interval – Adjusted Wald Method
When it comes to trusting the probability value from the task success, described in Chapter
2.2.2, the Adjusted Wald Method will be applied. Tullis (2008) mean that the results of this
9
to help understand how much uncertainty there is in the statistics, e.g., a smaller sample size will give a greater uncertainty span.
Vogt (2011) states that there is a widespread recognition of the limits of the p-value and its overuse would be hard to ignore today. Vogt explains that there is quite a bit of the discussion with focus on how researchers have misused and misinterpreted the p-value. Cumming and Finch (2001) mean that if you repeat an experiment, you are likely to obtain an x value quite different from the p in your original experiment. That they mean because the x is an unreliable, or unstable, measure even in studies with large sample sizes. Compared to a confidence interval, which is much more stable and therefore much more useful as a prediction of what is about to happen in the next experiment (Cumming & Finch, 2001).
The Adjusted Wald Method is used to adjust the observed proportion of task successes to take into account the small sample sizes, which are commonly used in usability tests (Agresti & Coull, 1998).
𝑝𝑎𝑑𝑗± 𝑧 ∗ √p𝑎𝑑𝑗(1 − p𝑎𝑑𝑗)/𝑛𝑎𝑑𝑗
In the formula you can see the total number of trials (𝑛), the amount of trials where the task was successfully completed (𝑝), the confidence level (𝑧), the adjusted 𝑝 value (p𝑎𝑑𝑗= (𝑛 ∗ 𝑝 + 𝑧2/2)/(𝑛 + 𝑧2)) and the adjusted 𝑛 value (𝑛𝑎𝑑𝑗 = 𝑛 + 𝑧2) (Tullis, 2008). An overview table of these values are presented below in Table 1.
Table 1 Value explaination of the Adjusted Wald Method
Values Description
𝑛 Total number of trials
𝑝 Amount of trials where the task was successfully completed 𝑧 Confidence level
p𝑎𝑑𝑗 (𝑛 ∗ 𝑝 + 𝑧2/2)/(𝑛 + 𝑧2)) 𝑛𝑎𝑑𝑗 𝑛 + 𝑧2
10
Confidence levels are shown as a percentage. Let’s say the confidence level is 95%, it means that if this experiment were to be repeated a 100 times, then the tester is sure that 95 times it would match the data they got from the entire user base.
2.3
Validity and reliability
According to Schreier (2012), all data collection methods has validity and reliability difficulties. Validity and reliability is directly linked with the choice of method. They also will increase, if more research methods and more data will be collected (Schreier, 2012).
The study aims to achieve high validity and reliability, but about two weeks in on the B test a majority of the countries participating in this study put their populations in quarantine. The reason behind the quarantine was the European mass outbreak of the coronavirus COVID-19. This led to that some of the resellers, which were intended to be include in the four-week-long test, stopped using the application after one-two weeks of testing. It’s even possible to see a decline in usage of the participants that were included in the experiment (Figure 11 on Chapter
4). For this reason, it is closer to the truth to look at means and medians rather than quantities.
To avoid a big spike in usage on launch of the B version, there will be no communication sent to the resellers stating that there has been launched a new UI design. To increase the reliability, Sauro and Lewis (2016) suggest that the test should alternate between starting with the A and the B version, this to avoid carry-over effect. By the time this effect was discovered, the data collection had already begun and the tight time frame didn’t allow for test to begin over. This alternation would have produced a more reliable result.
2.4
Ethics
As the study gets its data from reseller employees using the product web application, this creates an issue around storing personally identifiable information (PII). Email address is used as the primary key when defining a reseller user, but because this falls under PII it has to be anonymized when injected into Google Analytics ("EU General Data Protection Regulation," 2016). When anonymizing, the PII gets converted into a unique value which can’t be reverted back to its original value, prior to anonymization. According to the European Commission ("EU General Data Protection Regulation," 2016), as soon as the data is anonymized it no longer considered to be PII. Users have the right to anytime opt-out
11
The Swedish Research Council also confirms this by saying that anonymization is a way of removing PII, but keeping the research data (Vetenskapsrådet, n.d.).
2.5
Method discussion
The within-subjects designed A/B test (see Figure 3 in Chapter 2.1.2) was considered more relevant for the study as it can look at the behavior change of the exact same users, while in a traditional (between-subjects designed) A/B test (see Figure 2 in Chapter 2.1.1) a user would only test one version. Although, this study’s A and B test took place under different time intervals. The risk with this would be that external forces, could have an impact on one of the tests and not the other one. This actually happened, as the results from the B test were inevitably affected by the Corona virus (COVID-19) outbreak. This mainly caused a usage decrease during the last couple of weeks of the B test. Also the fact that the test versions start order weren’t alternated, might also have an impact on the result. Users might learn or tire during the A test and therefore be more experienced or inattentive when the B test starts. This will most likely affect the study.
As long as you have a website, with somewhat stable usage, it is quite easy to launch and get results out of an A/B test. The tricky part comes after the performed test, when you need to read, analyze and understand what behaviors and trends can be hauled out from the 1’s and 0’s seen in your web analytics tool. Although, it really depends on what you are trying to find, e.g., if you are simply trying to find out if, overall, more purchases are made with the A version or the B version, then yes this might not be very hard to see in your analytics data. But what happens if you slice the purchases into individual factor subgroups, e.g. gender and culture. Does the increase correlate in all subgroups or can you spot deviations, e.g., women from Egypt has a purchase increase of 200% on the B test, while it dropped 50% for Dutch men. Then the overall purchase increase might look good as it is positive, but it becomes interesting when slicing the statistics into subgroups and try to understand why this UI design wasn’t successful for Dutch men. This is where the deeper knowledge is required, to understand why these subgroups are deviating and to be able to address potential UI issues.
As mentioned in Chapter 2.3 it was important not to communicate anything to the resellers, around the launch of the B test, as this would increase the usage and potentially alter the results significantly.
12
3
Theoretical framework
This chapter presents the theories that form the basis of the study. First the web application and its UI changes are presented, to then focus on A/B testing. Which is followed by a few chapters on data collection and influences from individual factors.
3.1
Web application
The web application, which is analyzed in this study, contains all the purchasable products produced by the manufacturer. The web application’s architecture is built as a single page application (SPA). This means that the application loads most of the resources on the first load and after this it doesn’t update the entire page again but only, after the user has made an interaction, redraws/reloads part of the content (Patel, 2014). This significantly improve a website’s speed.
Dailey (2004) and Eroglu, Machleit, and Davis (2001) demonstrated that a “web atmospherics” model can be applied to e-consumer behavior. Eroglu et al. (2001) grouped the atmospheric qualities into two general categories; high task-relevant environment and low task-relevant environment. Musso and Druica (2019) explains that high task-relevant cues includes the web features, e.g., verbal and visual information. This facilitates and enables the consumer's
shopping goal accomplishment, e.g., navigation, graphics and how products are presented. They also explain that low task-relevant cues such as colors, borders, backgrounds, fonts, animation, music, icons, pictures for decorative purposes, have a high impact on the overall image and atmosphere of the website but are not strongly connected with the purchasing rate.
The A version was designed by a man from a country with individualistic culture, whereas the B version was designed by a woman from a country with collectivist culture. The
individualistic/collectivistic dimension is described in chapter 3.4.5. Both designers were between 20-30 years old.
See Figure 4 and Figure 5 below for mockups of the two versions. To emphasize the differences between the A and the B version, the mockups are of the exact same page. In the following subchapters the details on these mockups will be presented.
13
Figure 4 Mockup of the A version of the application.
Figure 5 Mockup of the B version of the application.
3.1.1
High task-relevant changes
On the original design (A test) if I user searched a product and clicked on it to retrieve further details, it was presented in a pop-up, blocking the user to make any other interactions other than with the product that was clicked, see Figure 4. Blakemen (2014) states that most consumers finds pop-ups annoying as they block the main page and needs to be closed to reach the content behind. Also, as the main reason for making a SPA is to give users a smooth and fast
14
end”. Therefore, in the redesign (B test) the pop-up was changed for a collapsible section below the product, allowing the user to interact with the entire main page, but at the same time having the detailed product information open, see Figure 5.
The navigation across the application was previously (A test) mainly labeled with icons, see
Figure 6.
Figure 6 Navigation menu on the A version.
Past user feedback has stated that this was confusing as it sometimes wasn’t clear what the icon was supposed to symbolize, resulting in many unnecessary and unwanted clicks. On the redesign (B test), the icons were swapped out for text instead, see Figure 7.
Figure 7 Navigation menu on the B version
The goal was to make it more clear and get rid of unwanted clicks, from both analytics and user satisfaction perspective. Koivumäki (2001) provides empirical evidence suggesting that the navigational features, the quality and how products or services are presented, affect e-consumer behavior. This evidence indicates that when an e-commerce navigation enhances the satisfaction of the e-consumers' shopping experience, they actually tend to purchase more.
3.1.2
Low task-relevant changes
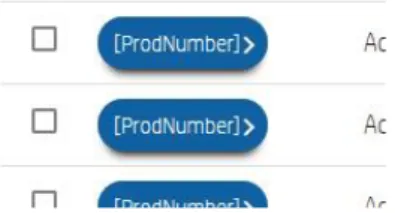
The overall look and feel of the web application was redesigned in the B test. The original design was more plain, gray and squared, while the redesign is more spacious, softer and strategically colorful. To summarize, the web application got a facelift to present UI design standards and trends, see Figure 5. Additionally, the action “Request further information” to fetch details around a specific product number, was only a hyperlink in the A version (see
15
Figure 8 The hyperlinked product number, in the A version, fetches details around
the product.
Figure 9 In the B version, details of a product number was fetched by clicking on a
button.
Bonera (2011) emphasizes that it is important to design a graphically attractive website as it creates a pleasant environment, which facilitates navigation and increases the website’s value. Researchers has proven that the aesthetics of a website increases the buying intention (Potts, 2007).
Both journals by McDowell, Wilson, and Kile (2016) and Kohavi et al. (2009) mentions how UI design alterations affects the purchase conversion rate.
3.2
A/B tests
Martin and Hanington (2012, p. 200) says that if analytics data is analyzed alone or combined with methods, e.g., A/B tests, web analytics can paint a broader, more realistic picture of what people’s behavior on the website looks like.
Nielsen (2005) lists four huge benefits to why A/B. • Actual behavior under real world conditions.
• Ability to measure very small performance differences with high statistical significance. • It can resolve trade-offs, i.e. conflicting guidelines.
• It’s cheap.
16
• Goals needs to be able to be measured by a computer. Goals like brand reputation can’t be measured by a click on a button.
• It only works on fully implemented designs. He also mentions that a common problem, when using this quantitative method in university research, is that the test is not
performed on real websites, neither are the test subjects mainstream users (Nielsen, 2004).
• Nielsen (2004) also mentions that if you measure enough variables in an A/B test, some will end up correlate, even if the issues being measured have no real connection. The challenge here is to control the experimental conditions and still being able to generalize the findings to problems in the real world.
3.3
Data collection
Reseller web analytics were collected through "Google Analytics" n.d.) and later enriched with necessary details from reference tables and further analysis was carried with Microsoft Excel.
3.3.1
User grouping
Faulkner and Wick (2005) divide their experiment participants in three groups based on two variables: computer and application experience. The three groups were: (1) beginner/beginner, no computer experience and no experience of the applications that was going to be tested; (2) expert/beginner, more than one year of computer experience but no application experience; (3) expert/expert, more than one year of computer experience and more than one year of application experience. This study uses this user grouping to define whether a user should be included or excluded from the test. I assume that all reseller, for a leading tech company in the 2020, have staff with more than one year of computer experience and therefore I will exclude group 1. There is also more research on beginner’s behavior of application and system use, than on experts, and this is why I will exclude group 2 as well. Like Faulkner and Wick (2005), the users were defined as experts if they have used the application consecutively at least once a week for an entire year. The grouping is performed and validated with the help of the analytics history, dating back to the application launch 1,5 years ago.
I am also taking in consideration the geographical position of the reseller. The product web application has reseller users from countries in Europe, Middle East and Africa.
17
3.3.2
Type of data collected
By default, Google Analytics are collecting and storing a lot of measures and dimensions. This simplifies the analysis. Definition of the key performance indicators ("Google Analytics," n.d.) used in this study are described in the Word list.
3.3.3
Data enrichment
The analytics data was not modified, but enriched with additional dimensions to help in the analysis. As mentioned in Chapter 3.3.2, Google Analytics collects a lot of data by default, but there are some business specific data which needs to be added to ease and enhance the analysis. The enrichments, which were injected into Google Analytics as custom dimensions, were the following:
• Anonymized reseller user IDs • Reseller user gender
• Reseller country
3.4
Influences from individual factors
To maximize website appeal for a given user, it would therefore be best to offer designs
personalized to their individual visual preferences (Reinecke & Gajos, 2014). Based on a review of the literature related to individual factors of purchasing behavior, four demographic
subgroups are supposed to play an important role for consumers; age, gender, education/income and culture. Each one of these will be covered here, after Chapter 3.4.1.
3.4.1
Firmographics and psychographics
Dexter (2002) states that a business always have some amount of overlap between firmographics and psychographics. We need to understand if the businesses are rational (businesslike) or emotional (consumerlike). This is why established psychographics or firmographics needs to be considered. See Table 2 for differences.
18
Table 2. The overlap between business and consumers
Business Consumer
• Its turnover • Its sector • Its age • Its strategy
• How many employees it has • What technology is in place and
what are the plans for technology
• What kind of customer base it has – is it a high street business with many transient customers, or does it rely on a few large, regular customers?
• Is it growing or shrinking? • The degree of volatility • By how much?
• Geographic and regional markets
• Seasonality, and issues relating the lifespan of the ‘products’ they are making/selling? • Business attitudes: for example,
what is the important to them in a supplier?
• Their profitability
• What kind of business are they?
• Age and gender
• Their level of educational attainment
• Their previous employment . were they involved with a large company and decided to set up on their own, or have they always been self-employed?
• Their general attitudes – small businessman are notoriously cautious but clearly some are early innovators
• Their business philosophy – inward or outward focused • Level of understanding/planning • Attitudes to risk-taking
• ‘Doers’ or ‘managers’ • Attitudes to technology • How do they manage their time,
particularly in terms of the overlap and space between work and play?
• What are their personal goals and ambitions? What do they consider important?
• What kind of person are they?
3.4.2
Age
Older people are less interested in finding new information about the products they want to buy, while young people seek information (Wells & Gubar, 1966). Age shows the bond between loyalty and satisfaction with a product, therefore these connection are stronger in older consumers (Homburg & Giering, 2001).
Reinecke and Gajos (2014) performed a worldwide preferences analysis for website design, using 2.4 million ratings from 40,000 people from 179 countries. With this study they were trying to point out specific trends within demographic subgroups. They discovered that colorful pages were ranked higher by people below 20 and above 51. The older participants in their study did clearly find the plain and colorless websites less visually appealing than any other user. Another interesting trend they discovered was that the older the user is, the more complex they prefer the website to be. Starting from 41 years old people also responded that they like the website more, the more complex it is.
19
3.4.3
Gender
In study by Cyr and Bonanni (2005) it was found that there were areas where women and men had statistically significant different responses. The first one being the appeal (e.g., colors, photographs, shapes, font types and animations) of the website and the second being the website’s ability to fulfil personal need and expectation. In both areas men rated higher than women. Cyr and Bonnani also asked their participants to evaluate 11 design elements from three categories; Information design, Navigation design and Visual design. On all 11 elements, in the three categories, women rated lower. In information design, the men perceived the website as well organized and its product information well presented, while the women did not. In terms of navigation design women, more than men, weren’t satisfied with the Navigation design and how to find the right product and services. The researchers suggest to investigate preferred
navigation for women as there are clearly a different opinion on this matter. Cyr and Bonanni means that in all cases above, web designers will need to more carefully examine the exact elements of websites which create such different responses. As the amount of women shopping online is increasing, it is needed to understand women’s requirements, as this will have
commercial value. (Cyr & Bonanni, 2005)
In a study with 160 volunteering participants, Simon (2001) conducted an experiment which shows that 84% of the female participants preferred a lesser use of graphics and page levels, meaning less subpages to go through when looking for specific content. 77% of the male users indicated that they like when a website makes extensive use of graphics and animations. Simon (2001) also emphasizes the fact that the number of women using internet is increasing and web designers should take their users gender in consideration when building a website, but he does not go into details on how this could be taken into consideration.
Reinecke and Gajos (2014) study points on the trend that men prefer saturated colors on gray or white backgrounds, while women preferred when websites use more homogeneous color schemes and rarely likes sharp contrasts between colors to differentiate elements and structure content.
Stenstrom, Stenstrom, Saad, and Cheikhrouhou (2008) use an evolutionary perspective to study gender differences in website preferences and navigation. In this interpretation, males tend to use an “internal map” style of navigation because hunting required accurate navigation over long distances. Females, on the other hand, tend to use “landmark” navigation because gathering was carried out over a smaller area close to the home base. E-navigation is similar
20
because users must navigate in order to travel through pages, objects and landmarks in a manner similar to physical navigation. Stenstrom et al. (2008) shows us results which demonstrate that extended hierarchical levels of an e-commerce website are more easily navigated by males than by females.
Gopal, Miranda, Robichaux, and Bostrom (1997) mentions in their research that there are some variation in gender, but there are also other aspects of diversity that needs to be taken into consideration, e.g., race, education and culture.
3.4.4
Education and income
Peoples education level has been given little attention when researching e-consumers behavior. There are theories that suggests that people with higher or better education are more involved in the acquisition and processing of information before making purchasing decisions, on the contrary, people with less education trust without needing as much information (Capon & Burke, 1980). People with higher educational achievements feel more comfortable when handling and relying on new information (Hoyer, 1984). There is research that mentions people's income is related to their e-consumer behavior. Li, Kuo, and Rusell (1999) states that education is often positively correlated with an individual’s income. So it is to be expected that consumers with a higher educational level and with more money get alternative information about a particular e-reseller, in addition to their level of satisfaction, while consumers with lower educational fulfillment and less money see satisfaction as a sign of information with which to take the decision to make or not to make a purchase.
In the paper by Reinecke and Gajos (2014) it is shown that lower education level indicates a higher preferences for colorful website, independent of age.
3.4.5
Culture
Culture makes a difference when it comes to perceptions of loyalty (Cyr, 2008, p. 49). The
Individualism/Collectivism dimension is defined by Hofstede.
Individualism on the one side versus its opposite, Collectivism, as a
societal, not an individual characteristic, is the degree to which people in a society are integrated into groups. On the individualist side we find cultures in which the ties between individuals are loose: everyone is expected to look after him/herself and his/her immediate family. On the collectivist side we
21
find cultures in which people from birth onwards are integrated into strong, cohesive in-groups, often extended families (with uncles, aunts and grandparents) that continue protecting them in exchange for unquestioning loyalty, and oppose other ingroups.
(Hofstede, 2011) Hofstede and Hofstede (2004) defined a national index for individualism-collectivism dimension. Minkov et al. (2017, pp. 387-388) calls Hofstede’s way to operationalize, above quoted definition, controversial. As Hofstede collected his sample from a single organization, it was suggested that the subjects reflect some standardized culture, as everyone is working for the IBM organization, which might suppress cultural differences (Simon, 2001, p. 25).
Hofstede and Hofstede (2004) give a good example how this works in a company culture. Swedes makes business with a company, while Saudi makes business with a person whom they know and trust. When a Saudi don’t know the other party, they prefer to make first contact through a middle-man who is trusted by both parties. At the root of the difference between these cultures is a fundamental issue in human societies: the role of the individual versus the role of the group. Hofstede and Hofstede lists some examples of the key differences between
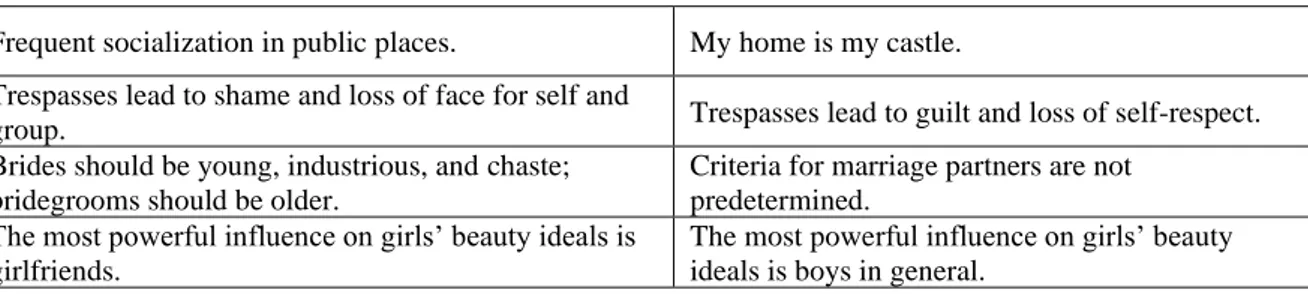
individualism and collectivism, see Table 3. These examples below helps to understand how a collectivist would act in a certain situation, compared to an individualist. The first example in this table really makes it clear, as this is the springboard into life on how these two newborn babies are raised either into collectivity or individuality, and in some countries a hybrid of the two.
Table 3. Differences in behavior between collectivists and individualists
Collectivist Individualist
People are born into extended families or other in-groups that continue protecting them in exchange for loyalty.
Everyone grows up to look after him or herself and his or her immediate (nuclear) family only. Children learn to think in terms of “we.” Children learn to think in terms of “I.”
Value standards differ for in-groups and out-groups: exclusionism.
The same value standards are supposed to apply to everyone: universalism.
Harmony should always be maintained and direct confrontations avoided.
Speaking one’s mind is a characteristic of an honest person.
Friendships are predetermined. Friendships are voluntary and should be fostered. Resources should be shared with relatives. Individual ownership of resources, even for
children.
Adult children live with parents. Adult children leave the parental home. High-context communication prevails. Low-context communication prevails.
22
Frequent socialization in public places. My home is my castle. Trespasses lead to shame and loss of face for self and
group. Trespasses lead to guilt and loss of self-respect.
Brides should be young, industrious, and chaste; bridegrooms should be older.
Criteria for marriage partners are not predetermined.
The most powerful influence on girls’ beauty ideals is girlfriends.
The most powerful influence on girls’ beauty ideals is boys in general.
In a journal by Minkov et al. (2017) the individualism-collectivism dimension was revised and after 52 974 respondents, a new national index from this 56-country study was defined. See full list in Table 4. Higher score indicates that the nation is more individualistic and a lower score suggests that the nation is more collectivistic. The scores in this list are factor scores, multiplied with 100.
Table 4 56 countries indexed on how collectivistic or individualistic they are (Minkov et al.,
2017, p. 396).
Sun (2001) mean that users from collectivist cultures have a strong preference for visuals, whereas users from more individualistic cultures such, e.g., Germany, prefer a logical and structured page layout. Users from an individualistic country expect links in the navigation menu to be alphabetically organized and would feel frustration when not seeing the logical connection between two page elements. While users from collectivist countries have a strong preference for design, especially visuals related to the local culture as it makes them ”feel comfortable” when browsing the website. (Sun, 2001, p. 100).
Country Score Country Score Country Score Country Score
1. The Netherlands 182 15. Czech Republic 70 29. Hong Kong -5 43. Vietnam -78 2. Denmark 140 16. New Zealand 68 30. Chile -8 44. Colombia -81
3. Sweden 133 17. Spain 58 31. Poland -15 45. Malaysia -89
4. Norway 112 18. Serbia 58 32. Turkey -18 46. Venezuela -95
5. Belgium 110 19. Japan 42 33. Romania -19 47. India -101
6. Switzerland 105 20. USA 33 34. Russia -21 48. South Africa -105 7. Germany 102 21. Greece 30 35. Puerto Rico -29 49. Kazakhstan -106
8. Austria 95 22. Portugal 30 36. Singapore -29 50. Peru -117
9. United Kingdom 93 23. Ireland 27 37. China -31 51. Thailand -121 10. Finland 88 24. South Korea 25 38. Taiwan -43 52. Philippines -126 11. France 86 25. Israel 16 39. Dominican R. -49 53. Egypt -141 12. Australia 83 26. Ukraine 14 40. Brazil -56 54. Indonesia -171
13. Canada 78 27. Italy 5 41. Mexico -63 55. Kenya -177
23
In the study by Reinecke and Gajos (2014) it was found that preference for different levels of colorfulness is highly influenced by a person’s country of residence. The individualistic countries (first column from Table 4) showed more appeal for less colorful websites than for most other countries (Reinecke & Gajos, 2014). The results from their paper suggest that countries with a regular exchange of cultural values, e.g., due to migration or same native language, share similar website preferences. As an example, all English speaking countries did prefer higher colorfulness and all neighbor countries in the Northern Europe preferred lower colorfulness on websites.
In a study, with results from 1142 participants, Cyr (2008, p. 63) shows that visual design generates trust for users from a collectivist culture, but not for users from individualistic cultures.
24
4
Result
To get a better understanding of the results, visual figures will be displayed and complement the numerical results. As the test were performed consecutively, each user were testing the A version for 4 weeks and then the B version for 4 weeks.
Out of 207 participants included in this 8 week long test, 44 were identified as women and 163 as men, see figure Figure 10.
Figure 10 Shows the split between male and female reseller employees
When looking at the amount of sessions per day you can see a dip last during the last 10 days of the B test, see Figure 11. overall The overall count for these 8 weeks were 4 027 sessions and 28 704 pageviews. 21% 79% Female Male 0 20 40 60 80 100 120 140 Da y 1 Da y 3 Da y 5 Da y 7 Da y 9 Da y 1 1 Da y 1 3 Da y 1 5 Da y 1 7 Da y 1 9 Da y 2 1 Da y 2 3 Da y 2 5 Da y 2 7 Ses sio n s Test day A test (Original) B test (Redesign)
25
Participants in this study came from countries in Europe, Middle East and Africa. In Figure 12 a detailed list of how many reseller employees participated from each country.
Figure 12 Count of reseller employee users per country participating in this study.
4.1
Individual factors
In this chapter gender and culture will be in focus when analyzing the data. The result will present analytics data around pageviews per session and completeness of task.
1 1 1 1 1 1 1 1 1 1 1 1 1 1 1 1 2 2 2 2 2 2 2 2 2 2 2 2 3 3 3 3 3 5 6 6 7 8 8 9 9 10 11 13 28 32 Kenya Kuwait Algeria Yemen Tunisia Albania Botswana Bahrain Estonia Oman Bosnia and Herzegovina Réunion Finland Serbia Czech Republic Slovakia Israel France Bulgaria Saudi Arabia Mauritius Greece Croatia Belarus Morocco Denmark Macedonia Ukraine Latvia Jordan Hungary Belgium United Arab Emirates Sweden Austria Italy Switzerland South Africa Egypt Portugal Poland Spain Russian Federation Turkey Germany United Kingdom 0 5 10 15 20 25 30 35 C o u n tr y Participants
26
4.1.1
Pageviews per session
The majority of the 207 users were men and it was also here you could see the biggest difference. The average for men increased with 1,2 pageviews/session, while for women it decrease 0,1, see Figure 13. For women the result was not significant, while for men it was, with p < .001.The overall count for these 8 weeks were 4 027 sessions and 28 704 pageviews.
When comparing culture types, the seven most collectivistic countries and the nine most individualistic countries from Table 4, that participated in the this study (Figure 12), were grouped under two labels; collectivist culture and individualist culture. Thereafter they were used compared with each other on different measures. Figure 14 shows the mean of
pageviews/session.
Figure 14 Cultural differences on pageviews/session mean
0 1 2 3 4 5 6 7 8 9
Collectivist culture Indivualist culture
P ag ev iew s/s ess io n m ea n A test (Original) B test (Redesign) 0 1 2 3 4 5 6 7 8 9 Female Male P ag ev iew s/s ess io n m ea n A test (Original) B test (Redesign)
27
4.1.2
Task completeness
Each participant’s unique amount of requests for additional product details, divided by the total amount of unique pageviews, results in the percentage of the task completeness rate. A task was considered accomplished when a participant clicked to get more product details, see Figure 8 and Figure 9.
Figure 15 Gender differences on success rate.
Figure 16 Cultural difference on success rate of the participants..
0% 10% 20% 30% 40% 50% 60% 70% 80% 90% 100% Female Male T ask s u cc ess r ate A test (Original) B test (Redesign) 0% 10% 20% 30% 40% 50% 60% 70% 80% 90% 100%
Collectivist culture Indivualist culture
T ask s u cc ess r ate A test (Original) B test (Redesign)
28
4.2
Time spent on subpages
The average time spent on each one of the seven subpages was calculated per user and then the median of all user averages was selected. The reason behind the median of the time averages was due to the fact that 1-2 users spent up to 30 mins on some of the subpages, which significantly impacted the average of the means and exaggerated the impact of the redesign. The title values are mentioned on X axis in the graph below are the subpages available on each product within the application.
Figure 17 shows that users are actually spending more time on subpages, after the B version has
been implemented.
Figure 17 Shows the rate of time spent on each subpage, for both A and B test.
0% 10% 20% 30% 40% 50% 60% 70% 80% 90% 100% Me d ian r ate o f th e task tim e m ea n Subpage A test (Original) B test (Redesign)
29
If then Figure 18 is observed, the fact is that the amount of pageviews actually are higher on the A test. This means that users clicked less on the B test, but spent more time on the subpages.
Figure 18 Shows the rate of unique pageviews per subpage, for both A and B test.
4.3
Task completeness
One of the analytic deep dives were made on the task success rate when a user request
additional information about a specific product. For each participant the unique clicks to request additional product details, divided by the total amount of unique pageviews. See visualization of this in the diagram below, Figure 19.
0% 10% 20% 30% 40% 50% 60% 70% 80% 90% 100% Un iq u e P ag ev iew s rate Subpage A test (Original) B test (Redesign)
30
Figure 19. Success rate of the participants, in both A and B test.
The task’s total amount of unique pageviews are presented in Figure 20.
Figure 20. Total amount of unique pageviews
When applying the Adjusted Wald Method on the total amount of unique product requests compared to the total amount of pageviews, the following success rate ranges show, see Table
5. 0 10 20 30 40 50 60 70 80 90 0 % - 1 0 % 1 1 % - 2 0 % 2 1 % - 3 0 % 3 1 % - 4 0 % 4 1 % - 5 0 % 5 1 % - 6 0 % 6 1 % - 7 0 % 7 1 % - 8 0 % 8 1 % - 9 0 % 9 1 % - 1 0 0 % Nu m b er o f P ar ticip an ts
Task Success Rate
A test (Original) B test (Redesign) 0 200 400 600 800 1000 1200 1400 Sum of Unique Total Pageviews Sum of Unique Product Requests A test (Original) B test (Redesign)
31
Table 5 Adjusted Wald Method score on task success
A test B test
56,2% - 62,0% 64,1% - 69,2%
The result is statistical significant, as p = 0,008.
4.4
Searches
Users have the option to perform a product search. The search per session mean went up 0,11 points, see Figure 21. The result is statistical significant, as p < .001.
Figure 21. Search mean per session.
0.6 0.62 0.64 0.66 0.68 0.7 0.72 0.74 0.76 0.78 0.8
A test (Original) B test (Redesign)
sea rch es p er s ess io n
32
5
Discussion
The discussion will highlight and answer the questions defined in the study. The study aimed to investigate the potential of UI alterations on a manufacturers web application, where solely resellers are users. This part will discuss theory and results to find answers to the questions. A discussion about whether reseller employees behavior is influenced by their individual factors when using a manufacturer’s web application. This can be important for better understanding the root causes to why certain UI alterations are more successful on some people than on others. There are certain parts from the result and the theory that doesn’t qualify for the discussion. The lack of some key demographics on the reseller employees, participating in this test, made it impossible to discuss if age, education and income has any influence on reseller employees. It was still considered relevant to keep all these individual factors in the theory, as the four of them together are the most vital demographics affecting consumers online purchasing behavior. Some of the performed analyzes aren’t significant enough or supported with enough theory to be able to imply anything. This means that the searches and task completeness by gender and culture will be excluded from the discussion.
As mentioned in Chapter 2.5, the fact that the test versions start order weren’t alternated, might also have an impact on the result. It is difficult to say how much carry-over effect there is and if it affected the B version positively or negatively, but it is safe to say that in some extent it did.
5.1
Tendencies
In this chapter the tendencies of this study will be discussed. Here below the navigation enhancement and the gender influences will be covered.
5.1.1
Navigation enhancement
In Chapter 4.2 it is mentioned that for each product there are seven subpages. In the original design these subpages could be accessed through hyperlinked icons. As mentioned in Chapter
3.1.1, it was sometimes difficult for some users to locate desired subpage as the meaning of the
icons occasionally wasn’t obvious. The result of this was a lot of pageviews on the subpages, where the time spent on the page wasn’t more than just a couple of seconds. On the B test (redesign), the icons were swapped out for text instead. When looking at Figure 17 it shows
33
that on the B test the mean time spent on the subpage per user is longer compared to the A test. If then Figure 18 is observed, the fact is that the amount of pageviews actually are higher on the A test.
The purpose of this UI change was to remove the unwanted clicks, users had reported in the past, as it caused some dissatisfaction around the UI on the A test. Merging these two figures (Figure 17 and Figure 18) would indicate that users clicked less on the B test, but spent more time on the subpages. As Koivumäki (2001) provides evidence of how a navigation
enhancement could lead to satisfaction increase, would mean that the result Chapter 4.2 should be interpreted as an enhancement for to the better.
5.1.2
Gender influences
The result of pageviews per session, sliced by gender, shows a rather big increase for men on the B test, while it is almost flat for women. There are mainly two parts that are seen as extra attractive for men, rather than for women. Reinecke and Gajos (2014) points out that men prefer saturated colors on white or gray, also Stenstrom et al. (2008) points out that a deeper
hierarchical navigation is easier for men to navigate. As mentioned in the chapter above, the application did go through a navigation enhancement for the launch of the B version. The pageviews per session has increased by 1,2 pageviews/session which is quite a lot. This increase is also statistical significant, as p < .001. As many of the subpages are located on a lower
hierarchal level, it does support the fact that men have clicking more on subpages than women, as they instead use a “landmark” navigation. Regarding the colors of the web application, it has a white background with saturated elements, e.g. the side menu and the header. This, as well, assists on bringing the pageviews up for men. The task completeness for women and men does correlate, but it is hard to read anything from this, other than the fact that the B test increased the task completeness for both women and men with each 6% points.
5.2
Justifiable results
In this chapter the justifiable results of this study will be discussed. Here below the task completeness increase and cultural influences, will be covered.
34
5.2.1
Task completeness increase
Chapter 4.3 provides an overview (Figure 19) of the conversion rate of users requesting details
about a product. By looking at this figure, it instantly tells you that there were an increase of Task Success Rate on the B test. This figure only includes each user’s probability value, which doesn’t really say anything about the overall task success rate. After applying the Adjusted Wald Method, the data looks much clearer. The A test had a uncertainty span of 5,8% points, while the B test had an uncertainty span of 5,1% points. Not a lot of difference between these two percentages, but it still indicates that the B test is more definite. Regarding the success rate itself, it is also clear that there was a positive growth on task successes during the B test, meaning more reseller employees successfully requested more product details. This doesn’t mean the amount of requests were higher on the redesign, instead it means that out of the total amount of requests, more people now clicked to request further product information.
As mentioned on Chapter 3.1.2, there was only one UI alteration performed on this page, a hyperlink was changed to a button, see Figure 8 and Figure 9. This might seem like a tiny thing, but it made a big difference in the analytics. I interpreted this as when the hyperlinked text was changed to a proper button in the B version, it made significant impact. This is also supported by the fact that it is statistical significant, as p = 0,008.
5.2.2
Cultural influences
As countries can be indexed on how collectivistic or individualistic they are, it makes it easy to group these together to look for traits in the analytics data. The result for pageviews/session mean shows that for collectivistic countries, it had increased with 2,1 pageviews/session, which is a lot. Although for individualistic countries, the mean is close to unchanged. The aesthetics of a website is very important (Potts, 2007) and as the web application went through a face lift prior to the launch of the B test, it was expected that the users would be positively impacted by this.
Both Sun (2001) and Cyr (2008) suggest that websites with a more visual design, generates trust and preference with people from collectivistic countries. This implies that the culture plays an important part in the online reseller behavior.
35
As the designer of the A version was from a individualistic country and the designer of the B version was from a collectivistic country, it could also be part of the reason to why the new design seems to work better with collectivistic countries.
5.3
Reseller, but yet a consumer
As Fairhurst and Fiorito (1990) mentions, resellers are different on why the purchase are made, compared to B2B and B2C. Stampfl and Hirschman (1981) puts it well when they say the resellers purchases are made by the individual (like a consumer), and not based on a group decision (like a company). As the purchase decision is taken by an individual on the reseller company, it would also imply that resellers are more affected by psychographics, rather than firmographics – even though they are a business.
After discussing around demographic subgroups here above, it is clear that the resellers are influenced by their individual factors while browsing on a manufacturer’s website. It is not clear if it has as great of an impact, as it has on consumers, but the reseller employees are definitely influenced.