SUSTAINABLE FLUE-GAS QUENCH
For waste incineration plants within a water-energy-environment nexus
perspective
EMAD AL HAMRANI NILS GRÖNBERG
School of Business, Society and Engineering
Course: Degree Project Course code: ERA403 Subject: Energy Engineering
Supervisor: Hailong Li
Examiner: Lena Johansson Westholm
ABSTRACT
The function of a flue-gas quenchis to remove additional contaminants from flue-gas and to reduce the wastewater from a waste incineration plant. The aim of this degree project is to find how the system is affected by using a quench and what factors limits the performance. This is done by modelling and simulating a waste incineration plant in Aspen Plus. Data and plant schematics were obtained by a study visit to Mälarenergi Plant 6 situated in Västerås, Sweden, which were used as model input and for model validation. The results have shown that the amount of wastewater can be reduced by more than half compared to a plant without a quench. The heat produced in the condenser, when discharging water to the boiler, would be lowered by up to 20%. For systems with a quench present when more water was
discharged to the boiler both the heat production and the pollutant capturing became better. However, the system has limits regarding the amount that could be recirculated, in the form of temperature limits in different parts of the system. In addition, if the heat load is low there is an insufficient amount of wastewater generated in the condenser to run the quench. In that situation, clean (fresh) water needs to be used instead. Using clean water is unwanted since the plant will then consume more resources while still producing less heat than a plant without a quench would.
Keywords: Biomass/waste fuel power plant, pollutant emissions, acid scrubber, ammonia,
ACKNOWLEDGEMENT
This degree project was suggested by Vattenfall AB to upgrade their current waste
incineration plants, within the framework for Future Energy Center Track 2 at Mälardalen University (MDH). We would like to thank our external supervisor Professor Jinying Yan at Vattenfall AB R&D, supervisor Associate professor Hailong Li and examiner Associate professor Lena Johansson Westholm for their support and guidance throughout the work. We would also like to thank Filip Öberg and Linus Fogelberg from Mälarenergi AB for the study visit and plant data.
Västerås June 2017 Emad Al Hamrani Nils Grönberg
SUMMARY
The purpose of this study is to use fewer resources (water and chemicals) in the wet flue-gas cleaning process of a waste incineration plant. Lowering the heat duty to instead generate less wastewater and emit less pollutants is wanted, due to regulations regarding emissions. Quench is able to do both these things by using the dirty condenser water to clean the gas of additional pollutants.
However, the effect of a quench and its key parameters have not been quantitatively studied, which is the purpose of this degree project. To effectively use resources this way fits into the nexus perspective, which gives a better understanding why efficient resource usage is necessary.
The water used in the quench will be captured in the bottom and reused. To avoid a high concentration of pollutants in the quench, water is discharged to the boiler. The pollutants in the water will be combusted or captured in the dry filters.
To fulfil the purpose of the study, the plant was simulated using different discharge rates and the effects it had on the plant was noted. Using a quench will lower the amount of heat that can be generated in the quench, since it will lower the temperature of the flue-gas and limit the amount of water in the flue-gas. For this reason, the heat load will be checked for the different discharge rates. The wastewater generated from the plant will also be checked, which will be the condenser flow minus the water used in the quench. Finally, the
concentration of ammonia in the quench water is necessary to check, since a high value could impact the pollutant capturing. The concentration in the quench water will be the value when the amount of ammonia that leaves with the discharge flow is equal to that entering.
The method consisted of three main parts, which were a literature review, an industrial investigation and modelling (simulation). The literature review consisted of gathering information about the plants processes and the efficiencies the parts would have. Focus was made to find information about the wet flue-gas cleaning processes, since these would be the main focus of the project. The industrial investigation was carried out by visiting
Mälarenergi Plant 6 in Västerås, Sweden. There, input data and overall plant schematics needed for modelling and simulation were collected. Two models were created in Aspen Plus: one for the combustion process and one for the quench and condenser. Some values were then further calculated in Excel.
The results for the plant without a quench produced around 8.3 tons of wastewater per hour while the runs with a quench had a production of around 3.9 tons. The heat production was impacted from the discharged water, and the value was lowered from 7.6 MW without a quench to 6.3 MW at the highest simulated discharge rate.
The amount of discharged water when a quench was present proved to affect the heat duty, although the wastewater generation was about the same for the different runs. The
concentration of pollutants in the quench was lower when more waster was discharged hence the pollutant capturing was increased as well. However, the system had some limits which could not be exceeded. These were the quench temperature and the temperature after
combustion. The heat demand will also limit the system when it is low. If the heat demand was lower than the ideal there would be less wastewater from the condenser. When the load was very low clean water had to be treated and used instead, which is bad since it would consume more resources rather than using wastewater. If the plant discharges less water there will also be less heat available for condensing. This means the quench can run properly at lower heat loads as long as the pollutant concentration can be managed with the limited discharge rate.
Keywords: Biomass/waste fuel power plant, pollutant emissions, acid scrubber, ammonia,
TABLE OF CONTENTS
1 INTRODUCTION ... 1
1.1 Background ... 1
1.1.1 Previous research ... 4
1.1.2 Defining the problem ... 4
1.2 Purpose ... 4 1.3 Research question ... 5 1.4 Delimitations ... 5 2 METHOD ... 6 2.1 Literature review ... 6 2.2 Industrial investigation ... 6
2.3 Model development and validation ... 6
2.4 Simulation and sensitivity analysis ... 7
3 LITERATURE REVIEW ... 8 3.1 Flue-gas cleaning ... 9 3.1.1 Dust removal ... 9 3.1.1.1. Cyclones ... 10 3.1.1.2. Fabric Filters ... 10 3.1.1.3. Venturi Scrubbers ... 10
3.1.2 Nitrogen Oxides Reduction ... 10
3.1.2.1. Selected non-catalytic reduction (SNCR) ... 11
3.2 Quench ... 11 3.2.1 Hydrochloric acid ... 12 3.2.2 Ammonia ... 12 3.2.3 Mercury ... 12 3.3 Without quench ... 13 3.4 Condenser... 13 3.4.1 Alkaline scrubbing ... 13 3.5 Environmental emissions ... 14
4 CASE STUDY AT MÄLARENERGI ... 16 4.1 Industrial investigation ... 16 4.1.1 Fuel ... 16 4.2 Simulation ... 17 4.2.1 Boiler simulation ... 18 4.2.1.1. Combustion ... 18 4.2.1.2. Ash removal ... 19
4.2.1.3. Selective non-catalytic reduction (SNCR) ... 19
4.2.2 Wet flue-gas cleaning ... 19
4.2.2.1. Cooling ... 20 4.2.2.2. Quench ... 20 4.2.2.3. Condenser ... 20 4.2.2.4. Without quench ... 20 4.2.3 Validation ... 21 4.2.4 Pollutant removal ... 21 4.2.4.1. Ammonia ... 21 4.2.5 Sensitivity analysis ... 21 5 RESULTS ... 22 5.1 Aspen simulation ... 22 5.1.1 Validation ... 22 5.1.1.1. Flue-gas content ... 22 5.1.1.2. Ammonia consumption ... 22 5.1.1.3. Quench temperature ... 22 5.1.2 Boiler simulation ... 23
5.1.3 Quench and condenser simulation ... 24
5.2 Sensitivity analysis ... 25
5.2.1 Quench flow ... 25
5.2.2 Fuel moisture content ... 26
5.2.3 Discharge to boiler ... 26
5.2.4 Heat load ... 28
5.2.5 Temperature entering quench ... 29
6 DISCUSSION ... 30
6.1 Simulation ... 30
6.2 Nexus perspective ... 30
REFERENCES ... 33
APPENDIX 1: BOILER RESULTS FOR ALL STREAMS APPENDIX 2: QUENCH RESULTS FOR ALL STREAMS
LIST OF FIGURES
Figure 1 Nexus ... 1Figure 2 Wet flue-gas cleaning with quench ... 3
Figure 3 Flue-gas cleaning system example ... 8
Figure 4 Cyclone ... 10
Figure 5 Fabric filters ... 10
Figure 6 Acid flue-gas cleaning with quench ... 11
Figure 7 Plant overview ... 16
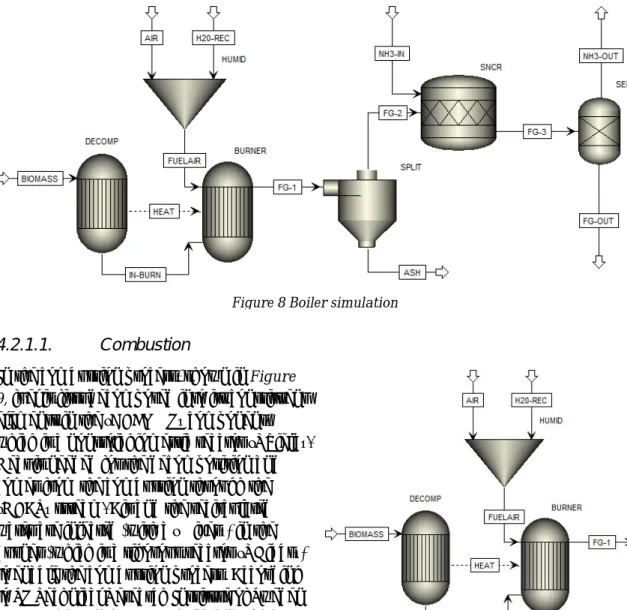
Figure 8 Boiler simulation ... 18
Figure 9 Simulated Combustion ... 18
Figure 10 Simulated ash removal ... 19
Figure 11 Simulated SNCR ... 19
Figure 12 Quench simulation ... 19
Figure 13 Simulated cooling ... 20
Figure 14 Simulated quench ... 20
Figure 15 Simulated condenser ... 20
Figure 16 Boiler simulation 2000 kg/h ... 23
Figure 17 Condenser result without quench ...24
Figure 18 Quench results ...24
Figure 19 Sensitivity for fuel moisture ...26
Figure 20 Sensitivity for discharge to boiler ... 27
Figure 21 Sensitivity analysis heat load (negative flow means the plant consumes water) .... 28
LIST OF TABLES
Table 1 Removal efficiency, (Vehlow & Dalager, 2011) ... 9Table 2 Fuel approximate share of total weight ... 17
Table 4 Fuel sulfur analysis ... 17
Table 5 Validation flue-gas content ... 22
Table 6 Boiler results ... 23
Table 7 Quench-simulation results ... 25
Table 8 Sensitivity analysis quench flow ... 25
Table 9 Sensitivity analysis moisture content ...26
Table 10 Sensitivity analysis discharge to boiler ... 27
Table 11 Sensitivity analysis heat load ... 28
Table 12 Sensitivity analysis quench temperature ...29
DESIGNATIONS
Designations Description Unit
C Concentration g/l
H Enthalpy MJ/kg
M Molecular weight g/mol
Mass flow kg/h P Power MW T Temperature ˚C Volume flow l/h η Efficiency %
ABBREVIATIONS
Abbreviations Description Cond Condenser Comb CombustionCHP Combined heat- and power-plant
Abbreviations Description
Hg Mercury
N Nitrogen
NaOH Sodium hydroxide
NH3 Ammonia
NH4+ Ammonium
NID Novel Integrated Desulfurization
NOx Nitrogen oxides
NO Nitrogen oxide
NO2 Nitrogen dioxide
PAH Polycyclic aromatic hydrocarbon
PCDD/F Polychlorinated dioxins and furans
SNCR Selective non-catalytic reduction
SO2 Sulfur dioxide
DEFINITIONS
Definition Description
Acid scrubber A component in the quench that regulates the acidic of water and water level in the quench.
Discharged water The water sent from the quench to the boiler. Humidifier A component that adds moisture to the flue-gas to
increase the heat generation.
Quench A component that sprays the flue-gas with acid water to clean pollutants. The major parts are a quencher and an acid scrubber.
Quencher The first stage of the quench that sprays the flue-gas with water from the reservoir.
Recirculated
water The condensate water sent to the quench.
Reservoir In this degree project, it refers to the bottom of the quench and the water that is stored there.
Wet flue-gas
cleaning A flue-gas cleaning process that sprays the flue-gas with water, where some pollutants will dissolve into the water, which cleans the flue-gas.
1 INTRODUCTION
This degree project focuses on the flue-gas cleaning process of a waste incineration plant. By using the condenser wastewater in quench, a plant that creates less wastewater and captures more pollutants is sought after. How the discharge of water from quench to boiler will affect the overall performance of the plant will also be studied.
1.1
Background
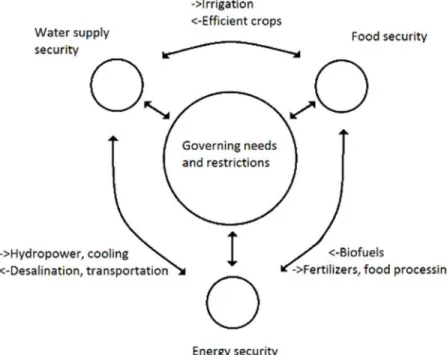
In the world, there is a finite amount of resources and due to growing numbersof people who share these assets, it is necessary to find more efficient ways to handle them. The nexus perspective is an idea that clean water, energy and food all share resources when produced, where production of one will use or limit the others. With a growing scarcity of resources, a balance of what is to produce is needed. A visual representation of how the different productions work together can be seen in Figure 1.
However, the most vital of the three could arguably be clean water, which is hard to produce more than what is naturally available, e.g. desalination plants require high amounts of energy. Food, however, can be produced in various ways, which use different amounts of resources, and energy primarily is for comfort. For a more concrete way to see it: water can be used for making food although food cannot be used for creating water. Instead, food production can be limited or changed to lower the amount of water that is consumed. It is similar with energy, where water is needed for cooling in incineration plants or used in hydro
In the coming future, and already in most places, access to clean water might be limited and many of the current processes for food and energy production uses more water than required. There are also the dangers of climate change, which means that restrictions for emissions will surely be increased in the future. A field that is hit by both factors is the flue-gas condenser for a waste or bio-fuel heat- and power plant, which consumes a lot of water when cleaning its flue-gas and creates pollutants (Smajgl, Ward, & Pluschke, 2016).
Power plant consumes water for cooling and cleaning purposes. The water used for cleaning will also be polluted and require cleaning. The amounts of water the plant consumes is substantial and with water becoming scarcer it is necessary to use less. When burning waste, the flue-gas contain many contaminants. These contaminants partially originate from
unsorted waste, which can contain material that needs to be recycled, that are still present during the incineration, e.g. batteries. It is also due to some organic materials that contain trace elements, mercury (Hg) being one example, which when incinerated is released into the flue-gas. Due to this, cleaning of the flue-gas is vital and it is done in different stages. The first stage is usually to add some reactants to reduce the amount of some pollutants that can otherwise be hard to capture, such as nitrogen oxides (NOx). The gas can then be sent
through filters that can capture larger particles and the product of the preceding stage (Jecha, Bébar, & Stehlík, 2012).
After that, the water can be passed through a condenser that will spray the water with alkali, which will react with some of the pollutants in the water and remove them from the gas. Spraying the flue-gas with alkali is necessary since the flue-gas will have acids left from the combustion, which will react with the alkalis. The condenser will also condense some vapor from the flue-gas which results in generating heat energy. The water that then exits the condenser is polluted and needs to be cleaned (Vehlow & Dalager, 2011).
A more advanced version of this system adds another acid stage before the condenser, called a quench. When the gas passes through the quench it is sprayed with acidic water. The quench will need a constant input of water, since the flue-gas entering will not be saturated hence water is lost into the gas. The water needed to run the quench can be taken from the condenser wastewater. This means that there is less wastewater from the plant overall (Vehlow & Dalager, 2011).
The reason the quench runs with a low pH is that it helps with the capturing of ammonia (NH3), which is the main pollutant the quench captures. Lowering the pH-level of the water is done by adding acid to it, hydrochloric acid (HCl) being one example. The implementation of a quench will follow the idea of the nexus perspective. This since the quench is able to capture more pollutants than a system without a quench by using resources that would otherwise would be considered waste (Alstom, 2013).
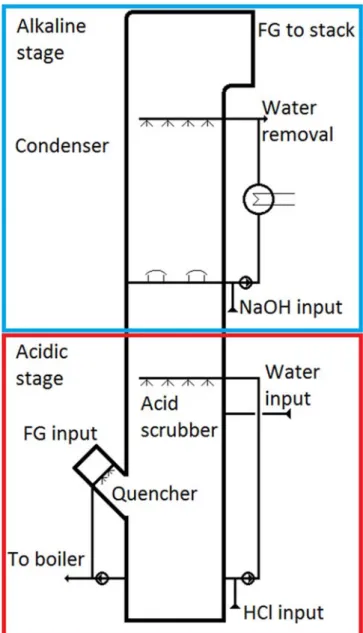
Looking at the components inside the quench the first part the gas passes through is the quencher. The quencher will use the water from the reservoir, which is located that the bottom of the quench, and then sprayed into the flue-gas stream. A picture on how the entire wet flue-gas cleaning (quench and condenser) is shown in Figure 2. As shown, the flue-gas will enter through the bottom left and will then flow upwards, and the water in each stage will
fall down. The flue-gas path between the scrubbers is formed in a way that the condenser water will not fall into the scrubber, as to separate the different water. Part of the flow from the quencher is discharged to the boiler, as to maintain a low concentration of pollutants in the water. Of pollutants that are sent to the boiler, some is combusted and other is captured in the filters. After the quencher, there is an acid scrubber. The scrubber mixes in more acid and adds water to maintain the water level an acidity is the reservoir (Alstom, 2013).
The quench will affect the amount of energy the plant captures; the amount of electricity will remain about the same while the heat generation is lowered. The lower heat generation is due to that the condenser will have a lower inlet temperature. Since the quench will cool the gas, less energy is present in the gas that enters the condenser (Taylor & Francis Group, 2010).
1.1.1 Previous research
By considering the fact that water is vital and tougher regulations will be imposed on the usage of clean water, many companies are pursuing to meet these regulations. Research institutes such as Energiforsk (previously known as Värmeforsk), - the Swedish Energy Research Centre published a report in 2004, on how various procedures can be taken in order to recover water. The use of membrane technology has a great impact to accomplish the goal of replacing the clean tap water, by cleaning the remaining water from the quenching unit and inserting back into the boiler (Axby, Ekengren, & Bjurhem, 2004).
A study on hazardous waste management from incinerations plants, focused on the air pollution standards issued by the Turkish government. By using a mathematical model, the satisfactory air concentration of air pollutants was modelled with integrating Gaussian Plume equation. The goal is to reduce the total cost of the incineration plant while maintaining the pollutions standards. In order to locate new plant installations with consideration to the populated areas. (Emek & Kara, 2007)
By using various types of fuels into the boiler, different amounts of emissions are released. This is due to the nature of the fuel, for instance the usage of contaminated wood chips vs. non/less-contaminated wood chips. Fuels containing chloride compounds affect the acidic concentration of flue-gases; this also leads to different amount of chemical dosing
(Galanopoulos, Yan, Li, & Liu, 2017).
1.1.2 Defining the problem
A condenser in a waste incineration plant will generates large amounts of wastewater, which gets polluted with different chemicals. The wastewater can be used to run a quench, which will lower the amount of wastewater sent to the wastewater treatment plant. As well as additional capturing of some pollutants. The water from the quench is discharged into the boiler and pass the pollutants through the cleaning again. Running a system with a quench needs to be optimized, since many parts (water discharge, concentration and heat loads) of the system needs to balance each other. Due to tougher regulation concerning emissions, this method of lowering the amount of wastewater and pollutant from a plant can be a viable option.
The quench unit will affect the working temperature of the condenser, which will lower the amount of heat that can be generated. Due to that heat production is a major part of the plant it is necessary to understand the influence of quench on heat production.
1.2
Purpose
The purpose of this study is to use fewer resources (water and chemicals) in the wet flue-gas cleaning process of a waste incineration plant. The important factors are the heat production, the pollutants capturing and the amount of wastewater produced. A Swedish power company Vattenfall AB, is interested to retrofit their old plants with a quench unit, which is the motivation of this degree project.
1.3
Research question
The following research questions are the focus of this degree project: How much wastewater be reduced by using a quench? Can a condenser work effectively with quench present?
In which way will the pollutant capturing and pollutant concentration be affected by discharging water to the boiler?
How much water can be discharged from the quench without exceeding the plants limits?
1.4
Delimitations
This degree project is limited to the impacts on the boiler, wet flue-gas cleaning and condenser heat generation of a waste/biomass-fired in a combine heat and power (CHP) plant. Economic aspects have not been considered in this degree project.
2 METHOD
The methods used for this degree project begins with a literature review followed by an industrial investigation. This is to obtain a broader understanding of a wet flue-gas cleaning process and to gather input values. The next step is to develop a model and simulate the plant in Aspen Plus. With the running conditions known, a more detailed calculation was
conducted in Microsoft Excel 2016 for the pollutant capturing.A more detailed description is presented in the following subheadings.
2.1
Literature review
The aim for the literature review was to gather information for how the technologies used in the plant works and how good they can be expected to work currently. As the degree project focuses mainly on the wet scrubber, where information regarding how the discharge of water would affect the plant was a focus. Information regarding the other cleaning parts of the plant were also gathered, to give insight into how the release of contaminated water in the boiler could affected.
The search was done with keywords like “Wet flue-gas cleaning” and “Incineration plants”. For more information regarding specific pollutants that would be recirculated keywords such as e.g. “HCl boiler” were searched. The search engine used was Discovery and access to the description of the flue-gas cleaning process of an actual plant was used to corroborate the data gathered.
2.2
Industrial investigation
A study visit was arranged at Mälarenergi Plant 6 (P6) to further help understand the process, and obtain input data for the simulation. Most of the data obtained are confidential; this leads to an alteration of the actual values presented in this degree project. The values used are mentioned in Chapter 4.1. Part of the data obtained is used for the validation of the simulation. The reason for choosing Mälarenergi P6 is because the quench unit is already has been implemented on the plant.
2.3
Model development and validation
Two models in Aspen Plus version 7.3 were created. Aspen Plus is used since it’s preferable for steady state simulations and has an extensive variety of industrial processes. The first simulation was for the boiler, which was placed before the wet flue-gas cleaning. A mixer that adds the discharge water to the boiler from the quench is present, which is the way the system handles different discharge rates. The Aspen models are used for the calculation of water and energy balance.
With the industrial investigation and values obtained from the plants (with and without quench), a validation of the models was made on the following points,
The amount of ammonia used in the SNCR and The condenser temperature inlet.
2.4
Simulation and sensitivity analysis
In the simulation, the emissions of the fuel were adjusted by changing the fuel composition. The data for the normal composition of the fuel was used in the first simulation to calculate the contents of the flue-gas that entered the quench.
The second simulation was for the wet flue-gas cleaning system, where the alkali part of the condenser was omitted. The flow from the boiler was used, although the composition was simplified to only consist of the major constituents. The flue-gas was then made up of water, nitrogen, oxygen and carbon dioxide. This was done since those make up over 99% of the flue-gas and the interaction of the other relevant constituents are to be calculated in the Excel part. The remaining calculation were done in Microsoft Excel 2016, which allows for greater accuracy and errors, are easier to handle.
The following parameters were chosen to be studied: 1. Ammonia concentration in the quench. 2. Plant Wastewater.
3. Heat duty of the condenser.
Calculation regarding the NH3 concentration in the quench will center depend on the amount of water discharged to the boiler and the NH3 entering the quench. There is an equilibrium when the amount of NH3 absorbed from the gas is the same amount as NH3 sent to the boiler. That concentration will then be the actual concentration of NH3 in the quench. Multiplying the concentration with the discharge flow will give the mass of NH3 lost and the mass that enters is the same.
The amount of wastewater from the plant is calculated by comparing the different water flows in the plant. The amount of water needed is the water recirculating inside the quench and also the water discharged to the boiler. The water supplied come from the water going into the reservoir and the remaining is supplied from the condenser wastewater.
A sensitivity analysis is done for the system, where values that are expected to change, like the moisture content of the fuel and the heat load for the condenser, is simulated. There are also factors like the amount of water sent to the boiler and the flow inside the quench that are uncertain how they will affect the system and these are changed inside their limits to check what effect they have.
The amount of water that would be sent to the boiler and the waste water generated are important factors in this degree project.
3 LITERATURE REVIEW
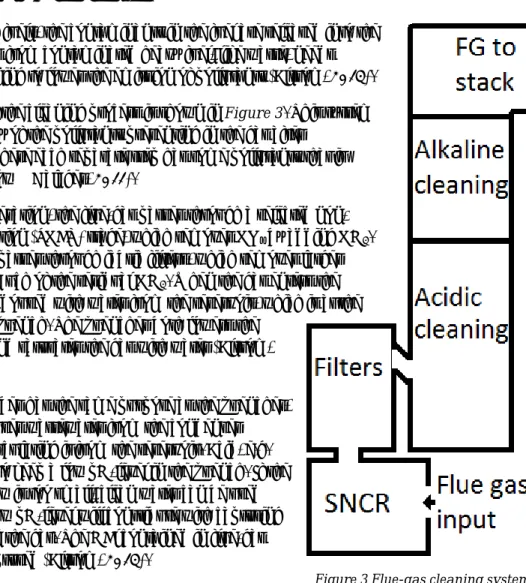
When burning fuels, the contaminants in the fuel are released into the flue-gas. Gases from contaminated heavy fuel, like waste, needs thorough cleaning to lower the emission of pollutants (Alstom, 2013). An example of the cleaning process is shown in Figure 3. This system will clean many of the pollutants presenting in the gas after
combustion, where each separate step has some pollutants that it handles (Vehlow & Dalager, 2011).
After the incineration, the flue-gas passes through a selected non-catalytic reduction (SNCR) stage, which removes NOx by adding NH3. The flow then passes through fabric filters, which removes larger particles and much of the residual NH3. When the gas enters the quencher, it is doused with water from the reservoir, which is at the bottom of the quench. The quencher both lowers the
temperature and saturates the gas with water (Alstom, 2013).
The acid scrubber has the same purpose as the quencher, except that it uses wastewater from the condenser instead of recirculating it from the reservoir. Acid, e.g. HCl, is added to keep a low pH-level in the quench. If the wastewater flow is too small, clean water can be used instead. The low pH-level will contribute with capturing NH3 and Hg in the gas. The HCl contained in flue-gas can also be captured (Alstom, 2013).
The system can also be run without a quench, which means the condenser stage will have much more
pollutants to clean and it will also create more wastewater. With no quench, however, there is no need to cool the gases before the condenser and hence more heat can be produced
(Vehlow & Dalager, 2011).
With or without the quench, the gas enters the alkaline cleaning system and condenser, which main purpose is to recover heat and then release the gas into the stack. The pH-level is restored by adding alkali, e.g. sodium hydroxide (NaOH), which also captures Sulfur oxide (SO2). Some chloride compounds can also be removed since those react with the alkali that was added (Alstom, 2013).
Figure 3 Flue-gas cleaning system example
3.1
Flue-gas cleaning
Flue-gas cleaning consists of two main approaches according to Vehlow & Dalager (2011): 1) Wet flue-gas cleaning, which has up to five different treatment steps.
2) Semi-dry or dry flue-gas cleaning, which has one joint treatment step for the removal of fly ash, metals, acidic gases, etc.
The following subheadings present the removal of different pollutants in details.
3.1.1 Dust removal
The removal of dust varies depending on the approaches, for wet flue-gas cleaning the fly ashes are separated. Fly ashes transmit mostly the heavy metals that are evaporated during the combustion process. It consists of soot, polycyclic aromatic hydrocarbon (PAH) and polychlorinated dioxins and furans (PCDD/F). The size dispersal of the fly ash particles is a major parameter, which is different from plant to plant; this is dependent on the type of boiler, the flue-gas velocity (inside the boiler) and the mode of air supply. It is desirable to have a lower flue-gas velocity that would lead to produce less and smaller fly ash particles. For the semi-dry or dry flue-gas cleaning, it begins by reacting the acidic gases with an alkaline chemical to form solid products; a dust collector accumulates these solid products with the fly ashes (Vehlow & Dalager, 2011).
There are many physical mechanisms that can be applied to extract particles such as; diffusion, inertial impaction and force of gravitation or electrostatic.
However, for waste incineration: cyclones, electrostatic precipitators (ESP), fabric house filters, and venture scrubbers can be used in which some are explained in detail in
subheading 3.1.1.1-3.1.1.3. These all have different removal efficiencies with respect to the particle size, as shown in Table 1.
Table 1 Removal efficiency, (Vehlow & Dalager, 2011)
Particle size in m
Type <2.5 2.5-6 6-10
Cyclone [%] 10 35 50
ESP [%] 95 99 >99.5
Fabric house filter [%] 99 99.5 >99.5
3.1.1.1. Cyclones
For cyclones, gas with high velocity is streamed through a cylindrical chamber which forms into a cyclone (like a
centrifuge) allowing the dust particles to hit with the walls of the chamber and later slide down to the discharge hopper. The clean gas is taken out through a tube on the top of the cylindrical chamber as shown in Figure 4.
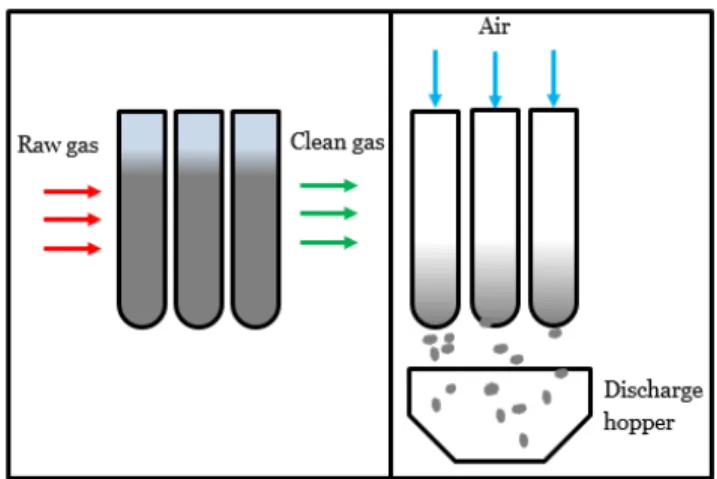
3.1.1.2. Fabric Filters
By using fabric filter to remove dust particles, the raw gas from the boiler passes through the fabric filter bags keeping the dust outside the bags. As the gas is streamed from the outside to the inside of the filter bags which is shown in Figure 5. Later, when clean filter bags are cleaned, an air pulse is injected to remove the dust particles in the opposite direction (inside to outside) to drop the dust particles onto the discharge hopper (Vehlow & Dalager, 2011).
3.1.1.3. Venturi Scrubbers
Water is injected into the flue-gas before a nozzle and when the flow area expands, the water gets atomized and spreads into the gas. The water aerosols weigh down the larger particles and the ash while routing the gas flow upwards in a cyclone. The heavier particles then fall to the bottom and can then be fully removed (Vehlow & Dalager, 2011).
3.1.2 Nitrogen Oxides Reduction
NOx, such as nitrogen oxide (NO) and nitrogen dioxide (NO2), requires an additional flue-gas cleaning step in waste incineration plants to be removed. The NO usually accounts for over 95% of the overall NOx in the flue-gas (Vehlow & Dalager, 2011).
Figure 5 Fabric filters
3.1.2.1. Selected non-catalytic reduction (SNCR)
NH3 or amidogen (NH2) compounds are injected to the furnace to reduce the, NOx into N2; this also leads to the formation of carbon dioxide and water in some cases (United States of America Patentnr US3900554 A, 1975).
Reagents are used to cause the chemical reaction, in this case liquid state of NH3 or urea (CO(NH2)2). Urea usually yields additional NO2 rather than NH3, although urea is less complicated to handle and store (Vehlow & Dalager, 2011). The following chemical reactions are for NH3 and urea respectively.
4 4 → 4 6 1
4 2 → 4 2 4 2
Regarding NH3, according to Zhenzhen & Dezhen (2011), the share of NH3 that needs to be added to the flue-gas should be between 0.9 to 1.5 times the mole of NOx in the gas. The amount of NOx that is cleaned from the gas is 46.7- to 76.7%, depending on the amount of NH3 added.
3.2
Quench
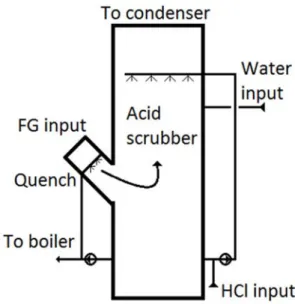
In the quench, shown in Figure 6, water is added to the gas trough sprinklers placed within the gas channels with the purpose to both saturate the entire gas flow with water and lower its temperature. Saturating the gas is necessary since otherwise no pollutants can be captured by the water in the quench. Decreasing the temperature is needed since some parts in and after the quench are made of plastic, which can melt in high
temperatures (Vehlow & Dalager, 2011). After the gas passes the quencher, it flows through the acid scrubber. The water from both parts will fall down into the same reservoir (Alstom, 2013).
The water that is added in the scrubber serves the same purpose as that added in the
quencher. However, the water used in the scrubber is taken from the condenser wastewater. The wastewater is first treated with acid to adjust the overall pH-level in the reservoir. The scrubber is run with a low pH since it is necessary to capture the pollutants. However, the acidity will slow neutralize, since some HCl will dissolve into the vapor in the flue-gas and go into the condenser. This means more acid needs to be added to keep the pH low. The water
There are three main pollutants that can be removed in the quench; which are HCl, Hg and NH3. There is some HCl present in the gas after the combustion, this will react with the other pollutants in the quench but to fully react more HCl is needed. Hg can react with the HCl and form a heavy compound, which dissolves into the water instead of the gas. NH3 is removed by reacting with the acid and creating a salt and require the gas to have a pH-value lower than 2 to be cleaned out properly (Vehlow & Dalager, 2011).
3.2.1 Hydrochloric acid
The flue-gas contains some HCl from combusting of the fuel. HCl can dissolve into water. Depending on the length of the scrubber, a pH-value of around 2 is sufficient to dissolve most of the HCl in the gas into the water. The formula for the dissolution of HCl in water is as follows according to Vehlow & Dalager (2011):
⇌ 3
3.2.2 Ammonia
NH3 is present in the gas from the SNCR-stage. The extraction of NH3 from the gas occurs in two stages. First the ammonia solves into the water, where it reacts with H+ ion (present in the water from the dissolved HCl) and creates ammonium (NH4+). The formulas for the reactions are:
⇌ ⇌ 4
The N molecules can be sent to the boiler, in which it can be combusted and there’s no need further cleaning (Lahav, o.a., 2008). The capture efficiency of a scrubber running with a pH lower than 2 and an inlet concentrations of NH3 lower than 200 ppm would, according to Lahav, et al. (2008), capture most of it. The results for the amount captured of the 200 ppm inlet shows at most 2.5 ppm is present in the outlet gas, which is about 1% of the inlet. This mean that the amount captured is about 99%.
3.2.3 Mercury
Hg is present in the flue-gas due to that the fuel will contain some of it, which is released in the boiler. Some of the Hg can be captured in the dry flue-gas cleaning although there is still a noticeable amount left. Hg in the gas can be reduced by letting it react with chlorides and the product can then dissolve in the water. Chlorine is present in the flue-gas due to ionizing when the HCl dissolves. The reaction with Cl works regardless of what species the Hg is and almost all of mercury in the gas react and consequently dissolve. The reaction between Hg and chlorine is as follows according to Vehlow & Dalager (2011):
3.3
Without quench
The wet scrubber can be run without a quench, in that case the alkaline scrubber can do a more thorough cleaning of the flue-gas. Without a quench, the flue-gas is fed into the
condenser right after the other cleaning system, which means the temperature of the flue-gas is higher and hence the energy generation too. The system creates a substantial amount of wastewater, the high energy content in the gas means that the condenser can condense more water from the gas compared to a system run with a quench. (Vehlow & Dalager, 2011).
3.4
Condenser
By condensing the water in flue-gases, energy can be recovered for district/local heating systems and in order to improve the efficiency a heat pump can be installed (Babcock & Wilcox Vølund AB, 2017). The purpose of a condenser is not only to recover energy from the waste incineration plant. The condenser also removes the remaining sulfur oxide (SO2) from the flue-gas. The use of sodium hydroxide can be used for removing chlorides (Alstom, 2013). After the flue-gas passes through the scrubber, a fluid bed maintains the fluid from returning to the scrubber. This fluid is injected into the circulation tank, which is then sent to the district heating system to recover energy. Later the fluid is distributed back to the condensing scrubber and to process water for the Novel Integrated Desulfurization-system (NID-system). The excess water would be sent to water treatment plant through a buffer tank (Alstom, 2013).
3.4.1 Alkaline scrubbing
The first step is to remove the sulfur oxide, which is absorbed in the liquid. The ions are separated in the following reaction:
⇌
⇌ 6
Which leads to
⇌ 2 7
The pH-value is maintained between 5-6, by injecting Sodium hydroxide (NaOH), Calcium carbonate (CaCO3) and Calcium hydroxide (Ca(OH)2) (Vehlow & Dalager, 2011). Depending on which neutralization agent used, the following reactions are obtained.
NaOH 1 2 2 ⇌ 8 CaCO3 1 2 2 ⇌ 2 9
Calcium carbonate and calcium hydroxide are desirable since they are more economical than sodium hydroxide and the building of gypsum (CaSO42H2O) can be easily removed. Although gypsum may also be built in the wastewater treatment by ions of calcium, while using Sodium hydroxide as neutralization agent. Vacuum belt filter can be used to dewater the gypsum.
3.5
Environmental emissions
For the past 35 years, environmental impacts from air emissions have been reduced as technologies have been improved. The combination of heat and electrical recovery systems have also been implemented. This is parallel to the introduction of the Danish Environmental Protection Law planned in 1973, later resulting executive orders and going forward. Stricter laws are being issued to reduce the air emissions from waste incineration plants. This enabled a trend for neighboring countries to follow, which lead to the EU waste incineration directive in year 2000 (Damgaard, Riber, Fruergaard, Hulgaard, & Christensen, 2010).
The same approach is followed for the reduction of clean water used in plants, water is used for cooling and a great portion is needed. Although it depends on the cooling system used, having a “wet cooling tower” or “once-through” this also depends on where the plant is situated. Usually, the water and energy sectors have been managed and regulated
independently, leading to an unbalance between the two. The usage of wastewater for cooling has significant advantage since wastewater is available in almost every countries’ large cities (Rodriguez, Delgado, DeLaquil, & Sohns, 2013).
Another aspect would be to integrate the consumption of resources (chemicals, fuel, etc.) and their environmental impact, such as solid residue generation, to the flue-gas treatment processes. This also leads to consider the cost of the new treatment packages (Vehlow & Dalager, 2011).
Pollutants such as SO2, NOx and acids contribute to the formation of acid rain, which threatens the environment according to Maryland Department of the Environment (2016). NH3 is harmless in low concentrations as it is recycled naturally in the environment. Meanwhile in higher concentrations NH3 gas has respiratory effects (pain, tracheal burns, etc.) affecting both humans and animals exposed to it, according to Agency for Toxic Substances and Disease Registry (2004).
A study on how acidification affects the forest ecosystem was conducted by Swedish Energy Ashes (Svenska energiaskor AB). According to Swedish Energy Ashes, acidification of water by acidic rain directly threatens plants, and living organisms, and further on, this is due to the lower pH-levels and increase on aluminum and cadmium levels presented in water which are harmful. The same theory applies to forest land, as the water is contaminated, the soil affects the trees growth (Svenska energiaskor AB, 2006).
Hazardous elements such as Hg have major environmental impacts, once released into the atmosphere, as it cycles in the environment (atmosphere, land and water). This leads the Hg to be spread widely, affecting different eco-systems. Fishes, birds and mammals are
endangered due to effects such as decrease in reproduction and death among others. High levels of Hg can affect brain tissues as well (EPA, 1997). Wastewater from industrial plants
needs to be treated, prior to being released into the recipient. This is due to the contaminants in the wastewater that are harmful to the aquatic ecosystem, and humans (Sindt, 2016). Ashes (fly ash and bottom ash) are one of the residues produced in waste incineration plant (Petrlik, Anthony Ryder, Schoevers, & Havel, 2005). Ashes usually contain high levels of heavy metals that have environmental and health impacts once released. Heavy metals can be dissolved into soil and contaminate the groundwater (Karlfeldt Fedje, 2010). Although a study in India presented a solution for disposal of fly ash, where it was shown that fly ash can be used in building materials. For example, bricks, doorframes, etc. can be produced cost-efficiently. This paves the way for fly ash to be considered as a resource instead of waste (Nawaz, 2013).
4 CASE STUDY AT MÄLARENERGI
With data gathered from Mälarenergi Plant 6 and the theoretical frame from the literature review, the performance of the plant and the pollutants that are emitted can be modelled. The simulation is used to find the amount of water that can be recirculated while still capturing a sufficient portion of the pollutants.
4.1
Industrial investigation
An industrial investigation was carried out by visiting the Plant 6, a 167 MW waste
incineration heat and power plant owned by Mälarenergi, which is a Swedish company that produces electricity and heat. It is located in Västerås, Sweden, and has a capacity to burn 480 tons of waste per year. An overall view of the relevant parts of the plant is shown in Figure 7, where FGC stands for flue-gas condenser (Mälarenergi AB, 2017).
4.1.1 Fuel
By using values obtained from Mälarenergi about the fuel, average values are calculated. The fuel analysis is divided into three parts.
The first part is the proximate analysis, shown in Table 2, which displays the weight share of the fuel of moisture, the fixed carbon, the volatile mass and the ash. Moisture describes how much water the fuel contains. Fixed carbon is a value to show how much carbon that is present in the fuel. Volatile matter expresses the amount of organic material that is released during the combustion. Ash is the amount of residue that is left after combustion. The volatile mass was assumed at 35% by comparing with a similar fuel.
Table 2 Fuel approximate share of total weight
Approximate share of total weight Values [%]
Moisture 35
Fixed carbon 45
Volatile matter 35
Ash 20 Another analysis is the ultimate share of the total dry weight, shown in Table 3. In this
analysis, the fuel is broken down into the share of the mass that different atoms make out. Ash again is the amount of residue that cannot be combusted.
Table 3 Fuel ultimate share of total weight
Ultimate share of total dry weight Values [%]
Ash 20 Carbon 48.7 Hydrogen 6 Nitrogen 1 Chlorine 1 Sulfur 0.3 Oxygen 23
In Table 4, the sulfur present in the fuel is stated, where the pyritic is the mineral iron disulfide (FeS2), sulfate (SO4) and organic sulfur is the complex mixture of organosulfur compounds. This ratio is obtained by the Aspen Plus guide “Modelling Processes with Solids” (Aspen tech, 2006).
Table 4 Fuel sulfur analysis
Sulfur analysis Values [%]
Pyritic 0.135
Sulfate 0.03 Organic 0.135
The combustion energy (HComb) for the fuel is calculated according to what is defined in Aspen tech (2006). The following formula is used:
100
100 11
Where LHV is the lower heating value of the fuel, which is at 12 MJ/kg and moisture, is the share of moisture in the fuel, same as in Table 2.
Peng-Robinson equation of state, which is a way to calculate the temperatures and pressures of mixed gases and liquids.
Using the values from the different simulations, calculations in Excel can be made to find the NH3 concentration in the reservoir.
4.2.1 Boiler simulation
With the fuel contents known, a simulation in Aspen Plus can be made that will calculate the contents of the flue-gas and the running condition of the SNCR. The whole boiler simulation is shown in Figure 8.
4.2.1.1. Combustion
In the combustion process, shown in Figure 9, fuel is first decomposed into its constituent elements in the “DECOMP” component, which is a nonstoichiometric reactor “RYield”. Heat is needed for the decomposition and comes from the combustion through the “HEAT” stream. Air and the recirculated water are injected (with a “Mixer”) in the burner (which is a rigorous reactor “RGibbs”) to enable the combustion process. According to SP Technical Research Institute of Sweden (2016), the stream “FG-1” is limited to be above 1100 °C.
Figure 9 Simulated Combustion Figure 8 Boiler simulation
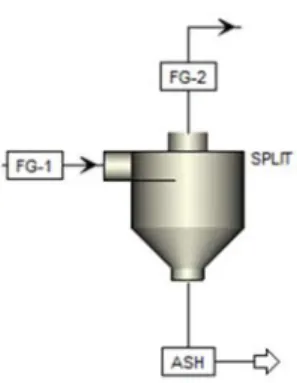
4.2.1.2. Ash removal
The ash removal step consists of a splitter, a sub stream splitter called “SSplit”. This removes the ash and the unburnt fuel from the flue-gas. The flue-gas then continues towards the SNCR while the ash-flow exits the splitter, which is shown in Figure 10.
4.2.1.3. Selective non-catalytic reduction (SNCR)
The SNCR component, which is a
stoichiometric reactor “RStoic”, removes NOx from the gas, in accordance to the formulas mentioned in Chapter 3.1.2.1. It is set-up in the simulation as shown in Figure 11.
In the SNCR, NH3 reacts with the NO and NO2 in the flue-gas. The amount of NH3 that is added is 1.3 times of the NOx and 75% of the NOx will react, according to Chapter 3.1.2.1. After the SNCR, 80% of the unreacted NH3 is removed in a component separator “Sep” and will not pass through the wet flue-gas cleaning.
4.2.2 Wet flue-gas cleaning
Since the different shares of pollutants contained in the flue-gas have already been calculated, these values can be used in another simulation for the quench. In the quench simulation, the aim is to calculate the water flows that are needed to reach the desired temperatures and due to this, the contents of the flue-gas can be simplified. The set-up of the simulation is shown in Figure 12. The contents that is used for the calculations are water, nitrogen, oxygen and carbon
Figure 10 Simulated ash removal
dioxide since they make up above 99% of the flue-gas. The plant will have other dry-cleaning steps which will change the temperature of the gas and these are simplified by decreasing the incoming temperature to 1500C. An example of the omitted dry-cleaning steps is the de-SOx.
4.2.2.1. Cooling
The flue-gas from the combustion is cooled, as it would when passing through the omitted dry-cleaning
processes. The component, which is a thermal and phase state changer “heater”, is shown in Figure 13. This leads to the flue-gas to be cooled down to 150 °C.
4.2.2.2. Quench
In the quench process “mixer”, shown in Figure 14, water is injected into the flue-gas to capture pollutants that are not removed by the house bag filters. Next, the separator “two-outlet flash” separates the flue-gas (which streams through the condenser) and contaminated water, this water is recirculated to the quench and cooling. According to Alstom (2013), the stream “FG-3” is limited to be below 70 °C.
4.2.2.3. Condenser
The condenser is composed of two components, which is shown in Figure 15. The first
component is a thermal and phase state changer “heater” that condenses the water in the flue-gas. The heat generated is then sent to the district heating grid, which has a pinch
temperature of 5°C. The water in the flue-gas is thereafter separated (with a “two-outlet flash”)
and the flue-gas is cooled before being released in the stack. The water that will condense in the stack is also captured and both of these water flows are mixed and become the waste water flow.
4.2.2.4. Without quench
The simulation without the quench is a simpler version of the quench simulation. The only parts present are the condenser and the separator, as they are shown in Figure 15. The system will still add water in the boiler, to increase heat duty in condenser. This is done by a humidifier and when water is added into the boiler it will lower the temperature of the flue-gas exiting. There is a lower limit for the temperature exiting which will limit the amount of
Figure 14 Simulated quench
Figure 15 Simulated condenser Figure 13 Simulated cooling
water that can be added. In the reference case the amount of water added will give a temperature slightly above the lower limit.
4.2.3 Validation
The validation of the boiler simulation consists of comparing the content of the flue-gas after the combustion to real values obtained by Vattenfall AB. The ammonia consumption in the SNCR for cleaning the NOx will also be compared with Mälarenergi P6. This shows that the combustion is proper and the ammonia slip into the quench is correct. Values for the quench temperature were known, which means that the condenser heat duty can be validated.
4.2.4 Pollutant removal
Both the amount of pollutants in the flue-gas and the water discharge rates have been calculated, additional calculations regarding the pollutants that are captured in the water flow can be made. These are done in Microsoft Excel. Excel is used since more accurate calculations for values that have already calculated input values.
4.2.4.1. Ammonia
Some ammonia is present in the flue-gas after the SNCR, and is accumulated in the wet scrubber (reservoir). The quench efficiency is assumed to be 99%, according to Chapter 3.2.2. The concentration of ammonia in the reservoir is calculated by using the following formula
1000 12
Where is the mass flow of ammonia/ discharge rate, M is the molecular weight, is the ammonia capture efficiency.
4.2.5 Sensitivity analysis
As mentioned in the method, some key parameters are studied in order to understand their affect the overall system. This is done by changing the input values accordingly to the system limits, such as for the discharge rate, the quench temperature shall not exceed 70˚C.
Different discharge rates were simulated to see the effect it had on the parameters mentioned earlier. While also changing the moisture content of the fuel input to see how it impacts the system. The moisture content is a major part since the contents of the fuel used can vary a lot. The quench recirculation flow is necessary to show that the chosen value is correct and enough to saturate the flow and capture pollutants from it. Finally, the heat load for the condenser is something that varies over the year; during winters when the heat demand is
5 RESULTS
The results for the simulation and sensitivity analysis are shown in this chapter.
5.1
Aspen simulation
For the simulation results the validation are shown first, to validate that the simulations are reliable. After that the results for the boiler followed by the quench are shown. Finally, the results from the excel calculations of the results are shown. For the reference case calculated 2,000 kg/h water was discharged to the boiler and 10,000 kg/h fuel was added to the boiler.
5.1.1 Validation
In general, the validation showed that the results from the simulation were within reasonable margins.
5.1.1.1. Flue-gas content
The flue-gas content leaving the boiler is simulated and compared with the values obtained by Vattenfall AB. The results for the comparison are presented in Table 5.
Table 5 Validation flue-gas content
Humidifier present H2O N2 O2 CO2 Residuals
Reference (Vattenfall) 22.08% 62.07% 3.10% 12.56% 0.19% Simulated 23.14% 62.33% 2.01% 12.21% 0.31% No humidifier H2O N2 O2 CO2 Residuals Reference (Vattenfall) 17% 66.11% 3.301% 13.377% 0.212% Simulated 18.96% 65.85% 2.07% 12.92% 0.20% 5.1.1.2. Ammonia consumption
The amount of ammonia used to clean the flue-gas is important, since it shows that the usage of ammonia in the simulation is correct. The value of ammonia used for a real plant is compared to the simulated values. The results from the validation showed that the simulation needed 14.27 kg NH3/hour while the plant needed about 14.6 kg NH3/hour. The percentage difference between the two values is 2.3%. This meant that the amount of NOx in the gas was proper, and the assumptions done regarding the NH3 added in the SNCR is acceptable.
5.1.1.3. Quench temperature
The condenser temperature from the real plant is never higher than 65°C, while the value from the simulation was 69.5°C. This is due to the losses in the system are not considered, instead the condenser heat duty can be assumed to be lowered by these losses.
Regarding the quench temperature, there was a big difference. This is explained by that the losses were omitted. These losses occur in the last parts of the system which means the only main value that would be affected would be the heat generation.
5.1.2 Boiler simulation
A completed run for the boiler simulation with 2000 kg/h recirculated water is shown in Figure 16. The results regarding all steams are shown Appendix 1.
Another simulation was also made, where the “H2O-REC” was set to 5000 kg/s, which corresponds to a plant without a quench. The results from these two simulations are shown in Table 6, where the values other than “T after comb” are taken from the stream “FG-OUT”. The table shows that when water is recirculated the combustion temperature is lowered, this due to that the vaporization of the water consumes energy.
Table 6 Boiler results
System T after Comb [C] H20 [kg/h] O2 [kg/h] N2 [kg/h] NH3 [kg/h] No quench 1,104 11,977 1,500 37,663 2.937 Quench 1,266 8,988 1,387 37,663 2.937 System NO [kg/h] HCL [kg/h] CO2 [kg/h] NO2 [kg/h] No quench 11.81 66.85 11,599 0.01845 Quench 11.81 66.85 11,599 0.01845
the same, e.g. the NOx and the CO2. This is due to adding water in the combustion will not affect the combustion process itself much, other than consuming some of the energy. This also means the SNCR will use the same amount of NH3 and the slip should be the same.
5.1.3 Quench and condenser simulation
The result for the quench simulation from a run without a quench is shown in Figure 17 and the run with a quench at 2000 kg/h discharge to the boiler is show in Figure 18. The results regarding all steams for the quench simulation are shown in Appendix 2.
Figure 17 Condenser result without quench
The results of quench and flue gas condensation are shown in Table 7. The results regarding the “Plant wastewater” are the amount of water sent off for cleaning. The plant with the quench will have a lower amount since much of the water is used to run the quench.
Table 7 Quench-simulation results
System Heat duty [MW] Plant wastewater [kg/h] C NH3 [g/l]
No quench 7.65 8352 -
Quench 5.96 3864 0.085
As shown in Table 7 , the heat duty is lower when the quench is included. The heat duty is lower since there is less water present in the gas that enters the condenser and the
temperature is lower. This is due to the quench system is unable to add as much water to the flue-gas. This is since the temperature in the quench limits the system and it increases when more water is discharged to the boiler.
5.2
Sensitivity analysis
With results for the chosen cases done, a sensitivity analysis of some key parameters is done. This will find how they will affect the system and give an understanding what the optimal settings could be. The values that are tested and their relevance are brought up in Chapter 4.2.5.
5.2.1 Quench flow
The amount of water that is sent through the quench is shown as the flow of stream “H2O-QI” in Figure 17. A value of 6000 kg/h was used for the simulation; this value was varied to see the effect it would have on the system. The results from the different runs are shown in Table 8 (where the bold mass flow is the one used in the reference case).
Table 8 Sensitivity analysis quench flow
Quench mass
flow [kg/h] T quench water [°C] T in cond [°C] Cond heat [MW] Plant wastewater [kg/h] C [g/l]NH3
3000 51.6 69.9 5.98 3,863 0.085
6000 58.5 69.8 5.96 3,864 0.085
9000 61.6 69.8 5.96 3,866 0.085
As shown in Table 8, changing the flow rate in the quench will have no major impact on the heat duty, plant wastewater or the NH3 concentration. The lower discharge rate has a better heat duty and wastewater generation; however, the changes were small (below 0.5%). For a real system, a pump would be used for the flow. This means for an optimal system the flow should be as low as possible, since it would lower the pumping energy cost. However, there’s
5.2.2 Fuel moisture content
Another parameter for the sensitivity analysis was the moisture content of fuel. When the moisture content was changed, the combustion energy was recalculated and the fuel mass flow was adjusted to the same amount of dry fuel was sent, to give results that are more comparable. The results of the analysis are shown in Table 9 (where the bold moisture content is the one used in the reference case) and a visual representation of the important values are shown in Figure 19. When the fuel contains more moisture, the system will essentially act the same way it would when more water is recirculated from the quench, except for the plant wastewater. When the flue-gas contains less moisture, more water is evaporated in the quench. Hence, more of the condenser wastewater is needed in the quench.
Table 9 Sensitivity analysis moisture content
Moisture
content Heat duty [MW] T after comb [C] T in cond [°C] Plant wastewater [kg/h] C [g/l]NH3
30% 5.42 1311.3 68.7 3,158 0.085
35% 5.84 1266.0 69.6 3,868 0.085
40% 6.55 1214.5 70.9 4,652 0.085
5.2.3 Discharge to boiler
The amount of water sent to the boiler is adjusted. The values were varied within the given limits. This gave that the highest amount of water that could be recirculated at full heat load was 2,500 kg/h. Results for each flowrate with a 500 kg/h interval was made to see how the system would change. The results for the analysis are summarized in Table 10 (where the
bold row is the results from the reference case) and the results for the heat load and the
concentration of NH3 in the quench are shown in Figure 20. The change of plant wastewater
3000 3200 3400 3600 3800 4000 4200 4400 4600 4800 5 5.2 5.4 5.6 5.8 6 6.2 6.4 6.6 6.8 30% 35% 40% Wastewater [kg/h] Heat dut y [MW] Moisture content
Fuel moisture sensitivity analysis
Heat duty [MW] Wastewater [kg/h]between the different runs can be assumed as constant, since the change is small (below 2% for largest and smallest flow).
Table 10 Sensitivity analysis discharge to boiler
Discharge rates [kg/h] T in cond [C] Heat duty [MW] Plant wastewater [kg/h] C NH3 [g/l] T after combustion [C] 0 150 9.72 10,887 - 1,390 500 67,5 4.85 3,871 0.341 1,359 1,000 68,3 5.18 3,865 0.171 1,328 1,500 69,1 5.56 3,860 0.114 1,298 2,000 69,8 5.95 3,865 0.085 1,266 2,500 70,5 6.33 3,870 0.068 1,238
Figure 20 Sensitivity for discharge to boiler
As shown, more discharged water will both increase the heat generation and lower the concentration in the quench, which both are desired effect. The temperature after the
combustion is lower when more water is discharged, and the temperature for the biggest case is slightly above the limit.
The heat duty is higher when more water is discharged since then more water is present in the flue-gas when it enters the quench. The gas is then cooled by quench water evaporating and when more water is already present in the gas less water can evaporate. This
consequentially leads to a higher condenser inlet temperature and a higher heat duty. The reason behind the decrease of NH3 concentration is when more water is discharged, it brings more NH3 with it while the incoming flow is constant. This means that the equilibrium point of NH3 entering and leaving the quench is lowered. However, even at the lower
discharge rates the concentration is much lower than the saturation point of NH3 in water.
0 1 2 3 4 5 6 7 0 0.05 0.1 0.15 0.2 0.25 0.3 0.35 0.4 500 1000 1500 2000 2500 [MW] [g /l ] Discharge [kg/h]
Different discharge rates
C NH3 [g/l] Heat duty [MW]That means the capture rates should not be affected by the different concentrations and the capturing can be assumed as constant depending on the discharge flow.
Since the system was better when more water was discharged, a conclusion that as much water a possible should be discharged, as long as it is within the limits. However, this was with the assumption that the heat load was at 100%, which is not always the case. The next heading considers the change of heat load.
5.2.4 Heat load
For the sensitivity analysis for different heat loads, the system was adjusted to make the heat generated be 75, 50 and 25 % of the heat load it had in the reference case. When the plant has an insufficient heat load on the condenser, less water is condensed and there is less
wastewater to use in the quench. As there is too little wastewater, the plant wastewater flow is negative, which means that the plant uses clean water to run the quench properly. When clean water is used the plant will consume more water, which is counterproductive to the idea of the quench. The results from the analysis of the heat load are shown in Table 11 and a visual representation is shown in Figure 21.
Table 11 Sensitivity analysis heat load
DH-flow load Heat duty
[MW] T in cond [C] T out cond [C] Plant wastewater [kg/h]
25% 1.49 70.0 66.4 -2150
50% 2.98 69.9 62.0 -69
75% 4.47 69.9 56.3 1949
100% 5.96 69.8 48.0 3864
As shown in Figure 21, at the lower load the plant would use a large amount of clean water. However, if the discharge flow is lowered, the heat in the flue-gas will decrease and the condenser can run at a lower load and still produce enough wastewater.
‐3000 ‐2000 ‐1000 0 1000 2000 3000 4000 5000 100% 75% 50% 25% 0 1 2 3 4 5 6 7 [kg/h] District heating load [MW ]
Sensitivty analysis different heatloads
Heat duty [MW] Wastewater [kg/h]For the quench to have the desired result (to use fewer resources). The plant should not be run a way that it consumes clean water. Clean water is one of the resources that need to be conserved, and using more is counter-productive.
5.2.5 Temperature entering quench
By changing the temperature of the flue-gas entering the quench the outlet temperature will consequentially also change. Different temperature for the inlet flow were used which is adjusted for an equal change in the outlet temperature. The two cases that were tested had outlet temperatures 1 0C higher or lower than the standard case.
Table 12 Sensitivity analysis quench temperature
Temp in
quench [C] T quench water [C] T in cond [C] Heat duty [MW]
124.95 59.76 68.83 5.48
150 58.52 69.83 5.96
176.7 56.95 70.83 6.49
As shown in Table 12, the plant can produce more energy when the temperature entering the quench is higher. However, using a higher inlet temperature would require changes to the preceding systems and the higher temperature would also be above the limit for the quench.
6 DISCUSSION
In the following subheadings, different aspects that could have been expanded in the report is brought up.
6.1
Simulation
The losses inside the quench were omitted, this made the heat duty in the quench not comparable to a real plant. If more measurements from the real plant were done, the losses could have been simulated and validated. This would primarily affect the heat duty from the system and make it more accurate. It could also affect the wastewater generated, since the heat in the quench could be exponentially affected by the changes. Hence, the wastewater generation would be dependent on the discharge water and an optimal value could be found. The addition of losses in the quench would not affect the boiler simulation, since the temperature of the discharged water has a very small impact on the system.
The simulations could be extended to cover the amount of mercury from the combustion, which is another pollutant the quench captures. The amount of mercury from the combustion would, however, be very small (a few ppm) and is challenging to model, which was also the reason it was omitted. The dry-cleaning system in the simulation would also need to be expanded, since it is in those stages the mercury is removed from the gas.
6.2
Nexus perspective
The process without a quench generates more wastewater, over double the amount as shown in Table 7. This shows that the plant uses more water than required and lower the water usage could be pertinent when water becomes scarcer.
Right now, in Sweden, where the plant is located, water is not scarce and is relatively cheap. This can come to change in the future, since many of the minor lakes in Sweden are
vulnerable to acidification. If this is not prevented it could lower the available fresh water. In that case, water would rise in price and system like the quench, which lowers the wastewater of a plant, would become more viable.
6.3
Sensitivity analysis
As shown in Table 8, changing the flow rate in the quench will have no major impact on the system. The heat duty, plant wastewater and the NH3 concentration values are about the same. In a real system, a pump needs to maintain the flowrate, which consumes energy. To optimize that energy, enough water to saturate the gas and enough extra water to dissolve the pollutants in the gas should be added.
The excess water recirculated (over 6,000 kg/h) in the quench would be extra resources used with no gain. The value for the concentration is also shown not have changed; this is not unexpected since more recirculation in the quench still means the pollutants are


![Table 4 Fuel sulfur analysis Sulfur analysis Values [%]](https://thumb-eu.123doks.com/thumbv2/5dokorg/4438817.107473/27.918.260.660.355.505/table-fuel-sulfur-analysis-sulfur-analysis-values.webp)