Crossing Øresund
-A case study of price discrimination on Øresund Bridge
Bachelor’s thesis within Economics
Author: Senija Delalic 870429
Tutor: Johan Eklund
Andreas Högberg Jönköping February, 2011
Bachelor’s Thesis in Economics
Title: Crossing Øresund – A case study of price discrimination on Øresund Bridge
Author: Senija Delalic
Tutor: Johan Eklund & Andreas Högberg
Date: 2011-02-07
Subject terms: Price discrimination, Monopolistic competition, Oligopolistic competition
JEL Classifications: L11, L13, D46
Abstract
The purpose of this thesis is to investigate the competition structure in the market for crossing Øresund and which price setting techniques are used.
The results show that the market for crossing Øresund Bridge is monopolistically com-petitive market. While Øresund Bridge can in some cases be seen as a monopoly. Fur-thermore the results show how the firms that are operating in the market offer their con-sumers various pricing schedules to self-select from. The results based upon the infor-mation collected found that Øresund Bridge uses price discriminatory pricing schedules such as two-part tariff, quantity discount and peak-load pricing. According to the theory of price discrimination the firm needs to have market power in order to price discrimi-nate and it is found that Øresund Bridge have a market share of 76%.
The negative consequences of price discrimination in the particular market can mostly be seen in the ferry market where the two largest firms have to start collaborating in or-der to sustain as a part of the market. The positive consequences is found to be that a wider range of consumer groups are able to travel over Øresund due to the extensive range of different prices offered by the market operators.
Table of Contents
1
Introduction ... 2
1.1 Øresund Bridge background ... 2
1.2 Purpose and limitations ... 3
1.3 Previous research ... 4
1.4 Outline ... 5
2
Theoretical framework ... 6
2.1 Market structures ... 6
2.2 Price discrimination ... 9
2.3 Two-part tariff, Quantity discount and Peak-load pricing ... 12
2.4 Price-cost margin ... 13
3
Results ... 14
3.1 Passenger car prices ... 14
3.2 Train ticket prices ... 15
3.3 Ferry prices ... 16
3.4 Result summary ... 17
3.5 Marginal cost for a one way trip over Øresund Bridge ... 19
3.6 Approximate price-cost margin ... 20
4
Discussion ... 22
5
Conclusions ... 25
List of references ... 26
Appendix 1 ... 29
Figures
Figure 1 Øresund traffic ... 3Figure 2 Øresund Bridge traffic ... 4
Figure 3 Monopoly ... 7
Figure 4 Monopolistic competition ... 8
Figure 5 First-degree price discrimination ... 10
Figure 6 Second-degree price discrimination ... 11
Figure 7 Market structure depending on distance and frequency ... 24
Tables
Table 1 Passenger car prices in SEK ... 14Table 2 Train ticket prices in SEK ... 15
Table 3 Ferry prices in SEK for passengers with car ... 16
Table 4 Ferry prices in SEK for passengers on foot ... 17
Table 5 One way trip ... 17
Table 6 One day trip including a return ticket ... 18
Table 7 Weekend trip including return ticket ... 18
Table 8 Commuting ... 19
Table 9 Amount of passages over Øresund Bridge in the past two years .... 19
1
Introduction
Only 20 years ago Øresund Bridge was seen as a dream, which would integrate the Øre-sund region. It is now more than 10 years since the finalization and still ØreØre-sund Bridge is a topic for discussion in the society where there are divided thoughts whether the dream has come true or not (SEB, 2010). Each year since the finalization of Øresund Bridge the traffic on the bridge has increased, while at the same time the average price per trip has decreased from 167 DKK (2001) to 145 DKK (2009). The decrease in the average price per trip can be derived from the fact that new agreement options have arise during the past ten years. At the same time the price of a one way trip over the bridge have increased from 255 SEK (2000) to 375 SEK (2010), (Annual report, Øre-sund Bridge, 2004; Annual report, ØreØre-sund Bridge, 2009). Since there is a constant de-velopment in the region of Øresund it is interesting to investigate the actual market structure and price setting technique on Øresund Bridge.
In order to complete this investigation about the market structure in the region and price setting techniques, theories of market structures and price discrimination are studied and compared to the results found. The main theory applied on this thesis is price discrimi-nation; this theory is chosen because there has not yet been any report written to my knowledge about price discrimination on Øresund Bridge.
1.1
Øresund Bridge background
Øresund Bridge is a bridge that connects Sweden and Denmark and is the primary daily connection used for travelling over Øresund (Annual report, Øresund Bridge, 2009). The bridge consists of a double-tracked railway and a motorway. Since the building was finalized in year 2000 it is said that the bridge has resulted in a positive spillover for the region of Skåne and a great increase in integration has been seen. This is mostly due to the less expensive living possibilities in Sweden when comparing to Denmark, where people from Denmark have moved to Skåne while they are continuing to work in Den-mark (Region Skåne, 2009). Malmö city has become more attractive for companies, where approximately 25 companies have moved their head offices to Malmö since fina-lization of Øresund Bridge (Stadskontoret Malmö stad, 2010). The bridge has played a great role in terms of job creation within the region, where more than 25 000 people commute daily by using Øresund Bridge (Region Skåne, 2009). Still the opinions of whether or not Øresund Bridge have improved the welfare in Sweden especially in the region of Malmö differ, some even say that Malmö has become a suburb to Copenhagen and that the collected money goes to Denmark (Svenska Dagbladet, 2010). Another problem that has increased since the installation is that due to the tax agreement be-tween Sweden and Denmark where it is agreed that the major part of tax that is col-lected from Swedes, employed in Denmark and still have their residence in Sweden, ac-crues to Denmark. In 2007 a calculation showed results that Sweden made approximate loss of a billion SEK due to the tax agreement (Skånskan, 2010). However when the countries agreed to build Øresund Bridge the hope for the future was not to build itin order to increase the regional welfare; it was to increase each nation’s welfare (Stads-kontoret Malmö stad, 2010).
Øresund Bridge is owned by the Swedish and Danish government, where the govern-ments have joint responsibilities to pay back the loan on the Øresund Bridge. This im-plies that taxpayers in their respective countries have not been affected economically. The outstanding loan is in total approximately 23,853 billion SEK (Riksgälden, 2011).
Last year (2009) was the first year Øresund Bridge showed positive results, a profit of 73 million DKK before value change (Annual report, Øresund Bridge, 2009). Most of the profit came from the decreased interest expenses accompanied by low inflation (Øresund Bridge). The repayment plan is that the loan on the bridge will be fully reim-bursed by year 2030. The money collected from the bridge after refunding will most likely be reinvested in a new connection over Øresund. This is based on that Denmark and Germany have an agreement to build a connection over the Fehmarn Belt. When the Fehmarn Belt connection is completed there are expectations that a new connection over Oresund will be needed, in order to relieve pressure over the existing Øresund Bridge. This is stated in the original bridge agreement between Sweden and Denmark (Dagens Nyheter (a), 2010).
1.2
Purpose and limitations
The purpose of this thesis is to investigate the competition structure in the market for crossing Øresund and which price setting techniques are used.
In this thesis the bus traffic will not be included since this transportation method is not as frequently used as the other alternatives, the bus traffic constitutes of approximately 0,6 % of the overall traffic on Øresund Bridge, see Figure 2. Even though the bus traffic market share is calculated to be 0,6 % it is needed to take into consideration how many passengers a bus can transport; depending on which sort of bus it is, some busses have 30 seats while others have up to 50. This makes it even harder to requite information about the busses which would result in unreliable results based on assumptions. Another problem that has come up regarding the bus traffic is the number of different firms that are offering buss services over Øresund Bridge. The goods traffic will also be excluded from this thesis since the passenger traffic constitutes the largest part of the overall traf-fic over the Øresund see Figure 2. Further the goods traftraf-fic is seen as business to busi-ness collaborations where the agreements are individual agreements between two firms. Figure 1 shows an overall view of Øresund traffic where the highlighted parts are in-cluded in this thesis study.
Figure 1 Øresund traffic
Øresund traffic Passenger traffic Car traffic Rail traffic Ferry traffic Bus traffic Goods traffic Rail traffic Ferry traffic Truck traffic
Figure 2 Øresund Bridge traffic
1.3
Previous research
Previous researches about the theory of price discrimination have revealed both positive and negative effects of price discrimination.
One study that is found to have similarities to the example of this thesis is a study per-formed by Shmanske (1993). The study by Shmanske (1993) is based on an experiment made on the tolls of Oakland Bay Bridge (USA), where the purpose was to examine if a system of discriminatory tolls would improve the overall operation efficiency on the bridge. The experiment involves letting the consumers self-select themselves into two different groups, those with high waiting cost and those with low waiting cost. This, in order to make the queue system more efficient where consumers with high waiting cost will be served faster and the consumers with low waiting cost will pay a lower price. The experiment was carried out one typical weekday during the rush hours 5:00-10:00 am where one of the 18 tollbooth was changed into an express lane with the toll price of 10$ instead of the original price 1$. The results of the experiment showed that by intro-ducing this express toll the aggregate waiting cost was reduced in comparison without an express toll. Impatient consumers were able to pay a higher price in order to reduce their waiting cost while patient consumers who waited longer received a price discount. Shmanske (1991) states that by using price discriminatory user fees on busy services when rationing with queues, the outcome can be that firms increase their profits while at the same time it gains the consumers. The results from the study performed by Shmanske (1993) shows that if benefits measured in either money or in people the ones who got a benefit from price discrimination would outweigh the ones who lost, due to price discrimination. Horenig & Valletti (2007) found similar results in a study within the broadcast industry where they state that competition in flat fees generates inefficient results. This could be solved by introducing two-part tariff where the results were in-creased utility for the consumers and an increase in profits for the producers. Moreover, the results from Øresund Bridge will be compared with the study by Shmanske (1993, 1991) and further discussed in the discussion section of this thesis.
92,42% 0,48% 2,31% 4,20% 0,60% Passenger cars up to 6 m Motor cycles
Trucks with trailer 6 - 9 m Trucks over 9m
1.4
Outline
The remainder of the thesis consists of section 2 which presents the theoretical frame-work where theories of market structures, price discrimination, two-part tariff and quan-tity discount are explained thoroughly, while other theories such as peak-load pricing and price-cost margin are explained more briefly.
Section 3 presents numerical data found about Øresund Bridge and its competitors, the data is used to calculate the most efficient alternative for travelling over Øresund. Fur-ther Fur-there will be an attempt to find what the marginal cost for a one way trip over Øre-sund Bridge is; these results will afterwards be used to calculate the approximate price-cost margin.
Section 4 will discuss the findings from section 3 and compare these findings with the theories from section 2. Section 5 concludes the thesis.
2
Theoretical framework
According to Clerides (2004) there are several recent studies that show that price dis-crimination is commonly practiced in the markets where it has been investigated. Each market practices the price discriminatory methods that interact best with the market. Price discrimination is used in markets where the firms are able to obtain the necessary information about their consumers. In the ideal situation of a perfectly competitive mar-ket price discrimination cannot exist. For the ability to price discriminate firm’s need to operate within an imperfect competitive market such as monopolistic and oligopolistic competitive market. In these markets the firms are able to act as price setters instead of price takers, as they do under perfect competition (McDowell & Thom, 2006). Price discrimination has proven to be a profitable strategy that is capable to increase profits for both firms and their consumers; this is true if firms areable to unify the correct price discrimination method that is best suitable for the specific market the firm operates within (Horenig & Valletti, 2007). These are some reasons why the theory of price dis-crimination is interesting to investigate in the Øresund region.
2.1
Market structures
A monopoly is a situation where there is only one firm that produces in a market, due to this it is unlikely for this firm to set price equal to marginal cost, as in a perfectly com-petitive market. As an alternative for the given market price a monopoly will identify its power in the market and set a price and quantity that will maximize the monopoly’s overall profits. A monopoly can choose price and quantity produced independently but the consequence of this will be that for any given price the monopoly choose to set, it will only be possible to sell the quantity that the market will accept. For example; if a monopoly set a high price it will only sell a small quantity. So still the monopoly choice of price and quantity will be constraint by the demand behavior of consumers (Varian, 2005). A monopoly can be seen from two different perspectives which are as a price set-ter or a quantity setset-ter. As a price setset-ter the monopoly sets the price and let the consum-ers choose which quantity they want to buy at that price. As a quantity setter the mono-poly chooses the quantity produced and the consumers choose the quantity price. Both of these ways are equally good when done correctly. A monopoly produces output at the point where marginal revenue equals marginal cost. Due to that a monopoly which pro-duces at this point, the amount produced is not a Pareto efficient amount. Figure 3, illu-strates a monopoly situation where it can be seen when the monopolist produce at the point where marginal revenue equals marginal cost Y*, the price will in this case be the maximum price the monopolist is able to charge at this output P*. The monopoly reve-nue will in this case be the highlighted part in Figure 3 (Varian, 2005).
The monopoly does not produce a Pareto efficient amount of output; this amount is only possible to produce in markets where price equals marginal cost. In some cases it can be seen as easily to regulate a monopoly by letting the regulators set price equals marginal cost, however this is not always possible where in some cases the monopoly would make a negative profit at this price. This kind of situation is common when a firm expe-riences large fixed costs and small marginal costs and is usually known as a natural mo-nopoly. Natural monopolies are often regulated or operated by governments. Often these situations are found within public utilities, examples of public utilities where natu-ral monopolies are commonly seen are telecommunication and electricity among others. In the previously mentioned examples the technology needed to create and maintain these utilities is very expensive, while the marginal cost for using one extra unit is small (Varian, 2005).
However, it is interesting to mention how common it is for a bridge to be in a natural monopoly situation. Some markets are more efficient when a sole firm produces all out-put, this due to that the total production cost would increase if there were more firms producing the same output. To describe a situation where a bridge is considered as a natural monopoly, can be explained by the following example; deliberate a village with a low population, a bridge is built over a river in the village. If the entire village demand (population) is satisfied and served, the bridge can be seen as a natural monopoly. As demand (population) grows the need for new connections increases and new connec-tions are built. As an effect the original bridge ends up being a part of a competitive market (Mankiw, 1998).
Monopolistic competition is generally described as a situation of imperfect competition where there is a large amount of firms that to some extent are offering differentiated products (McDowell & Thom, 2006). Each firm sets its own price where the firm disre-gards the effects of its price decisions on the actions of its competitors. There is free en-try to the market until profits are reduced to zero. The difference between an imperfect competitive firm and a firm with perfect competition is; while a perfectly competitive firm faces a perfectly elastic demand curve where each consumer pays the same price
Price AC MC Demand MR Output Y* P* Figure 3 Monopoly
for the same good, an imperfect competitive firm faces a downward-sloping demand curve. This demand curve shows how the consumers’ willingness to pay differs and that all consumers do not pay the same price for the same good. This statement is also true for monopolistic and oligopolistic firms (Phlips, 1988). In order to engage in monopo-listic competition there is no need for the offered goods to be differentiated, monopolis-tic competition is also found in markets with similar but not idenmonopolis-tical goods. These firms may have a monopoly on their brand names but are engaged in the same market where they compete; this makes up a monopolistic competitive market and some exam-ples of such markets are flat screen TV, beverage companies such as Coca-cola and Pepsi etc. Monopolistic competition is the most extensive form of market structure (Va-rian, 2005). Figure 4, illustrates a monopolistically competitive equilibrium where prof-its are reduced to zero, at this point the demand curve and the average cost curve must be tangent.
Oligopolistic competition on the other hand is described as a situation where a firm pro-duces a product for which only a handful of competing firms propro-duces a close substi-tute. Usually in the case of oligopolistic competition there are a few large firms that are deciding the product characteristics, price and output level (McDowell & Thom, 2006). In markets where there are only two firms that are supplying close substitutes are gener-ally known as duopolistic markets (Varian, 2005). When firms engage in oligopolistic competition, each firm acts upon their own assumptions about what the other firms will do. If a firm is able to set its price prior to the other firms, this firm is then seen as the price leader, while the other firm acts as a price followers (Varian, 2005). Firms in oli-gopolistic competitive markets are dependent on their rival firm’s actions and need to be able to speculate and guess what the rival firms will do. There are two competitive models that deal with this problem. The first one is Bertrand competition, where the firms set market prices and the market determinates the quantity produced. The second model is known as Cournot competition, in this model the firms set the quantities pro-duced while the market determines the market price. Depending on if a firm is in a
Ber-Figure 4 Monopolistic competition
Price
Y
AC
trand or Cournot competitive market the firm needs to take the price and quantity deci-sions while speculating how the rivals will react subsequent to the firm actions (God-dard, Lipczynski, & Wilson, 2009; Varian, 2005). This thesis will study the assumption about oligopolistic competition in the market of crossing Øresund.
2.2
Price discrimination
“Price discrimination is said to exist when the same product is sold to different con-sumers at different prices” Clerides (2004, p.402).
Price discrimination is a broadly used description describing how firms use non linear prices in order to be able to set their prices as close as possible to the consumer’s reser-vation price for the offered commodity. Clerides (2004) concludes that if costs do not equal marginal cost, the firms pricing will be identified as price discrimination. Essen-tially, the principle of perfect price discrimination is that a firm should produce a specif-ic good or servspecif-ice if the revenue and a correctly defined measure of consumer surplus can cover the goods production cost. If this is possible then the optimal quantity can be found by equating the demand price and the marginal cost, P=MC (Stiglitz & Dixit, 1977).
When a firm has some degree of market power it can use that power in a way to form more complex price setting techniques i.e. price discrimination. When firms price dis-criminate, the consumers are divided into different groups that are dependent on price sensitivity of the consumers (Stole, 2003). Further, price discrimination makes it possi-ble for firms to engage in new consumer groups due to that consumers who are not apossi-ble to buy under linear prices will be able to buy under discriminatory prices or in some cases discriminatory prices can encourage consumers to purchase more than they would otherwise (Phlips, 1988). Williamson (2009) developed a similar statement even further by also adding that consumers who are above marginal cost but below the uniform mo-nopoly price will be able to buy the offered good or service. As a result of this, accord-ing to Williamson (2009), allocative efficiency benefits would occur. Williamson (2009) states that the problem with this is that the costs associated with obtaining the true consumer reservation prices and enabling resale are zero. When taking these types of costs into account, what is shown is that costly price discrimination can lead to pri-vate benefits, in the sense that the monopoly benefits increase, but the backside of this is that it can at the same time lead to social losses (Williamson, 2009).
There are some conditions that need to be fulfilled in order for firms to price discrimi-nate, these conditions differ somewhat between different scientists. This thesis will state the general three conditions in order to give a clear picture of how many of these condi-tions that are fulfilled on the example of Øresund Bridge. These general condicondi-tions will be a mixture of conditions presented by Carlton & Perloff (2005), Goddard, Lipczynski & Wilson (2009) and Stole (2003). The first condition is as mentioned before that the firm has to have market power. The second condition is that the firm needs to be able to identify which consumers are the ones with the highest willingness to pay for the firm’s commodity. The third condition is that firms need to be able to prevent resale between the different consumer groups.
Moreover price discrimination is divided into different degrees from first to third-degree price discrimination; the different degrees of price discrimination explained more tho-roughly:
When first-degree price discrimination, also known as perfect price discrimination, ex-ists each unit of good is sold to the consumer that values the good most highly at the maximum price the consumer is prepared to pay, see Figure 5. The goal for the firm is to increase producer’s surplus, where in this situation the entire surplus goes to the firm while there will not be any consumer surplus in the market. Because of the possibility to extract all the consumer surplus, first-degree price discrimination is the most profitable form of price discrimination for firms (Phlips, 1988). In order for this to sustain the firm has to produce at an output level where the marginal willingness to pay equals marginal cost (Varian, 1996). The outcome of first-degree price discrimination will be Pareto ef-ficient which means that there will be no way to increase the consumer or the firm sur-plus, the firms’ profits cannot be increased since it is the maximal profit available and the consumers surplus cannot be increased without decreasing firms profit (Varian, 1996). The firm will finally get a profit of the area Pn-A-B (Figure 5).
The concept of first-degree price discrimination is not frequently seen in the markets nowadays. The reason behind the fact that perfect price discrimination is not seen is be-cause there is difficulty for firms to identify different consumers and their different needs and demands, which also makes it difficult to set the perfect price (Carlton & Per-loff, 2005; Leland & Meyer, 1976). As a result of the difficulties mentioned above the price discrimination practiced nowadays is a minor form of perfect price discrimination, so called imperfect price discrimination, Leland & Meyer (1979).
Second-degree price discrimination is most often referred to as nonlinear pricing
(Va-rian, 1996). This type of price discrimination is used in cases where the firm does not have perfect information about their consumer’s preferences; however the firm is in a position where it can implement nonlinear pricing (Gotlibovski & Kahana, 2009). Firms that do engage in second-degree price discrimination set their price dependent on how many units are purchased by the consumer as well as the consumer group the consumer belongs to (Goddard, Lipczynski & Wilson, 2009). At the best the firm will offer a list of options that the consumer can self-select from (Stole, 2003). Second-degree price discrimination has an impact on welfare by providing the consumer with the highest reservation price an efficient amount of goods, while the consumer with a lower reser-vation price may get inefficiently low amounts, yet both groups will be better off than if
MC B A Willingness to pay Demand Quantity Qn q1 q2 q3 q4 q5 Pn P5 P4 P3 P2 P1
Figure 5 First-degree price discrimination Source: Goddard, Lipczynski & Wilson (2009, p. 323)
they did not participate in the market at all. With lack of differentiated pricing the group with a small willingness to pay would not be served at all (Varian, 1996).
Figure 6 shows an example of second-degree price discrimination where a firm sets four different prices for the same product at different quantities; as the figure shows the price of P4 is charged when the consumer buys Q1 units, P3 is charged when the consumer buys Q2 units, P2 is charged when the consumer buys Q3 units and this continues until the price reach the marginal cost which is at P1 where the consumer buys Q4 units. As the figure shows this firm is not able to extract the entire consumer surplus in the mar-ket, although the firm has managed to increase its surplus. An example; if the firm only set one price at P4 they will only sell Q1 which means that the firm would lose the con-sumer surplus represented by the triangle A-B-C, seen in Figure 6.
Figure 6 Second-degree price discrimination Source: http://digitaleconomist.org/pd_4010.html
Third-degree price discrimination occurs when the firm sells different output to
differ-ent consumers for differdiffer-ent prices, yet each consumer pays the same price for each unit of output bought. This type of price discrimination is the most common price discrimi-nation seen in markets nowadays, such as; student discount, children discounts, senior citizen discount etc. (Varian, 2005). Third-degree price discrimination will increase welfare only if it has made output increase sufficiently but if output did not increase suf-ficiently due to the third-degree price discrimination the entire welfare will fall (Varian, 1996; Schlmanesee, 1991).
In retrospect a connection can be seen regarding the three conditions and the three dif-ferent degrees of price discrimination. In order for a firm to practice first-degree price discrimination all three conditions need to be fulfilled. Moreover, for a firm to practice second-degree price discrimination only the first and the third condition need to be ful-filled. Finally, in order for the firm to practice third-degree price discrimination it only needs to fulfill the third condition.
Summarizing section 2.2, if price discrimination makes it possible for more consumers to be served it will generally increase welfare. However, if price discrimination does not affect the number of consumers served or the purchased amount, then in general welfare will decrease. The impact of welfare depends on whether price discrimination has lead
to an increase or decrease of the output of the good (Varian, 1996). In order to fulfill the purpose of this thesis the theory of second-degree price discrimination and third-degree price discrimination are used, this based on previous studies which show that these forms of price discrimination are the most common in the existing markets.
2.3
Two-part tariff, Quantity discount and Peak-load pricing
Two-part tariffs have been used in different markets since the late 19th century; the first industry that adopted two-part tariff was the electricity industry where the consumer first was required to pay a fixed fee in order to have electricity and also a variable fee which was dependent upon how much electricity the consumer consumed (Lewis, 1941). This is a price discriminatory tool which is based on a concept where firms first set a subscription fee for their consumers. The subscription fee must be paid, for the ability to buy the service for a lower price than without the subscription fee, or in some cases to be able to buy the offered service at all. In order for two-part tariff to be prac-ticed the firms need to reduce any possibilities for resale of the service, before imple-menting it (Philps, 1988). In comparison with the most common pricing which is linear pricing, two-part tariff generates a higher profit for the firms while it leaves the custom-ers worse off than with linear pricing. However, if the firm offcustom-ers two-part tariff while the consumers still are able to choose linear pricing methods, then there is a Pareto im-provement which means that the consumers who choose to use two-part tariff increase their utility, while at the same time the firm also increase its profits (Horenig &Valletti, 2007; Littlechild, 1975). According to Lewis (1941) there are two incentives to use two-part tariffs; first incentive to use two-two-part tariff is when a firm experience seasonal ef-fects e.g. higher electricity usage during the winter in comparison to summer. In the ex-ample mentioned above the firm can use two-part tariffs in order to allocate their cost to the consumers so they are able to generate some cash inflow also during the time when the firm slacks. The second incentive is that even if the firm does not experience any negative seasonal effects the firm could find it rewarding to use a two-part tariff in order to be prepared for unexpected negative changes such as seasonal changes. Two-part ta-riff is an alternative method for first-degree price discrimination.
Most of the research about quantity discount has only been carried out from the con-sumer perspective; there has not been done nearly as much research from the firm’s perspective (Monahan, 1984; Lee & Rosenblatt, 1986). Quantity discount is a method that can be seen in many firms and markets nowadays such as; broadband market, gyms, tennis clubs etc. When quantity discount is applied the firm is able to set a pric-ing schedule which is quantity dependent and where resale between the consumers is prevented (Katz, 1984). When using quantity discount in markets where there is corre-lation between the market and the consumers, quantity discount can lead to that both the firm and their consumers gain from such agreement (Monahan, 1984). The result from Monahan (1984) research model was that firms can always improve their profit by set-ting the price discount correctly. In general one can expect that quantity discounts in-crease welfare (Varian, 1996). Two-part tariff and quantity discount are division from the nonlinear prices since they are prices that are quantity dependent (Phlips, 1988).
Peak-load pricing is used when markets experience variation in demand at different
point in time. Examples on services that are experiencing peak-load pricing are; roads, tunnels and bridges. Because these services are not storable there is a need to attract consumers to use these services during the off-peak periods. A common way of
attract-ing the consumers is by reducattract-ing the price durattract-ing these periods (Goddard, Lipczynski & Wilson, 2009).
2.4
Price-cost margin
The price cost margin (PCM) is a calculation that shows the difference between price and marginal cost as a fraction of price; (Carlton & Perloff, 2005). PCM is a common measurement in economics when an estimation of the market competition is desired (Boone, 2008). Furthermore, Boone (2008) states that the results from PCM as a measurement of competition are not robust, this statement is based upon studies which have shown that higher levels of competition in some industries leads to higher PCM values, while high levels of competition should instead lead to lower PCM values. One of the reasons that PCM still is a popular measurement is because the data needed in or-der to calculate PCM is easily found (Boone, 2008). In a perfect competitive market the PCM equals zero because price equals marginal cost (P=MC). This result is also known as the Lerner index (L) which measures market power, . The Lerner index can have a minimum value of zero with a maximum value of one. In imperfect competitive markets where price is greater than marginal cost and marginal cost is greater than zero, PCM (Lerner index) will have a result between zero and one (Goddard, Lipczynski & Wilson, 2009). Calculating the Lerner index for Øresund Bridge will give an indication of whether or not the market is imperfectly competitive, further it will also give an indi-cation of how powerful Øresund Bridge is in the market.
3
Results
Øresund Bridge travelers have the possibility to select from a list of price schedules in order to choose the alternative that fit the personal travelling preferences. The prices of crossing the Øresund Bridge are divided into different categories (pricing schedules) for different consumer groups. For theoretical assumptions, consumers are expected to act rationally and have the possibility to obtain the given information regarding their travel possibilities. As stated before this thesis will only explain the alternatives and prices for passengers with or without car. Further discounts such as internet discount have not been taken in consideration. The EasyGo1 agreement is not included in this thesis since it is an agreement that involves other destinations such as Great Belt Bridge and other passages between Denmark, Sweden, Norway and Germany.
3.1
Passenger car prices
This section will provide an overview of how the prices are set for passenger cars on the motorway on Øresund Bridge.
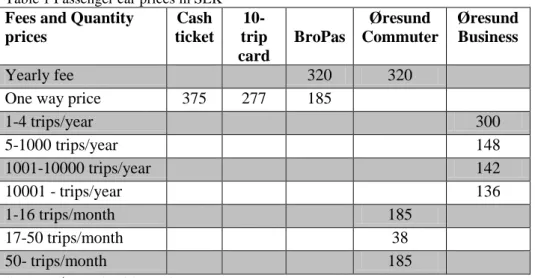
Table 1 presents the prices for a one way trip over Øresund Bridge with a passenger car, up to six meters of length, and the yearly fees that are required to be paid for the ability to travel with the contractual prices.
Table 1 Passenger car prices in SEK
Fees and Quantity prices Cash ticket 10-trip card BroPas Øresund Commuter Øresund Business Yearly fee 320 320
One way price 375 277 185
1-4 trips/year 300 5-1000 trips/year 148 1001-10000 trips/year 142 10001 - trips/year 136 1-16 trips/month 185 17-50 trips/month 38 50- trips/month 185
Source: Øresund Bridge, prices
Cash ticket: is a ticket paid in cash/credit card for a one way trip over the bridge.
10-trip card: is a card that can be used for ten one way trips over Øresund Bridge and is
valid for 12 months from the first time used.
BroPas: is an agreement that decreases waiting cost for the consumers, by making it
easier to pass through the pay stations, with this agreement the consumer pays a con-tractual price that is 50% of the cash ticket price, yet this offer requires a yearly fee of 320 SEK.
1
EasyGo is a Scandinavian collaboration with the intention to ease the payment for travelers that pass through the different pay stations when travelling in the northern Europe such as; Northern Germany, Denmark, Sweden and Norway. (http://easygo.com/sv/about-easygo)
Øresund Commuter agreement: Requires a yearly fee of 320 SEK and a variable fee that
is dependent upon how many times each month the commuter travels over the bridge. The commuter agreement entails a smoother and faster drive through the pay station, so the consumers signing this agreement decrease their waiting cost.
Øresund Business: is an agreement that is provided for the firms that are passing the
bridge in their work. In the order process the firm presents an estimation of the number of time they will use the bridge and pay that price the whole year. In the end of the year the difference between the estimated and the true number of times travelled results in a pay back or extra charge. As an example; a firm gives the information that they will use the bridge four times this year, in this case a one way trip costs 300 SEK, however in the end of that year the firm have used the bridge six times and paid in total 300 SEK*6 trips = 1800 SEK, the actual price they should have paid is 148 SEK*6 trips = 888 SEK. For that year the firm will get a payback of, 1800 SEK-888 SEK = 912 SEK. The more one way trips the company does during the year the lower the unit cost for each trip be-comes.
3.2
Train ticket prices
This following section will provide an overview of the prices for a train ticket using the railway on Øresund Bridge.
Table 2 presents the prices for a one way trip by train on Øresund Bridge railway, fol-lowed by the different pricing schedules explained more thoroughly;
Table 2 Train ticket prices in SEK
Prices and fees Cash tick-et adult Cash tick-et child Duo/ family ticket Jojo Øre-sund card Jojo dis-count card
One way price 105 53 189 84
Monthly fee 1900
Source: Skånetrafiken, prices
Cash ticket adult/child: is a ticket for a one way trip over the bridge.
Duo/family ticket: is a one way trip ticket that two adults or a family consisting of two
adults and up to three children can use for a one way trip.
Jojo Øresund card: is a monthly season ticket that costs 1900 SEK and gives access to
unlimited trips during a period of 30 days.
Jojo discount card: is a card that the passenger charges with money prior to the trip
which entitles the passenger to pay a discounted price, which is 20% lower than the cash ticket price.
In addition to the prices presented in Table 2 Skånetrafiken also offer:
“Øresund Round”: An offer which includes bus traffic, train traffic and
Scandlines/HH-ferry traffic in the Øresund Region for the cost of 249 SEK. This ticket is valid for two days from the first usage and the traveler is entitled to unlimited amount of stops. The criteria’s for this ticket are that the traveler needs to use the ferry in one direction and Øresund Bridge in the other direction.
Further other discounted offers are supplied such as a student discount which gives commuting students a 35% discount on a Jojo Øresund card, this card is called Jojo Student card.
3.3
Ferry prices
The following section will provide an overview of the price setting of the ferry traffic over Øresund. The ferry does not have the same destination as the bridge and the train, but is considered to be a close substitute for crossing the Øresund. The ferry travels be-tween Helsingborg, Sweden and Helsingør, Denmark. There are two ferry traffic firms that operate on the market, Scandlines and HH-ferries. Since fall of year 2009 these two firms have begun to collaborate; now the consumer is free to use both firms’ ferries on the same ticket/ agreement when travelling over Øresund (Øresunddirekt, 2010). Table 3 presents the ferry prices for passengers with car, followed by the different pric-ing schedules explained more thoroughly;
Table 3 Ferry prices in SEK for passengers with car
Prices and fees Cash ticket One day ticket Weekend ticket Commu-ter card Discount card
One way price 385 410 620
Yearly fee 100 10 trips valid 6 months 2160 20 trips valid 6 months 3425 20 trips valid 1 month 3315 50 trips valid 2 months 4200
Source: Scandlines, prices
One way price: Is a ticket for a one way ferry trip over Øresund. One day ticket: A ticket that includes a return trip during the same day. Weekend ticket: A ticket that includes a return trip during the weekend. Discount card: Is a card that gives the consumer discounted prices.
Since the collaboration Scandlines and HH-ferries have introduced a commuter agree-ment which they call the commuter club. In order to become a member of the commuter club a yearly membership fee of 100 SEK is required. The requirement for the member-ship is that the consumer needs to buy at least two commuter cards per year. Subse-quently the consumer obtains the right to buy a maximum of three 10-times cards with 19% discount beyond the commuter card. The commuter card offer is valid for two months and includes 50 one way trips; the price for this card is 4200 SEK.
For those who choose not to sign a membership there is one more alternative which is a monthly season ticket, where the consumers are entitled to 44 one way trips for the price of 4065 SEK.
Table 4 presents the ferry prices for passengers on foot, followed by the different pric-ing schedules explained more thoroughly;
Table 4 Ferry prices in SEK for passengers on foot
Price and fees
Cash ticket adult
Cash ticket child/ senior
citi-zen
Commuter card
Senior citizen 10-trip card
One way price 30 18
Return ticket 58 34
Membership fee 50
46 trips 1m 510
50 trips 1m 360
10 trips 280
Source: Scandlines, prices
Cash ticket adult/ child/ senior citizen: is a ticket for a one way trip over Øresund. Commuter card: is a card for commuters on foot. A yearly membership fee of 50 SEK is
required in order to be entitled to purchase a commuter card.
Senior citizen: is a monthly season ticket that can be used for up to 50 one way trips
during a period of one month.
10-trip card: a card that is valid for ten one way trips.
3.4
Result summary
By looking back at the prices previously presented in Table 1, 2, 3 and 4, calculations are made to see which pricing schedule that is the most economic for different occa-sions. These results are presented and explained in the tables below, yet the calculations and current data for Table 8 is found in Appendix 1. The chosen occasions are; a one
way trip over the bridge, a one day visit (including a return trip) or a weekend trip to
Denmark/Sweden and commuting over Øresund.
The following calculations will not consider the personal costs related to the car such as; gas, reparations, wears etc. Furthermore, the calculations have not considered the costs of get to/from the harbor in respective city. These limitations are made because the comparison is between the different offers a consumer can self-select from.
Table 5, presents the prices for a one way trip to cross Øresund. The different alterna-tives offered in the market differ widely depending on transportation method and desti-nation as well.
Table 5 One way trip
Øresund Bridge
Ferry Train Price difference in SEK
Price difference in %
On foot 30 105 75 350 %
With car 375 385 10 2,66 %
As seen in the table the highest difference in SEK and percentage as well is when travel-ling on foot. When a customer chooses to travel on foot the least expensive alternative
is to use the ferry service. However, the ferry service has its limitations since the desti-nation is a harbor and there are other necessary costs associated to this alternative such as transportation to/from the harbor. When travelling with car the least expensive alter-native is to cross Øresund using Øresund Bridge.
The prices for a one day visit in respective country with a return ticket included are pre-sented in Table 6.
Table 6 One day trip including a return ticket
(1) There is no such an offer as a one day trip so the consumer needs to buy two one way trip tickets for the
price of 105 SEK * 2 = 210 SEK
(2) There is no such an agreement as a one day trip so the consumer needs to buy two one way trip tickets for
the price of 375 SEK * 2 = 750 SEK
The largest difference in SEK is seen when travelling with car where the ferry costs 340 SEK less than Øresund Bridge. The largest percentage difference is seen when travel-ling by foot where the ferry is clearly the less expensive alternative.
The prices for a weekend trip including a return ticket are presented in Table 7. This scenario shows the largest difference both in SEK and percentage when travelling on foot.
Table 7 Weekend trip including return ticket
The price difference is found to be 191 SEK while the price difference in percentage is 429%.
To sum up, the most economic alternative for a one day/weekend trip is Øresund Round, this if the consumer wants to have unlimited trips in the region, but if the one day/weekend trip consists of just crossing the kyle the most economic alternative is tra-velling by ferry with a cost of 58 SEK (car excluded). If the consumer wishes to travel by car, the offer from Scandlines can be considered as the most economic alternative, which costs 620 SEK.
Table 8 presents the different transportation alternatives with the specific commuting offers that are provided by the firms operating in the market.
Øresund Bridge
Ferry Train Price difference in SEK Price difference in % On foot 58 210 (1) 152 362 % With car 750 (2) 410 340 183 % Øresund Bridge
Ferry Train/Bus Price difference in SEK
Price difference in %
On foot 58 249 191 429 %
Table 8 Commuting
As seen in the table the lowest price for commuting is the ferry alternative (car ex-cluded) which ends up in a total cost per trip of 12, 85 SEK. If the commuter wants to commute with a car then the most economic alternative is using Øresund Bridge with a total cost per trip of 39 SEK.
3.5
Marginal cost for a one way trip over Øresund Bridge
In order to find the marginal cost for a passenger car passing Øresund Bridge, some ad-ditional information needs to be collected. The information needed is regarding the op-eration cost, personnel cost and the total amount of times the bridge has been crossed. The marginal cost that will be calculated will be an approximate marginal cost for the year of 2009. The information presented in Table 9 and 10 is collected from the Annual report, Øresund Bridge (2009).
Again, the focus is only on passenger traffic on Øresund Bridge, the limitation is made because of difficulties to collect the necessary information for the ferry traffic and train traffic. As seen in Table 9 the total amount of traffic is 7 103 706, where passenger car traffic constitutes of 6 565 023. This implies that the passenger car traffic makes up (6 565 023/ 7 103 706), approximately 92.5% of the total traffic on Øresund Bridge. One of the reasons behind the fact that passenger car traffic makes up such a big portion of the overall traffic on Øresund Bridge can be that goods traffic probably choose to use the ferry service, most likely due to the fact that their destination is a harbor. Since the information regarding operation and personnel costs is not available to find in divided form for respective means of travel; the following calculations regarding marginal cost will be based upon the assumption that the passenger car traffic makes up 92.5% of op-eration and personnel costs.
Table 9 Amount of passages over Øresund Bridge in the past two years
Year Passenger cars
Motorcycles Trucks with trailer Trucks Busses Total
2008 6 502 793 35 012 161 386 341 106 47 979 7 088 276 2009 6 565 023 33 845 164 025 298 071 42 742 7 103 706
The total personnel cost for year 2009 is 103 000 000 DKK (Annual report, Øresund Bridge, 2009) and operation cost is 267 000 000 DKK, see Table 10. With the previous assumption the costs for passenger car traffic are:
Øresund Bridge
Ferry (car in-cluded)
Ferry (car excluded)
Train/Bus
Fixed fee per month
26,7 8,5 4
Variable/fixed fee
1520 4200 510 1900
Total cost per month
1547 4208,5 514 1900
Total cost per trip
Personnel cost: 103 000 000 DKK * 0.925 = 95 275 000 DKK
Operation cost: 267 000 000 DKK * 0.925 = 246 975 000 DKK, summarizing these two results the total cost is found: 95 275 000 DKK + 246 975 000 DKK = 342 250 000 DKK
Table 10 Øresund Bridge results for the past two years in DKK
Proceeding by calculating an approximate marginal cost: 342 250 000 DKK / 6 565 023 passes ≈ 52.1 DKK per passage
The average price a consumer paid for a ticket during year 2009 was 145 DKK accord-ing to Annual report, Øresund Bridge (2009).
In order to be able to present the marginal cost and average price in SEK, there is a need to find an exchange rate, this exchange rate is found to be 1,426426 (Riksbanken2). Using the found exchange rate, the marginal cost in SEK results in (52.1 DKK * 1.426426), approximately 74 SEK. Converting the average price that is presented in DKK to SEK, results in (145 DKK * 1.426426), approximately 207 SEK.
The results above will be used in a further analysis of Øresund Bridge and its market power, in the next section where the price-cost margin will be calculated.
3.6
Approximate price-cost margin
In an attempt to illustrate whether or not Øresund Bridge have market power in the ac-tual market, an approximate PCM will be calculated. Since these calculations will be approximate calculations the results should not be seen fully truthful, it should rather be considered as a good indicator for the true PCM value. As known from theoretical framework; when the PCM is equal to zero the firm operates within a perfectly competi-tive market where each firm has the same amount of market power. If PCM is above ze-ro but below one, the firm operates within an imperfect competitive market, also known as monopolistic and/or oligopolistic market, this value indicates that the firm exercises some market power.
2 The exchange rate is retrieved from: http://www.riksbank.se/templates/stat.aspx?id=16749, where the
user needs to fill in a form for which year and month the exchange rate is desired. In this case the cho-sen year is 2009 and the month is December. When the user chooses the month of December the aver-age exchange rate will be retrieved.
Million of DKK 2008 2009 Road traffic revenue 981 979 Railway traffic revenue 441 449
Other revenues 19 17
Revenues in total 1 441 1 445
The formula for price-cost margin:
In this case the price is the average price each consumer paid during year 2009, pre-sented in DKK (Annual report, Øresund Bridge, 2009) and converted to SEK in the previous section.
Previous results from this thesis give this equation:
When analyzing the result for the approximate PCM, it shows that the PCM in the case of Øresund Bridge is not equaled to zero, hence considered as a sign of market power.
4
Discussion
The results in this study show that Øresund Bridge applies different price setting tech-niques, which can be interpreted as price discrimination. The prices presented in Table 1, 2, 3 and 4 demonstrate the different pricing schedules existing on the market of cross-ing Øresund. The tables show that different consumers pay different prices. The differ-ent price discriminatory techniques used on Øresund Bridge that are relied on the pre-sented theories, follows:
First-degree price discrimination is not found to exist in this study. Based on theory of
price discrimination it is stated that there are no first-degree price discriminatory exam-ples of markets nowadays. After researching the prices in the market and on Øresund Bridge there are no signs that the firms are able to sell each unit of output to the con-sumer’s reservation price.
Second-degree price discrimination is in this study found to be used widely in terms of
consumer’s possibility to self-select the best offer from different price schedules. Fur-thermore, a condition for price discrimination, set by Stole (2003), is that the firm needs to be able to divide their consumers into different consumer groups directly or indirect-ly. Øresund Bridge gives their consumers the possibility to self-select from different pricing schedules, which can imply that Øresund Bridge indirectly divides their con-sumers into different groups. As seen in Figure 6, the firms in the market offer different pricing schedules in order to extract large parts of consumer surplus. This can be inter-preted as a sign that second-degree price discrimination in the studied market increases the firms’ surpluses while it leaves the consumers worse off.
A further analyze of the results shows that third-degree price discrimination is also ap-plied on the current market where children discount, student discount and family dis-count exists. These types of disdis-counts are considered, based on previous research and the theoretical framework, as typical discounts when third-degree price discrimination is practiced. Varian (2005), state that this type of price discrimination is the most common on markets nowadays.
The prices found on Øresund Bridge that seem to be equivalent to two-part tariff are in-cluded in offers such as: BroPas and Øresund Commuter. These offers includes a yearly fee that can be interpreted as a subscription fee in order to pay a lower one way trip cost which can be interpreted as the variable cost in the theory of two-part tariff. Phlips (1988) states that this kind of behaviors can be considered as price discrimination. This statement also seems to be suitable for the membership fee that the consumer is required to pay in order to be able to buy a commuter card provided by Scandlines. Furthermore the BroPas and Øresund Commuter agreement clearly have some similarities with the previous mentioned study made by Shmanske (1993); both examples have alternatives for decreasing waiting costs, in both cases the consumers are able to self-select them-selves into different groups ex; child, student, senior citizen etc. By knowing what sults Shmanske (1993) found it is not surprising that this research did reveal similar re-sults.
Quantity discount is found to be used frequently in the market. The pricing schedules
where consumers can self-select which agreement to sign, such as: Øresund Commuter and Øresund Business are examples of pricing schedules with quantity discount as a
price setting strategy. When signing these agreements3 it is stated that the agreements are personal, which implies that there is not a possibility for resale. According to Katz (1984) quantity discount is applied when firm is able to set a pricing schedule that is quantity dependent and where any resale between the consumers that paid different prices is prevented. This statement can as well be seen as suitable for the discount card that Scandlines offer.
The theory of peak-load pricing is used when firms experience variation in the demand for the service offered at different points in time. In order to attract consumers during these off-peak periods the firms often choose to decrease their prices (Goddard, Lipc-zynski & Wilson, 2009). The off-peak periods for Øresund Bridge are the holidays and weekends. In order to attract more passengers during weekends, a weekend discount has been introduced for the consumers that have signed a BroPas, Øresund commuter agreement and/or Øresund Business agreement. Until 13th of June 2011 the consumers with the previously mentioned agreements are able to travel for a lower cost during all Swedish and Danish holidays and weekends (Øresund Bridge, weekend prices). These prices are not presented in this thesis but are considered as a method of peak-load pric-ing which is important to include in this discussion section.
Monopolistic competition as previously presented is generally described as a situation of
imperfect competition where there is a large amount of firms that are to some extent of-fering differentiated products (McDowell & Thom, 2006). The competition on Øresund Bridge, where the service offered is crossing Øresund, consists of different firms com-peting on the railway and only one firm on the motorway. Because these different firms are offering the same service, with different transportation methods, this competition can be seen as monopolistic. Furthermore, the different ways of transportation can in this case be considered as previously mentioned differentiated products. The findings show that Øresund Bridge consumers pay different prices for the same service; the as-sumption can be made that Øresund Bridge also faces a downward sloping demand curve. This empowers the assumption that the market for crossing Øresund is a mono-polistically competitive market.
There are no obvious signs of oligopolistic competition in the researched market this can to a large extent depend on the fact that the different firms do not offer perfect subs-titutes. Moreover the destinations and transportation methods differ widely within the Øresund market.
The theory about natural monopoly presented in section 2.1 cannot be empowered by any fully reliable findings made, in the case about Øresund Bridge but there are simi-larities that can be interpreted as an indication towards natural monopoly. The first one is that the bridge is owned by the Swedish and Danish governments, which is a usual phenomenon when public utilities are natural monopolies. Moreover one can assume that the there are large fixed costs associated to the building of the bridge such as the loan and maintaining the bridge in a proper way, while the marginal costs can be seen as small, the marginal cost found in this thesis is 74 SEK but this cost includes operation costs which also could be considered as maintaining cost. Still it can be seen realistic to assume that the marginal cost for a drive over Øresund Bridge is low. However, as pre-viously mentioned there is no information collected that can fully empower these
thoughts, still there are some links between the theory of natural monopoly and Øresund Bridge.
Furthermore it is interesting to analyze how the competition differs between passenger traffic and goods traffic dependent on the distance and how frequently the consumers travel over Øresund. Taking distance and frequency into consideration, Figure 7 analyz-es the market structure. When travelling a short distance and often such as commuting it does not matter whether it is passenger or goods traffic one can assume that the Øresund Bridge is the best suited alternative, this due to that the ferry has another destination and when commuting or transporting goods short distance the time is a variable that is im-portant and the bridge is the fastest way to travel over Øresund. Remembering the dif-ferent commuter agreements the results showed that Øresund Bridge was the least ex-pensive way of commuting when commuting with car. In these types of situations Øre-sund Bridge can be considered as a monopoly.
Analyzing the opposite situation instead which is travelling a long distance to e.g. Den-mark for a holiday as a tourist is a situation that does not occur so often, maybe one or a couple of times each year. In that case the market structure can be interpreted differently where tourists or long-distance truck drivers can see the other market alternatives as an even better alternative than the bridge. The ferry can be considered inviting due to the cafeterias, toilets, boarder-shops and sleeping possibilities. When making these sorts of trips the market seems to be wider, in these cases the market structure can be considered as monopolistic competition.
Since Øresund Bridge is the most common way of transportation over Øresund it can be seen as a sign that the Øresund Bridge does have market power. This can be confirmed by Annual report, Øresund Bridge (2009) where it is stated that Øresund Bridge has a total market share of 76%. The results from the calculated price-cost margin also indi-cate that Øresund Bridge exercises some market power.
Monopoly Monopoly Monopolistic competition Monopolistic competition Short distance - Often Long distance -Rarely
Passenger traffic Goods traffic
5
Conclusions
The purpose of this thesis is to investigate the competition structure in the market for crossing Øresund and which price setting techniques are used.
The results found that can give an answer to these questions are that Øresund Bridge is operating under monopolistic competition, since the service offered which is crossing Øresund, is supplied by different firms competing on the railway and only one firm on the motorway. Because these different firms are offering the similar service, with differ-ent transportation methods, the market structure can be interpreted as monopolistically competitive.
Further Øresund Bridge practice price discrimination in order to preserve the market power they possess. In this case Øresund Bridge mixes two-part tariff theory with the quantity discount theory when looking at the agreements that are involving a yearly fee. The price discrimination used in this example is commonly seen within these types of markets. Calculations are made in order to find the most economic way of travel for dif-ferent occasions, in order to empower that difdif-ferent consumers pay difdif-ferent prices for the same service.
The results show that the chosen theories were suitable in the case of Øresund Bridge. However, the results from the calculated marginal cost and price-cost margin are ap-proximate results and cannot be seen as completely truthful results. The reason is be-cause the information was not available to retrieve in divided form for each of the re-spective means of travel, and the calculations were based on an assumption. Further-more, the result from the price-cost margin gave an indication of market power which was confirmed by the information retrieved from Annual report, Øresund Bridge (2009).
Suggestions for further studies are that it would be interesting to study the goods traffic over Øresund and how it differs from passenger traffic and how the market competition appears in that case. Moreover, it would be interesting to study how the planned con-nection over the Fehmarn Belt will affect the competition and price setting techniques on Øresund Bridge.
List of references
List of references
Boone, J. (2008). A new way to measure competition. The Economic Journal, 118, 1245-1261.
Carlton, D. W., & Perloff, J. M. (2005). Modern Industrial Organization (4th ed.).
Bos-ton: Pearson Addison Wesley.
Clerides, S. K. (2004). Price Discrimination with Differentiated Products: Definition and Identification. Economic Inquiry, 42(3), 402-413.
Dixit, A.K., & Stiglitz, J.E. (1977). Monopolistic Competition and Optimum Product Diversity. The American Economic Review, 67(3), 297-308.
Goddard, J., Lipczynski, J. & Wilson, J.O.S (2009). Industrial Oranization;
Competi-tion, Strategy, Policy (3rd ed.). Harlow: Pearson Education.
Gotlibovski, C., & Kahana, N. (2009). Second-Degree Price Discrimination: A graphi-cal and Mathematigraphi-cal Approach. Journal of Economic Education, 40(1), 68-80.
Hoernig, S. H., & Valletti, T. M. (2007). Mixing Goods with Two-Part Tariffs.
Euro-pean Economic Review, 51(7), 1733-1750.
Katz, M. L. (1984). Price Discrimination and Monopolistic Competition. Econometrica,
52(6), 1453-1471.
Lee, H. L., & Rosenblatt,M. J. (1986). A Generalized Quantity Discount pricing Model to Increase Supplier´s Profits. Management Science, 32(9), 1177-1185.
Leland, H.E., &. Meyer, R.A. (1976). Monopoly Pricing structures with Imperfect Dis-crimination. The Bell Journal of Economics, 7(2), 449-462.
Lewis, A. W. (1941). The Two-Part Tariff. Economics, New Series, 31(8), 249-270. Littlechild, S. C. (1975). Two- Part Tariffs and Consumption Externalities. The Bell
Journal of Economics, 6(2), 661-670.
Mankiw, G.N. (1998). Principles of Microeconomics. Fort Worth: The Dryden Press McDowell, M., & Thom, R. (2006). Principles of Economics, (European ed.). Berk-shire: McGraw-Hill.
Monahan, J. P. (1984). A Quantity Discount Pricing Model to Increase Vendor Profits.
Management Science, 30(6), 720-726.
Phlips, L. (1988). Price Discrimination: A Survey of the Theory. Journal of Economic
Surveys, 2(2), 135-167.
Schmalensee, R. (1991). Output and Welfare Implications of Monopolistic Third-Degree price discrimination. The American Economic Review, 71(1), 242-247.
Shmanske, S. (1991). Price Discrimination and Congestion. National Tax Journal,
44(4), 529-532.
Shmanske, S. (1993). A Simulation of Price Discriminating Tolls. Journal of Transport
List of references
Stole, L.A. (2007). Price Discrimination and Imperfect Competition. In M. Armstrong & R. Porter (Eds.), Handbook of Industrial Organization: Volume 3, (p. 2221-2299). Amsterdam, forthcoming
Varian, H.R. (1996). Differential Pricing and Efficiency, First Monday[online], 1(2). Varian, H.R. (2005). Intermediate Microeconomics (7th ed.). New York: W.W. Norton & Company.
Williamson, O. E. (2009). Opening the black box of firm and market organization: anti-trust. In P-O. Bjuggren & D.C. Mueller (Eds.), The Modern Firm, Corporate
Gover-nance and Investment (p.11-42). Cheltenham: Edward Elgar. Internet data sources;
Annual report, Øresund Bridge (2004), Retrieved 2011-02-02 from; http://se.oresundsbron.com/download/88
Annual report, Øresund Bridge (2009), Retrieved 2010-09-18 from; http://se.oresundsbron.com/download/361
Riksgälden, Retrieved 2011-02-07 from;
https://www.riksgalden.se/templates/RGK_Templates/OneColumnPageExtraWide____ 18060.aspx
Scandlines, prices, Retrieved 2010-09-17 from;
http://www.scandlines.se/farja/priser/helsingborg-helsingor Skånetrafiken, prices, Retrieved 2010-09-17from;
http://www.skanetrafiken.se/templates/TravelOresund.aspx?id=2129&epslanguage=SV &DK=F&SE=A
Øresund Bridge, Retrieved 2010-09-17 from; http://se.oresundsbron.com/page/1724
Øresund Bridge, prices, Retrieved 2010-09-18 from; http://se.oresundsbron.com/page/2391
Øresund Bridge, weekend prices, Retrieved 2010-11-15 from; http://se.oresundsbron.com/page/14
Internet sources;
Dagens Nyheter Debatt (2010 July 1). “Nu behöver vi en andra förbindelse över Öre-sund”.
Retrieved 2010-09-20, from;
http://www.dn.se/debatt/nu-behover-vi-en-andra-forbindelse-over-oresund-1.1131137 Region Skåne (2009 August 12). Skånes innovationskraft- En nulägesanalys. Retrieved 2011-02-05, from;