Methane fluxes from Swedish landfills
Metanflöden från svenska soptippar
Final Report
Gunnar Börjesson,
Åsa Danielsson,
Bo H Svensson,
Department of Water and Environmental Studies,
University of Linköping, Linköping
Bo Galle, IVL, Swedish Environmental Research Institute,
Stockholm
October 1999
AFR-REPORT 263 AFN, Naturvårdsverket
Swedish Environmental Protection Agency 106 48 Stockholm, Sweden
ISSN 1102-6944 ISRN AFR-R--263—SE Stockholm 1999
Abstract
Methane, an importantgreenhouse gas, is on the increase (IPCC 1995). Landfills contributes withca. 20 % of the anthropogenic sources(IPCC 1995). The existing
budgets arebased on very rough estimates of the gas producing potential in the wasteand field measurements are few. The objects of this project was to compareand develop methods to measure methane emissions from landfills in situ. Alarge municipal landfill (Falköping) proved to be sufficient for theseexperiments. The methods we used were: 1. Geostatistics. Measuringpoints were put in a grid with over 100 points with
20 m in between, achamber was placed on the surface at each point and samples were taken from the chamber 4 times during 2-3minutes. The change in
concentration between these 4 samples was used toestimate the emission rate from each point. The individual rates were thenprocessed with geostatistical methods (kriging). The spatial correlationwas estimated with the use of a variogram function based on log-transformeddata. This treatment applied to the first measurements in May 1997, gave anintegrated total flux of 2.3 kg CH4 h-1.
2. FTIR/source distribution.FTIR-spectroscopy (Fourier Transform Infrared
Spectroscopy) takes advantageof the infra-red absorption in certain molecules in order to quantifyconcentrations. A retroreflector mirror was used for line-integratedmeasurements in August 1997.
3. The tracer gas technique.During a couple of days in October 1997 total
emissions were measured with the use of a closed multireflection system, placed 500 m downwinds fromthe landfill. Ontop of the landfill a tracer gas (N2O) wasreleased with known flow rate (5.9 kg h-1). Concentrations ofN
2O and
methane were then measured simultaneously by the systemwith high time resolution, 1 minute. Total emissions averaged 44 kgCH4 h-1 during both days.
In conclusion it was demonstrated that the tracergas technique is superior for
measurements of total fluxes from landfills.Compared to geostatistics it is less laborious and more confident. Sourcedistribution kan also be analyzed with FTIR, in which meteorological data(wind direction and speed) is combined with measured
concentrations forestimating emissions from the surface.
Methane oxidation was studied through analysis of stable isotopes. Theconcentration of
13C in emitted methane was compared to methanein the anaerobic zone. Sampling of
gas for analyses of δ13C was done in Falköpingduring August 1997 and in February
1998, together with similar sampling ona small municipal landfill without gas extraction (Östhammar) during thesame periods. At both landfills methane oxidation was
considerable insummer, but no sign of methane oxidation could be detected at airtemperatures below zero.
Sammanfattning
Metan är en av de viktigasteväxthusgaserna, och dess koncentration i atmosfären ökar.Avfallsupplagen står för ca 20 % av de antropogena källorna (IPCC1995). De budgetberäkningar som förekommer grundas på mer ellermindre grova antaganden om gasproduktionskapaciteten hos avfallet ochantalet rapporterade fältmätningar är få. Syftet med detta projekt var att jämföra och utveckla tekniker att mäta
metanemissionerfrån avfallsupplag i fält. Ett stort kommunalt upplag (Falköping)visade sig gynnsamt för dessa experiment. De metoder som vi användevar
1. Geostatistik.Mätpunkter lades ut i ett nätmönster på drygt 100 punkter med20 m mellanrum, en mätkyvett sattes på markytan vid varje punkt, ochprover togs genom ett membran 4 gånger under 2-3 minuter.Koncentrationsökningen mellan proverna gav en skattning av emissionenfrån varje punkt. De värden som erhölls behandlades medgeostatistiska metoder, s.k. kriging. Den rumsliga
korrelationenbestämdes m h a ett variogram beräknat på log-transformerade data.Vid den första mätningen i maj 1997 gav en integrering över ytanett totalt värde på 2,3 kg CH4 h-1.
2. FTIR/källfördelning. Inom FTIR-spektroskopi (Fourier Transform Infrared Spectroscopy) används den infraröda absorptionen hosolika molekyler för att bestämma koncentrationer. En s kretroreflektorspegel användes för
linjeintegrerade mätningar iaugusti 1997.
3. Spårgasmetoden. Under ett par dagar i oktober 1997 mättestotalemissioner med hjälp av ett slutet multireflektionssystem, placerat500 m medvind från upplaget. På upplaget släpptes en spårgas(N2O) med känd flödeshastighet (5.9 kg h -1).Koncentrationer av N
2O och metan mättes sedan simultant avsystemet med
hög tidsresolution, 1 minut. Totalemissionerna uppmättestill i genomsnitt 44 kg CH4 h-1 bägge dagarna.
Sammanfattningsvis kan konstateras attspårgasmetoden är överlägsen för mätning avtotalflöden. Jämfört med geostatistik är den b_8cde mindre arbetskrävande och säkrare. Källfördelning kanockså erhållas med FTIR, där meteorologiska data (vindriktning ochhastighet) kombineras med erhållna mätvärden för att beräknaemissionerna över ytan.
Betydelsenav metanoxidation bestämdes med hjälp av isotopfraktionering, därandelen
13C i metan som emitterats jämfördes med metanfrån den anaeroba zonen. Provtagning
av gas för bestämning av δ13C gjordes i Falköping under augusti 1997 och i
februari1998, samt från ett mindre kommunalt upplag utan gasutvinning(Östhammar) under samma perioder. På båda upplagen varmetanoxidationen betydande under sommaren, men obefintlig vidlufttemperaturer under noll.
Table of contents
Abstract... i
Summary... ii
Table of contents ... iii
1. Introduction - aims... ... 1
2. Materials and methods... ... 3
2.1 Site description... 3
2.2 Methane emissions (for geostatistics)... 3
2.3 Geostatistics – metod... 4
2.4 FTIR - source distribution measurements... 4
2.5 FTIR tracer gas technique... 5
2.6 Methane oxidation - Isotopic analysis ... 6
3. Results ... 8
3.1 Methane emissions... 8
3.1.1Geostatistics ... 8
3.1.2 FTIR/source distribution... 10
3.1.3 The tracer gas method ... 10
3.2 Methane oxidation - carbon isotope studies ... 11
4. Relevance for the society... 12
5. Reports ... 12
1. Introduction – Aims
Methane is one of the most potent greenhouse gases, and is increasing in the atmosphere by 0.6 % every year (IPCC 1995). Methane is produced in landfills in large quantities, subsequent to anaerobic degradation of organic matter. Landfills are
estimated at ca 20 % of the anthropogenic sources (IPCC 1995). The current CH4 emission estimates from landfills are built upon data giving rise to large uncertainties. The gas flows can be described in the following way:
Methane emissions =Production - Gas recovery - Oxidation in cover soils
Only for gas recovery reliable values are available through official statistics. In Sweden landfill gas is extracted from over 60 sites, with a total energy production of 0.42 TWh during 1995(RVF 1996). The total production and oxidation has remained unknown. We know that methane oxidation is temperature-sensitive and is lowered significantly during cold periods (Börjesson & Svensson 1997a), but its total impact has not been estimated.
The literature concerning methane emissions from landfills has been surveyed by Börjesson (1997). From this compilation we knew that there were very few reports on methane emissions from whole landfills: Remote sensing techniques have involved the use of a moveable FI (flame- ionization) detector, reported on by Tohjima and Wakita 1993, the use of a diode laser (Hovde et al. 1995) and FI-detector combined with tracer gas (Mosher et al. 1996). Measurements with static chambers and geostatistics have been reported by Nozhevnikova et al. 1993, Pokryszka et al. 1995 and Mosher et al. 1996. The use of IR (infra red)- spectra from satellite data was tried by Johnson et al. (1993), but according to their findings it was even difficult to decide the areas of the landfills from aerial photographs, due to vegetation.
The objectives of our research have been as follows:
1) More field measurements are needed to provide us with enough data to allow for a more proper estimation of the actual methane emissions occuring from Swedish landfills. This should be done by means of the cheapest and most exact of the methods known today. A comparison of the reliability of these different techniques was one of the purposes with our work. In addition, it was believed that the remote sensing techniques, especially with the use of FTIR, could be developed in analogy with methods used in other environments for measurements of gas fluxes to the atmosphere (e.g. Galle et al. 1994). This technique was considered as the most advantageous, since total emissions could be quantified in real time with high resolution. Other remote sensing techniques proposed, such as air-borne equipment or satellite data, were rejected after considering their demand for additional methodology (eddy correlation etc.) as being more indirect; the latter also because of difficulties to discern older landfills due to vegetation (Johnson m fl 1993).
2) A method to identify the high emitting areas of landfills should be developed. This will help us to mitigate "hot spots" and enable mitigation by local strengthening of the cover soil and utilize its methane oxidation capacity. This type of information could be received with the traditional method involving static chambers/geostatistics, but also with the Long Path FTIR-technique combined with micro-meteorology.
3) Estimation of the methane oxidation through in situ-measurements. A method which has been used in other environments (e. g. Happell and Chanton 1993),and recently also for methane oxidation in landfill covers in Germany(Bergamaschi et al. 1998) and in the U.S. (Liptay et al. 1998), is measurement of carbon isotopes. Methane-oxidizing microorganisms discriminate methane containing 13C, which
implicates that the concentration of 13C in the methane emitted will be enriched
compared to methane from the anaerobic zone. Thus, the 13C/12C-ratio gives a
quantitative measure of the methane oxidation (Liptay et al. 1998). Through measurements at different temperatures, including extremes, the annual methane oxidation can be predicted. We decided to use this method, since it is the most direct method available at present. Other methods available, for instance soil columns (Mancinelli & McKay 1985, Whalen et al. 1990, Kightley et al. 1995) or radon
calibration (Born et al. 1990)were rejected for being more indirect, and therefore likely to be more uncertain.
2. Materials and methods
2.1 Site description
The landfill at Falevi serves the community of Falköping (32 001 inhabitants 31 Dec 1995). It started around 1965 and has a height of 0-12 m and a volume of 325 000 m3. The landfill
area is 25 ha, but methane is only produced in an area of ca. 3 ha. The landfill received 18 000 m3 of household waste and 41000 m3 of industrial waste during 1996 (K Nilsson,
pers. comm.). Gas is extracted from the landfill and via the neighbouring waste water plant delivered to a local dairy for heating purposes.
The shape and location of the landfill made it suitable for our purposes, i. e. A
comparison of methods to measure methane emissions. It was also possible to study the effects of the gas extraction system and data on gas recovery has kindly been at our disposal.
2.2 Methane emissions (for geostatistics)
Static chambers is the traditional way to measure methane emissions, and has been employed also in most landfill studies (e.g. Boeckx et al. 1996, Bogner et al. 1993, Börjesson & Svensson 1997a,b,c, Börjesson et al. 1998, Jager & Peters
1985,Nozhevnikova et al. 1993, Pokryszka et al. 1995, Whalen et al. 1990 etc.). In this study, in order to provide data for geostatistics, the landfill surface (2.2 ha) was divided into a square pattern, where measuring points (marked with wooden sticks) were placed with 20 m distance from each other. Within certain areas, where gaseous emissions could be expected to be higher, such as an eroded slope, a hole for sludge deposits and an area with thin cover, the grid was made more narrow with more points. A 7.4-L chamber was placed on the surface next to each point (within 0.5 m from the stick), and tightened with a mixture of sand and water. Samples of gas concentration inside the chamber were taken in 13 ml pre evacuated glass vials connected to the chamber with a double needle through a butyl rubber membrane 4 times during 2-3 minutes. These short time periods allowed the whole landfill to be measured by two persons within 5 hours. After gas chromatographic analysis (with flame- ionization detector) of the methane concentration in the glass vials, the accumulated methane concentration over time was determined. Through the use of linear regression (r2 = 0.85 for changes different from zero) and conversion factors (for air pressure,
temperature, volume and basic area of the chamber) a value for each point was received, expressed in mg CH4 m-2 h-1.
These measurements was done three times during 1997: 6 May (81 points), 2 July (101 points) and 21 October (83 measuring points).
2.3 Geostatistics - method
Geostatistics is the common name for a set of methods used for statistical theory and applications for processes with continuos spatial index (Journel and Huijbregts, 1978; Cressie, 1993).Geostatistics include a number of techniques and methods, e.g. kriging, cokriging and sequential simulation (Deutch and Journel, 1992), although it
is often used synonymously for kriging. It relies on the Theory of Regionalisation - a theory built up on the assumption that observations close in space are more likely to be alike than those further away (Matheron, 1963).
The model assumption for kriging is Z(x0) = µ +δ (x)
where Z is the regionalised variable that should be interpolated at locations given in x.
µ
is the overall (large-scale) variation, which is assumed to be identical all over the area (i.e. no spatial trends should be apparent). The small-scale fluctuation, δ(x), on the other hand depends on the spatial location.The predictor is ) ( ) ( 1 0 u Z s s Z M k k
∑
= =with conditional weights
to make it unbiased. s0 denotes a vector of geographical positions for the estimates, vector s includes the locations of the observations. To decide the weights, u, a variogram function is used:
(
) ( )
[
]
2 1 ) ( 2 1 ) ( − + =∑
= N p p p h Z s s Z h N h γwhere the h (called the lag) is the Euclidean distance between two observations.
N(h) is the total amount of pairs at lag h. This function describes the spatial correlation
structure within the data. It will make sure that observations close to the estimation location will receive higher weights than those observations further away.
In our case, the spatial correlation was estimated with a variogram (µ) calculated from log-transformed data. The total flux was then achieved through integration over the area.
2.4 FTIR - source distribution measurements
In FTIR spectroscopy the unique infrared absorption of different molecules are used to quantify their concentration. A number of gases of interest in climate change research can be uniquely and simultaneously determined, e.g. CH4, CO2, N2O, CO and H2O (Galle et al 1994). With different types of mirror arrangements, long optical paths can
One strategy that has been discussed is to improve the methane oxidation by adding a proper top soil layer. As methane emissions are very spatially inhomogeneous this could be done effectively if the ”hot” emission areas of the landfill could be localised, and efforts was concentrated to these areas. The long path retroreflector system has been used in an attempt to localise such ”hot” areas. In this experiment the system made measurements in a grid pattern over the site, and by means of a dispersion model the line integrated concentrations along each segment was interpreted to give relative emission source strength over the landfill.
2.5 FTIR tracer gas technique
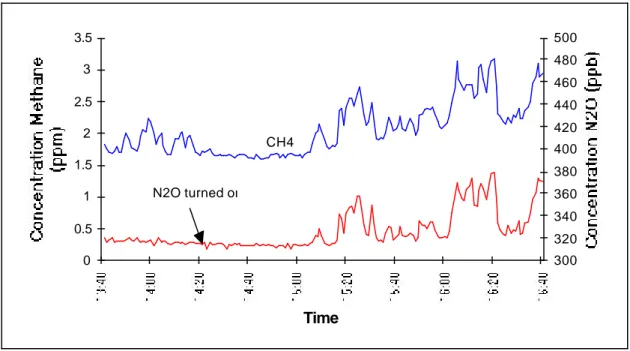
In this method the FTIR system is put up downwind the studied site. A trace gas is released at a known rate from part of the site. During a period with varying meteorology the concentrations of CH4 and trace gas are monitored. The part of the concentration time series of CH4 that correlates with the time series of the trace gas can be assumed to have its origin in the area where the trace gas is released, and can be quantified using the known trace gas flux. If the measurements are conducted far enough from the site, the site can be regarded as a point source and the total emission is determined. By releasing trace gas from different areas on the site, or use of different trace gases, the emission from different parts of the site maybe determined.
In Figure 1 is seen a time series of the methane and nitrous oxide concentrations measured 500 m downwind the landfill during a time period when the tracer gas was released from 2 locations on top of the landfill. The good correlation between the two time series can be seen, indicating the absence of interfering sources and good mixing between the methane plume and the tracer. As no N2O in excess of the ambient level 320 ppb can be seen before the tracer release is turned on at 14:20, it can be concluded that the N2O emission from the landfill is negligible.
Time 0 0.5 1 1.5 2 2.5 3 3.5 300 320 340 360 380 400 420 440 460 480 500 N2O turned on CH4
Figure 1. Time series of the mixing ratios of the tracer (N2O) and CH4 measured 500 m
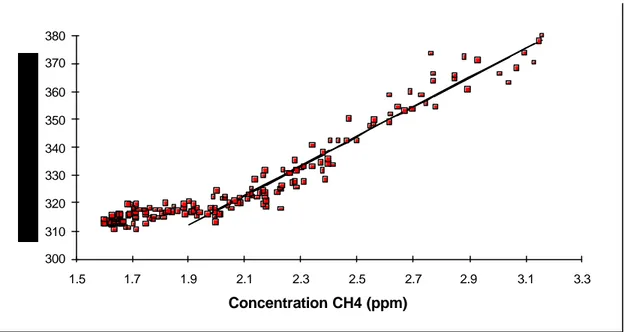
In Figure 2 the concentrations of CH4 and N2O are plotted against each other. By
making a least squares linear fit to the data points corresponding to the N2Omixing
ratios above the ambient N2O value of 320 ppb, the ratio of CH4 and N2O in the plume
is obtained. After multiplying by the source strength of the tracer QN2O, and correcting
for different molecular weights, MN2O and MCH4, a total methane emission QCH4 of 41
kg⋅h-1 was obtained. Concentration CH4 (ppm) 300 310 320 330 340 350 360 370 380 1.5 1.7 1.9 2.1 2.3 2.5 2.7 2.9 3.1 3.3
Figure 2. The relation between methane and nitrous oxide concentrations in the downwind plume. Also shown is a least squares fit to the data having N2O mixing ratios higher than 320
(Galle 1999).
2.6 Methane oxidation - Isotopic analysis
The significance of methane oxidation can be determined through analysis of carbon-isotopes. For this purpose we engaged Prof. Jeffrey P. Chanton from University of Florida, who has a long experience in this type of measurements and analyses. The theory behind the method is that 1) microbial oxidation of methane causes residual methane to be enriched in the heavy isotope of carbon (13C), while methane diffuses
through the aerobic upper zone of the landfills; and 2) when the isotopic fractionation factor (α) is determined for each soil, i. e. when it is known to what extent 13C is
discriminated during methane oxidation, the 13C/12C-ratio gives a quantified measure of
The factor α was determined in cubation experiments. Sampling of gas for analysis of
δ13C was done in Falköping during August 1997 and in February1998. During the same
periods samples were taken at a small, closed landfill without gas extraction (Hökhuvud in Östhammar). Samples were taken both from anaerobic zones and from static
chambers on the landfill surfaces. Mass-spectrometric analyses of the samples were carried out in Prof. Chanton’s laboratory at Florida State University, in Tallahassee, Florida.
3. Results
3.1 Methane emissions
3.1.1 Geostatistics
The relatively short time interval of 2-3 min for each measuring point proved to be sufficient for this purpose. It was even possible to measure consumption of atmospheric methane consumption on all three occasions (Table 1). The highest flux rates were achieved in May, while the highest consumption rates and the lowest flux rates were in July.
Three different approaches for the geostatical treatment were used. In the first
calculation, linear interpolation of the original values was used to get a distribution over the field and then integrated to obtain the total amount estimate (Table 2, "original"). This usually gives over-estimates, as locations close to the extreme values will be given too high values. The second approach, with the back-transformed kriged estimates, probably gives an underestimate as it smoothes (cuts the highest peak values). In the last approach (called "without spikes" in Table 2) the extreme values (three observations for respectively sampling occasion) were excluded before performing the kriging analysis. The area was then integrated before adding these spikes again. The order of size is, for all three sampling events, original (largest), kriging and without spikes.
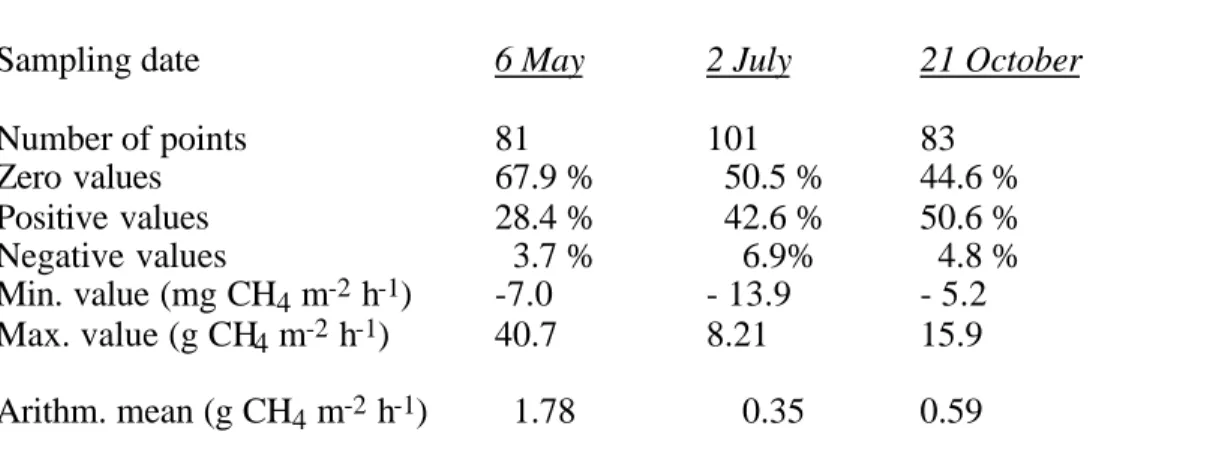
Table 1. Methane fluxes as measured at the individual points of theFalköping landfill during the three measurements in 1997.
_____________________________________________________________________
Sampling date 6 May 2 July 21 October
Number of points 81 101 83 Zero values 67.9 % 50.5 % 44.6 % Positive values 28.4 % 42.6 % 50.6 % Negative values 3.7 % 6.9% 4.8 % Min. value (mg CH4 m-2 h-1) -7.0 - 13.9 - 5.2 Max. value (g CH4 m-2 h-1) 40.7 8.21 15.9 Arithm. mean (g CH4 m-2 h-1) 1.78 0.35 0.59 _____________________________________________________________________ The geostatistical treatment showed that the methane emissions could be source-divided into three distinct regions, Figure 3. The highest emission rates were recorded on a slope, where the cover soil was partly eroded. This pattern remained through all the three measurements.
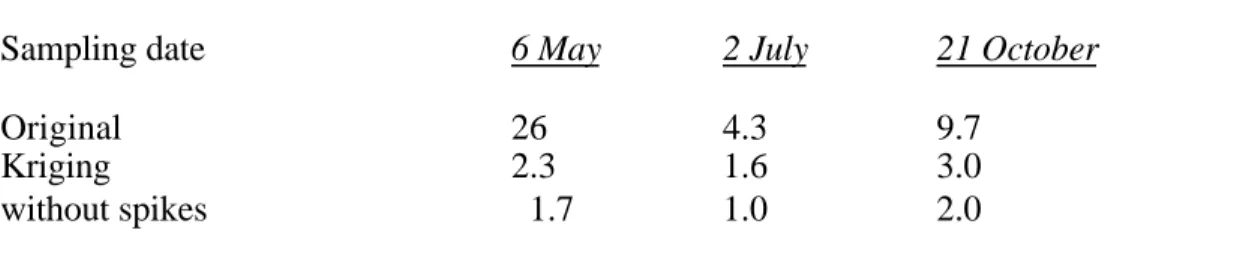
Table 2. Total methane emissions (kg CH4 h-1) from Falköping landfill, as estimated with different methods.
_____________________________________________________________________
Sampling date 6 May 2 July 21 October
Original 26 4.3 9.7
Kriging 2.3 1.6 3.0
without spikes 1.7 1.0 2.0
_____________________________________________________________________ Without kriging, a simple extrapolation from the mean values in Table 1 would give 38.9 (6 May), 7.65 (2 July) and 12.9 kg CH4 h-1 (21 October) as whole-landfill emission
rates.
Figure 3. Geostatistical estimate of methane emissions (mg CH4 m-2 h-1) from the landfill in Falköping 6 May 1997. An integration over the whole surface gives a total value of 2.3 kg CH4per hour during the measurement period.
3.1.2. FTIR/source distribution
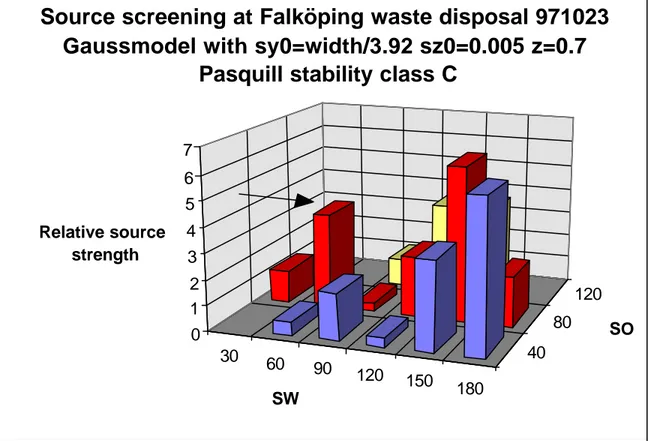
On August 10 1997 an attempt was made to measure there lative source strength at the landfill surface by means of Long Path FTIR techniques. Line integrated measurements was conducted along different segments, about 1 m above the ground, in a grid pattern covering 180x120 m. The speed and direction of the wind was measured along each segment, and the results was interpreted using a simple dispersion model. The results are shown in Figure 4 below.
30 60 90 120 150 180 40 80 120 0 1 2 3 4 5 6 7 Relative source strength SW SO
Source screening at Falköping waste disposal 971023
Gaussmodel with sy0=width/3.92 sz0=0.005 z=0.7
Pasquill stability class C
Figure 4. Relative methane emission pattern at Falköping landfill on August 10 1997, calculated from wind weighted concentration measurements. View from west, (Galle, 1999).
3.1.3 The tracer gas method
Methane emissions from the Falköping landfill were measured with the tracer gas and FTIR equipment for ca. 20 hours on each of 21/22 and 24/25 October 1997 ppb. Total emissions averaged 41 kg CH4 h-1 during both days, with minor variations (=10%). This value is more than 4 times higher than the values obtained with the static chambers; cf. The "original" value of 9.7 kg CH4 h-1 (Table 2) and the extrapolated arithmetic mean of 12.9 kg CH4 h-1.
In conclusion, we have demonstrated that the tracer gas technique is superior for measurements of total fluxes. Compared to geostatistics it is both labour-saving and more exact. The geostatistics needs at least 2 weeks of analyses and data processing. It is also necessary that the hot-spots are properly estimated, which is doubtful since the integrated total values from the three measurements were estimated at c. 25% (at its best) of the flux-values obtained with the tracer-gas technique. Thus, geostatistics only provide a qualitative measure, i.e. it shows how the fluxes are spread over the surface. Source-distribution can also be achieved through the use of FTIR, where meteorological data (wind direction and speed) combined with the recorded values can be used to estimate the gaseous emissions from the landfill surface. During the 1998 up-scaling of our experiments (with grants from NUTEK/STEM), where only the total fluxes were of interest, only the tracer gas technique was employed.
3.2 Methane oxidation - carbon isotope studies
The data received from the old landfill in Hökhuvud showed that methane was oxidized at significant rates down to at least 1.3 m depth during the warm period in August 1997. The?13C of emitted CH
4 was significantly 13C-enriched in summer compared to winter (p<0.0001), when no difference in ?13C could be found between emitted and anaerobic-zone CH4 at soil temperatures below 08C. In summer, CH4 oxidation was estimated to be between 40.7 and 50.1% of the available CH4 in the new landfill (Falköping), and between 60.2 and 93.7% of the produced CH4 in the old landfill (Hökhuvud).
4. Relevance for the society
Both the society and enterprising companies have demands for the care taking and utilization of the landfill gas. Gas extraction should be done in the most effective way, to preventfires, explosions, and odours, and additions of greenhouse gases, bot also to yield energy.
The effectivity of the present extraction systems is poorly known, since informations about leakages of landfill methane do not exist. More exact figures on production, oxidation and emissions of methane in and from the landfills will give a better
background for decisions. The development of measuring techniques, which has taken a large step further in this project, offers new opportunities to generate such data.
5. Reports
The results from this project have been compiled in three manuscripts:
1) Börjesson, G., Chanton, J.P. & Svensson, B.H. "Methane oxidation in two Swedish landfillcover soils as determined with the use of 13C/12Cisotope ratios." Manuscript for submission to Journal of Environmental Quality.
2) Börjesson, G., Danielsson, Å & Svensson, B.H. "Methane fluxes from Swedish landfills determined through geostatistical treatment of static chamber
measurements."
3) Galle, B. & Samuelsson, J. "Measurements of methane emissions from landfills using a time correlation tracer method based on FTIR absorption spectroscopy."
Manuscript.
All three manuscripts will be submitted to international journals. The third manuscript was also part of Bo Galles thesis, defended in June 1999.
Preliminary results have been presented at the RVF/AFN/LTU symposium in Luleå 6-8 October 1998 (Galle et al. 1998), and at the Sardinia ’99 Seventh International Waste Management and Landfill Symposium in Cagliari, Italy, 4-8 October 1999 (Galle et al. 1999).
References
Bergamaschi, P., Lubina, C., Konigstedt, R., Fischer, H., Veltkamp, A.C. & Zwaagstra, O. 1998. Stable isotope signatures (d13C, dD) of methane from European landfill sites. J. Geophys. Res. Atm. 103 (D7): 8251-8265.
Boeckx, P., van Cllemput, O. &Villaralvo, I. 1996. Methane emission from a landfill and the methane oxidising capacity of its covering soil. Soil Biol. Biochem.
28:1397-1405.
Bogner, J., Spokas, K. & Jolas, J. 1993. Comparison of measured and calculated methane emissions at Mallard Lake landfill, Dupage county, Illinois, U.S.A.
In Sardinia 93, Proceedings of the fourth international landfill symposium, pp.
05-616. CISA, Cagliari, Italy.
Börjesson, G. 1997. Methane oxidation in landfill cover soils. Doctoral dissertation. Agraria 44, Swedish University of Agricultural Sciences, Uppsala.
Börjesson, G. & Svensson, B.H. 1997a. Seasonal and diurnal methane emissions from a landfill and their regulation by methane oxidation. Waste Manage. Res. 15 (1):3354.
Börjesson, G. & Svensson, B.H. 1997b. Effects of a gas extraction interruption on emissions of methane and carbon dioxide from a landfill, and on methane oxidation in the cover soil. J. Environ. Qual. 26: 1182-1190.
Börjesson, G. & Svensson, B.H. 1997c. Nitrous oxide emissions from landfill cover soils in Sweden. Tellus 49B: 357-363.
Börjesson, G., Sundh, I., Tunlid, A. & Svensson, B.H. 1998. Methane oxidation in landfill cover soils, as revealed by potential oxidation measurements and phospholipid fatty acid analyses. Soil Biol. Biochem. 30:1423-1433. Born, M., Dörr, H. & Levin, I. 1990. Methane consumption in aerated soils of the
temperate zone. Tellus 42B:2-8.
Cressie, N. A. C. 1993. Statistics for Spatial Data. New York, John Wiley & Sons, 900pp. Deutch, C. V. & Journel, A.G. 1992. GSLIB: Geostatistical Software Library and User's
Guide. New York, Oxford University Press, 338pp.
Galle, B. 1999. Development and Application of Methods based on DOAS and FTIR Absorption Spectroscopy for Atmospheric Research. Dissertation. Chalmers University of Technology, Göteborg.
Galle, B., Klemedtsson, L. &Griffith, D.W.T. 1994. Application of a Fourier Transform IR system for measurement of nitrous oxide fluxes using micrometeorological methods, an ultra chamber system, and conventional field chambers.
Galle, B., Samuelsson J., Börjesson, G., Danielsson, Å & Svensson, B. 1998. Methane fluxes from Swedish landfills. In Svenskt symposium om upplagsforskning 1998 (Ed. A. Lagerkvist),p. 75-76. RVF rapport 1998:10.
Galle, B., Samuelsson, J., Svensson, B.1999. Measurement of methane emissions from landfills using FTIR spectroscopy. Proc. Sardinia ‘99 Seventh International Waste Management and Landfill Symposium in Cagliari, Italy, 4-8 October 1999.
Happell, J.D. &Chanton, J.P. 1993. Stable isotopes as tracers of methane dynamics in Everglades marshes with and without active populations of methane oxidizing bacteria. J. Geophys. Res. Atm. 98 (D8): 14771-14782.
Hovde, D.C., Stanton, A.C., Meyers, T.P. & Matt, D.R. 1995. Methane emissions from a landfill measured by eddy correlation using a fast-response diode laser sensor. J. Atmos. Chem. 20 (2): 141-162.
IPCC 1995. Climate Change 1995. The Science of Climate Change. Cambridge University Press, 1996.
Johnson, E., Klein, M.& Mickus, K. 1993. Assessment of the feasibility of utilizing Landsat for detection and monitoring of landfills in a state wide GIS. Environ. Geol. 22:129-140.
Journel, A.G. & Huijbregts, C.J. 1978. Mining geostatistics. London, Academic Press, 600pp.
260Kightley, D., Nedwell, D.B. & Cooper, M.1995. Capacity for methane oxidation in landfill cover soils measured in laboratory-scale soil microcosms.
Appl. Environ. Microbiol. 61:592-601.
Liptay, K., Chanton, J.P., Czepiel, P. & Mosher, B. 1998. Use of stable isotopes to determine methane oxidation in landfill cover soils. J.Geophys. Res. Atm. 103 (D7): 8243-8250.
Mancinelli, R.L. & McKay, C.P. 1985. Methane-oxidizing bacteria in sanitary landfills.
In Biotechnical Advances in Processing Municipal Wastes for Fuelsand
Chemicals (Ed. A.A. Antonopoulos), pp. 437-450. Report ANL/CNSV-TM167, Argonne National Laboratory, Chicago, USA.
Matheron, G. 1963. Principles of geostatistics. Economical Geology 58: 1246-1266. Nozhevnikova, A.N., Lifshitz, A.B., Lebedev, V.S. & Zavarzin, G.A. 1993. Emission of
methane into the atmosphere from landfills in the former USSR. Chemosphere 26:401-417.
95, Proceedings of the fifth international landfill symposium, pp. 495-506. CISA, Cagliari, Italy.
RVF 1996. Deponigas. Teknik och produktion vid svenska anläggningar idag. Rapport RVF 1996:7. (in Swedish)
Tohjima, Y. & Wakita, H. 1993. Estimation of methane discharge from a plume: A case of landfill. Geophysical Res. Lett. 20: 2067-2070.
Whalen, S.C., Reeburgh, W.S. & Sandbeck, K.A. 1990. Rapid methane oxidation in a landfill cover soil. Appl. Environ. Microbiol. 56:3405-3411.