ACTA UNIVERSITATIS
UPSALIENSIS
Digital Comprehensive Summaries of Uppsala Dissertations
from the Faculty of Pharmacy 261
In vitro
evaluation of formulations
used in the treatment of
hepatocellular carcinoma
EMELIE AHNFELT
ISSN 1651-6192 ISBN 978-91-513-0498-4
Dissertation presented at Uppsala University to be publicly examined in A1:111a, BMC, Husargatan 3, Uppsala, Thursday, 20 December 2018 at 09:15 for the degree of Doctor of Philosophy (Faculty of Pharmacy). The examination will be conducted in English. Faculty examiner: Associate Professor Jesper Østergaard (Department of Pharmacy, University of Copenhagen).
Abstract
Ahnfelt, E. 2018. In vitro evaluation of formulations used in the treatment of hepatocellular
carcinoma. Digital Comprehensive Summaries of Uppsala Dissertations from the Faculty of
Pharmacy 261. 61 pp. Uppsala: Acta Universitatis Upsaliensis. ISBN 978-91-513-0498-4.
Hepatocellular carcinoma (HCC) causes ~ 600,000 deaths annually, making it the second most deadly cancer form. HCC is classified into five stages and for the intermediate HCC treatment, the two most commonly used drug delivery systems (DDSs) are lipiodol-based emulsions and drug-eluting beads. The aims of this thesis were to develop in vitro methods suitable for studying these DDSs. It is important to investigate the release mechanisms and release rates with relevant
in vitro methods, as this can improve the understanding of the in vivo performance. Miniaturized in vitro methods with sample reservoirs separated from the release medium by a diffusion barrier
were developed and shown to be suitable for studying drug release from particle DDSs (Paper I). In Paper II these methods were further developed and used to study the release of doxorubicin (DOX) from the clinically used drug-eluting beads. DOX release rates were affected by the method set-up and the characteristics of the release medium. The choice of method and volume of release medium could improve the in vivo-likeness of the in vitro release profiles. Applied theoretical models suggested a film-controlled type of DOX release mechanism from the beads when self-aggregation, DOX-bead interaction, and DOX deprotonation were taken into account. A micropipette-assisted microscopy method was used to further improve the understanding of the release mechanism of amphiphilic molecules from the beads (Paper III). A detailed analysis suggested an internal depletion-layer model dependent on molecular self-aggregation for the release. It was further suggested that a simple ion-exchange mechanism is unrealistic in physiological conditions.
The important pharmaceutical factors for the emulsion-based formulations were investigated in Paper IV. DOX solubility, lipid phase distribution, and emulsion stability increased when the contrast agent iohexol was added. Also, an increase in release half-life (h) was observed from emulsions with iohexol.
The in vitro methods and theoretical models presented in this thesis can be used during development and optimization of future DDSs.
Keywords: Drug delivery system, Doxorubicin, Microgel, Emulsion, Hepatocellular
carcinoma
Emelie Ahnfelt, Department of Pharmacy, Box 580, Uppsala University, SE-75123 Uppsala, Sweden.
© Emelie Ahnfelt 2018 ISSN 1651-6192 ISBN 978-91-513-0498-4
Work, work, work, work, work, work -Rihanna
List of Papers
This thesis is based on the following papers, which are referred to in the text by their Roman numerals.
I Ahnfelt, E., Sjögren, E., Axén, N., Lennernäs, H. (2015) A
min-iaturized in vitro release method for investigating drug-release mechanisms. International Journal of Pharmaceutics, 486:339– 349.
II Ahnfelt, E., Sjögren, E., Hansson, P., Lennernäs, H. (2016) In
vitro Release Mechanisms of Doxorubicin From a Clinical Bead
Drug-Delivery System. Journal of Pharmaceutical Sciences, 105:3387–3398.
III Ahnfelt, E., Gernandt, J., Y. Al-Tikriti., Lennernäs, H., Hansson,
P. Single bead investigation of a clinical drug delivery system – a novel release mechanism. Journal of Controlled Release, In
press.
IV Ahnfelt, E., Degerstedt, O., Sjögren, E., Lilienberg, E., Hansson,
P., Lennernäs, H. In vitro evaluation of lipiodol-based emulsions in clinical use. Submitted.
Papers not included in the thesis:
i. Dubbelboer, I. R., Lilienberg, E., Ahnfelt, E., Sjögren, E., Axén, N., Lennernäs, H. (2014) Treatment of intermediate stage hepato-cellular carcinoma: a review of intrahepatic doxorubicin drug-de-livery systems. Therapeutic Dedrug-de-livery, 5(4):447-466
ii. Frenning, G., Ahnfelt, E., Sjögren, E., Lennernäs, H. (2017) Computational fluid dynamics (CFD) studies of a miniaturized dissolution system. Int. J. Pharm, 521; 274-281
Contents
Introduction ... 9
Hepatocellular carcinoma and its treatment ... 9
Drug delivery systems ... 11
Lipiodol-based emulsions ... 12
Hydrogel microparticle ... 13
Doxorubicin ... 15
In vitro release methods ... 15
Theoretical release models ... 17
Aims of the thesis... 19
Methods ... 20
Compounds studied ... 20
Drug delivery systems investigated ... 21
In vitro methods ... 22
µDiss ... 22
Micropipette-assisted microscopy ... 24
Theoretical models employed ... 25
Investigations of emulsion-based formulations ... 27
Results and discussion ... 28
In vitro methods ... 28
Pore size ... 28
In vitro release investigations with the µDiss ... 30
Micropipette-assisted microscopy method ... 32
Theoretical models ... 34
Emulsion-based formulation properties ... 40
Conclusion ... 45
Concluding remarks ... 47
Populärvetenskaplig sammanfattning ... 48
Acknowledgments... 50
Abbreviations
AMPS acrylamide methylpropanesulfonate BCLC Barcelona clinic liver cancer classification BCS biopharmaceutics classification system
cacb critical aggregation concentration inside the bead
cmc critical micelle concentration DDS drug delivery system
DOX doxorubicin
EPR enhanced permeability effect HCC hepatocellular carcinoma IR immediate release MR modified release PB Poisson-Boltzmann PBBP Physiological-based biopharmaceutical PBPK Physiological-based pharmacokinetic PBS phosphate buffer saline
PEEK polyether ether ketone PVA polyvinyl alcohol
Introduction
Hepatocellular carcinoma and its treatment
Primary liver cancer is dominated by hepatocellular carcinoma (HCC), which contributes to 70 – 90% of primary liver cancers.1-3 HCC has an incidence
mortality ratio of 0.95 and globally it causes ~ 600,000 deaths annually, making it the second most deadly cancer.2, 4 Twice as many men as women
suffer from HCC, and the disease is more common in Asia and Africa com-pared to Europe and North America.4, 5 HCC development is often preceded
by development of liver cirrhosis. Therefore, the risk factors of HCC and liver cirrhosis, such as infection with hepatitis B and/or C virus, high alcohol intake, nonalcoholic steatohepatitis, and aflatoxin intake, are similar.3, 4 Despite the
successful development of novel therapies for the treatment of hepatitis, the incidence rate of HCC is rising, which is attributed to advancing age, diabetes, and obesity.1
Since HCC often develops in a diseased and cirrhotic liver, the remaining liver function is important in the treatment of HCC. The liver function is often classified using the Child-Pugh A – C classification, where A is characterized by a well-preserved liver function and C by a poor function.1 Several staging
systems have been proposed for providing a clinical classification system of HCC, with the Barcelona-Clinic Liver Cancer (BCLC) classification being the most commonly used.1 BCLC classifies HCC patients into 5 stages, 0, A, B,
C, and D, where 0 is very early and D describes an advanced terminal stage. The recommended treatment depends on tumor progression and the liver function. Tumor resection, liver transplantation, and local ablation with radiofrequency or percutaneous ethanol injection, are available treatment options for BCLC 0 – A.1 BCLC B is described as an intermediate stage with
multinodular tumors and a Child-Pugh A-B function of the liver. Oral multi-kinase inhibitors (sorafenib, regorafenib, and lenvatinib) are approved for ad-vanced HCC, whereas palliative care is recommended for the terminal stage, BCLC D.1, 6 The recommended treatment for the intermediate-stage HCC
pa-tients, and the focus of this thesis, is the intra-arterial infusion of a drug delivery system (DDS) loaded with cytostatic agent(s).1
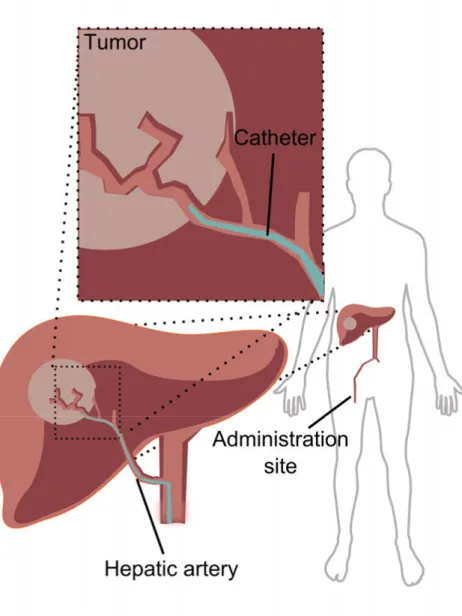
The DDS is administered in an interventional oncology procedure called transarterial chemoembolization (TACE) (Figure 1). HCC is a solid and highly vascularized tumor that receives 90% of the blood supply from the hepatic artery, compared to normal liver tissue where 75 – 80% of the blood
supply originates from the portal vein.7 The difference in blood supply
between tumor and the healthy liver is the rationale for TACE.1, 8
Figure 1. Schematic illustration of the transarterial chemoembolization (TACE)
administration site in hepatocellular carcinoma (HCC) treatment. The tumor receives a majority of its blood supply from the hepatic artery, compared to the healthy liver, which receives the majority of its blood supply from the portal vein. This difference is the rationale for TACE, where local drug delivery from a drug delivery system (DDS) with dual action – chemotherapy and embolization – is administered through
Compared to no treatment, TACE increases the median survival from 16 to 20 months.9 The functions of the DDSs used in TACE are dual. The DDSs release
the cytostatic drug and embolize the treated artery, which decreases the supply of oxygen and nutrients to the tumor. TACE decreases the systemic toxicities of the used cytostatic agents, and the administration of the DDS is enabled using contrast agents and radiological-image guidance.1, 8, 10, 11
Drug delivery systems
A pharmaceutical formulation is often needed for enabling efficient delivery of any drug to the body and site of action. Some formulations are designed to release its drug content immediately, while other release the drug over a prolonged time. There are several different pharmaceutical formulations available. The most common ones are tablets intended for oral use.12 However,
other formulations, such as capsules, ointments, creams, gels, suspensions, and suppositories are all in clinical use. After oral administration, the drug must be dissolved in the gastrointestinal (GI) lumen, permeate across membranes, such as the gut-wall in order to be absorbed, and then avoid first-pass metabolism in the gut and liver to reach the systemic blood compartment. If a drug is administered through the parenteral route it does not have to cross membranes to be systemically available. However, after intra-arterial administration it will be immediately available for systemic action.
Cytostatic agents can be administered via the parenteral route to minimize adverse events related to GI-exposure, and to ensure reproducible bioavailability. There are several DDSs currently used to deliver cytostatic agents to the intended site of action, which is the tumor.1, 13 The tumor
microenvironment is characterized by low pH (6.2–6.9) and leaky blood vessels, which by the enhanced permeability effect (EPR) can induce accumulation of small particles inside the tumor.13-17 The EPR effect is one of
the major driving forces behind the development of nano-formulations, such as liposomes in tumor treatment. These have been shown to decrease critical adverse events related to the cytostatic agents.13, 15, 16 Currently, there are two
nano-sized liposomal DDSs containing doxorubicin (DOX) on the European market, Caelyx and Myocet. Both are indicated for the treatment of breast cancer.13, 15, 16
The recommended treatment for the intermediate-stage HCC is TACE with a DDS loaded with cytostatic agent(s).1 Similarly to the use of nano-
formulations the goal for using TACE is to increase intra-tumor concentrations of the cytostatic agent and to reduce adverse events.1 The two
most often used DDSs are lipiodol-based emulsions and hydrogel micro- particles.1, 10
Lipiodol-based emulsions
Even though emulsions have a complex nature and are thermodynamically unstable, they have applications in a wide variety of pharmaceutical products, such as topical, subcutaneous and parenteral formulations.18, 19 The lipid phase
of the emulsions used in TACE is lipiodol. In the 1980’s X-ray investigations showed that lipiodol accumulated in tumor tissue at least up to three days after administration.20 This lead to the implementation of lipiodol-based emulsions
in treatment of intermediate HCC.21, 22 The efficacy and safety of
lipiodol-based emulsions has been evaluated in a systematic review including ~ 10,000 patients. After TACE treatment, the overall survival rate was 70% after one year and 32% after five years.21
Lipiodol is an ethylated ester derived from poppy seed oil, with 73% lineolic, 14% oleic, 9% palmitic, and 3% stearic acid. It is iodinated with an iodine concentration of 480 mg iodine/ml.23 Despite its widespread use, the
exact chemical structure with regards to the positioning of the iodines is unknown.24
The aqueous phase of the lipiodol-based emulsions often contains cyto-static agents and other components, such as contrast agents used to visualize the administration.1, 8 The addition of contrast agents generates more stable
emulsions, because they equalize the densities of the lipid and aqueous phases.10, 22, 25
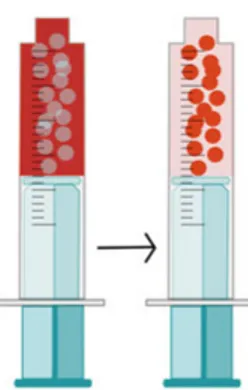
The emulsion is prepared ex tempore by mixing the emulsion components just prior to administration (Figure 2).8, 22, 25 The mixing is often performed by
connecting two syringes to each other and pumping the components back and forth until an emulsion is formed.22, 26 The intra-hepatic administration is often
lobular and the emulsion generates partial and temporary embolization of treated arteries.27 This partial embolization, which causes a reduction or
blockage in blood flow, has been described as lipiodol’s mechanism of ac-tion.27 A full embolization can be achieved by the addition of
embolization-material, such as gelatin-sponge, but the benefits of this addition has been debated.22, 28
DOX, epirubicin, cisplatin, and miriplatin are the most commonly used cytostatic agents in lipiodol-based emulsions. They can be used in single- or multiple-drug regimes.21 The drug release rates in vitro and in vivo depend on
emulsion stability, aqueous-to-lipid phase ratio, preparation technique, and emulsion composition.10, 22, 26, 29, 30 The clinically used lipiodol-based
emul-sions are not standardized and in the clinical reports there is lack of information on, or large variations in; preparation method, aqueous-to-lipid phase ratio, and aqueous phase composition.10, 22, 25, 26, 31-50 This makes
Figure 2. Emulsion ex tempore preparation prior intra-arterial dosing; the aqueous
phase is illustrated by the red solution and lipiodol is illustrated by the yellow solution. The emulsions were prepared by pumping lipiodol and the aqueous phase back and forth between the two connected syringes.
Hydrogel microparticle
Hydrogel microparticles could be used as a DDS for the delivery of cytostatic drugs, proteins, and peptides, since they protect the drug from degradation and the environment from the drug.51, 52 There are several DDS microparticles
in clinical use, for example, DC bead®, HepaSphereTM, TANDEMTM, and
LifePearlTM.53 DC bead® is a hydrogel microparticle used in TACE. The beads
are currently available in three size distributions, covering a range of 70 – 700 µm. It is considered as an ion-exchange hydrogel, consisting of polyvinyl alcohol (PVA) and integrated with negatively charged 2-acrylamido-2-methylpropanesulfonate (AMPS).54 The beads are classified as a medical
de-vice and are loaded with DOX or irinotecan before intra-hepatic administration.54, 55 When loaded with irinotecan, the beads are used for
treating metastatic colorectal cancer. If the beads are loaded with DOX, the indication is intermediate-stage HCC. The loading of the intended dose is in accordance with the manufacturer’s instruction.56 In short, the cytostatic agent
agent can be loaded into the beads (Figure 3). During loading, sodium ions will be replaced by drug ions through an ion-exchange.54 The loading time is
dependent on the size of the bead and if there is any stirring or shaking applied to the vessel containing the beads. According to the manufacturer, beads of 70 – 150 µm are considered completely loaded after 3 hrs, whereas beads of 500 – 700 µm require up to 24 hrs for complete loading.
Figure 3. Loading doxorubicin (DOX) to DC bead®. DOX is dissolved in ion-free water and when the beads are added, it can be loaded into the beads. During the loading, sodium ions will be replaced by DOX ions through an ion-exchange pro-cess.54
The loaded beads are administrated as close to the tumor as possible. As the beads are non-biodegradable, they generate a permanent embolization of the treated arteries. If the intended dose does not cause full embolization, unloaded beads can be used to achieve complete blockage of the blood flow. The embolization is suggested to be part of the anti-tumor effect.1
Compared to the variability of the lipiodol-based emulsions, the beads have been described to generate reproducible and predictable results in blood vessel blockage, and a prolonged drug release.53 Drawbacks of the bead DDS is that
it is difficult to assess if the treatment is successful, because the beads cannot be monitored with any imaging technique after administration. Also, the permanent embolization of this DDS makes it impossible to treat the same vessel several times, which is possible with the lipiodol-based emulsion.
effects compared to the lipiodol-based emulsions.53, 57 However, both
lipiodol-based emulsions and the beads result in similar survival rates.53, 57, 58
Doxorubicin
Several cytostatic agents, such as DOX, epirubicin, cisplatin, and miriplatin are currently used in the treatment of HCC.21 Since DOX can be loaded on
both lipiodol-based emulsions and the beads, it was chosen as a model sub-stance in Paper II – IV. DOX is used as a cytostatic agent for breast and lung cancer. It is also used off-label to treat liver cancer.10 The suggested
mechanisms of action of DOX are the binding of DOX to DNA and the DNA-binding protein topoisomerase I and II.59, 60 At physiological conditions, the
amphiphilic DOX (molecular mass = 543.52 g/mol) exists both as a protonated monovalent cation and a deprotonated neutral entity.61, 62 The two pKs of DOX
depend on the experimental conditions. At 37 °C, and an ionic strength of 0.15, it has two physiologically relevant pKa, one at 7.5 (phenol) and one at
9.5 (amine).62 The phenol pK
a varies between 7 and 8, depending on the
experimental conditions.61, 62
Dimers form when the DOX concentration is ~ 10 µM, while larger aggregates with 40 DOX-molecules form at 1 mM.63 When the concentration
of DOX is further increased, both stacking and rod-like micelles of DOX ap-pear.59, 63-66 Also, the addition of salt, such as NaCl, results in highly viscous
gels containing DOX bundles.67 It is suggested that hydrogen bonds between
DOX molecules induce its self-aggregation.59, 67 The partitioning
(octanol-to-buffer (pH 7.3)) of DOX is also dependent on DOX concentrations, with log partitioning of ~ 2 below 20 µM and ~ 0.4 at 500 µM.62 This indicates that
DOX is mostly aggregated in the aqueous phase. DOX is a rigid complex molecule and it is sensitive to light and changes in pH. Its self-aggregating properties also makes it an adhesive molecule.68, 69 Despite these challenging
properties, it is often used as the model substance of choice in novel DDSs intended for tumor treatment.
In vitro release methods
In vitro investigations of drug release from a DDS are important throughout
the drug innovation and development process. For oral DDSs compendial methods such as paddle, basket, and continuous-flow are used (Figure 4).70
For the flow-through method, the sampling can be both on- and off-line. The amounts released in the basket, paddle, and dialysis-membrane methods are usually analyzed off-line.70 The flow-through method is the compendial in
vitro release method that is most often used for parenteral formulations. It can
72 The drug release from non-solid DDS can also be investigated using dialysis
membrane methods.73-75 No standardizations exist in the in vitro release
methods of the highly variable parenteral DDSs, which leads to a large variation in the literature guidelines for the in vitro release testing.76
Figure 4. Schematic illustration of dissolution methods. A) Basket method. B)
Pad-dle method. C) Dialysis membrane method. D) Flow-through method.
The compendial methods use relatively large amounts of DDS and release medium (200-900 ml). This enables measurements under sink-conditions. On the other hand, it can be limiting if there is only a small amount of DDS available.70, 77 Also, the release investigation of cytostatic molecules in
compendial methods generate large volumes of waste, which is problematic from safety and environmental perspectives. The use of miniaturized in vitro methods decrease the used amounts of sample and release media.77-79 There
are several commercially miniaturized methods available, such as the SDi2 and T3, both from Sirius Analytical, as well as the µDiss profiler (pION Inc, USA).79-81 The µDiss is a miniaturized dissolution apparatus developed to
measure drug solubility (Figure 5). This apparatus enables continuous reading and collection of drug absorbance in the range of 200 – 700 nm, using fiber optic dip-probes connected to a UV-detector.78, 79
The UV-probe is placed centrally into 25-ml glass vials, in which dissolution or release takes place. The background turbidity can be reduced by applying the second-derivate spectrum setting to enhance peaks and reduce baseline shifting.82, 83 With Mini-IDRTM discs the µDiss can determinate the
intrinsic dissolution rate, and the combination of the µFluxTM and the µDiss
enables evaluations of the disappearance and appearance rate over a membrane.84
Figure 5. Schematic illustration of the µDiss (pION Inc, USA). A) Point of
absorp-tion measurement in the UV-dip probe of the µDiss. B) Magnetic stirrer for stirring of release medium. C) 25 ml glass vial. D) Heating block for temperature adjustment of release medium.
Theoretical release models
Theoretical release models are useful tools in pharmaceutical development. They can be applied to investigate and characterize drug release mechanisms from DDSs.85-87 Release models can be classified as empirical models, which
do not describe the mechanism(s) of release, but merely the rate of release, or as mechanistic models that provide information about the mechanism(s) of release.88-90 A drug can be released from a DDS in several ways and drug
diffusion is often involved in the release.86, 87, 89 Even if there are several steps
involved in the release of a drug from a DDS, the model can often be simplified to describe only the rate-limiting step.85 The geometry and material
of the DDS, drug solubility, interactions with the DDS, and swelling and/or erosion of the DDS are important factors of the release mechanism(s).85
More advanced models, such as physiologically-based pharmacokinetic (PBPK) models, integrate information on physiology and the properties of the investigated drug. This modeling approach enables simulations of overall drug disposition and organ-specific exposure.
Our group has developed physiologically-based biopharmaceutical (PBBP) models, which also account for the biopharmaceutical aspects of drug delivery.91-93 The inclusion of biopharmaceutical factors, such as solubility,
dissolution, partitioning, and particle size, to the models could increase the mechanistic understanding and lead to effective DDSs design.94 The proposed
PBBP concept was recently recognized by a US workshop report.95
The combination of in vitro release methods, theoretical release models, and PBBP, can lead to a synergistic effect when implemented in evaluation of existing DDSs, or in the design of novel DDSs.93
Aims of the thesis
The aims of this thesis were to develop in vitro methods suitable for studying the release of cytostatic agents used in parenteral formulations. The in vitro release profiles were used to investigate the release mechanisms in order to increase the understanding of important formulation-factors. The specific aims were:
To develop a miniaturized in vitro release method suitable for in-vestigation of the release of cytostatic drugs from a DDS and to examine its in vivo predictive ability. Furthermore, to investigate the release mechanism of the DDSs and simulate an in vivo response based on the in vitro release profiles.
To investigate important factors in—and the mechanism of—DOX release from the bead DDS. Additionally, the in vivo-likeness of the
in vitro release profiles were examined.
By experimental and theoretical models improve the understanding of the release mechanism of amphiphile molecules from the bead DDS.
To investigate the important pharmaceutical factors for emulsion-based formulations, such as emulsion-stability, DOX lipid-phase distribution, and the release of DOX from lipiodol-based emulsions.
Methods
In this part of the thesis the compounds, DDSs, experimental methods and models are briefly described. The reader is referred to the included papers for further details.
Compounds studied
The compounds used in this thesis are depicted in Figure 6. The substance with clinical relevance for the treatment of HCC—DOX—was investigated in Paper II, III, and IV. In Paper I model substances were used due to the cytostatic properties of DOX. The molecules were chosen to represent high (class I) and low (class II) solubilities according to the biopharmaceutics classification system (BCS) (Paper I).96 Two molecules were negatively
charged and two positively charged and their lipophilicity covered a three-fold range. They were all considered to be less harmful than DOX – an advantage in the method-development process. In Paper III, the six molecules were chosen based on their amphiphile properties described by their critical micelle concentration (cmc).
Figure 6. Molecular structures of the studied compounds in Papers I – IV.
Drug delivery systems investigated
In Paper I the in vitro release profiles of eight clinically used DDSs were investigated. Two of the DDSs were non-solid formulations (an oral suspension and a gel for dermal application), two were oral modified release (MR) tablets, and four were oral immediate release (IR) tablets.
In Paper II and III the clinically used microgel bead-based DDS was studied. Paper IV focused on four clinically relevant lipiodol-based emulsions.
The aqueous phase compositions of the emulsions were: water and lipiodol (W/L), saline 0.9% and lipiodol (S/L), iohexol and lipiodol (I/L), and a mixture (v/v) of iohexol (85%) and water (15%) (IW/L). The emulsions had an aqueous-to-lipid phase ratio of 1:0, 1:1, 1:2, 1:3, and 1:4.
In vitro methods
µDiss
In all papers (I – IV) a µDiss profiler (pION Inc, USA) was used to analyze the in vitro release of a molecule from its respective DDS. Each channel of the µDiss was calibrated individually with stock solutions of the molecule of interest. The concentration was determined as the area under the concentration–wavelength curve of the second-derivative spectrum.
The µDiss has been used to study the drug release from the investigated formulations in Papers I, II, III, and IV. However, the experimental set-ups have been modified and adjusted from free flowing to sample reservoir and dialysis tube to suit the investigated DDS (Figure 7).
Figure 7. Schematic description of the four modified and developed experimental
set-ups applied in the µDiss profiler. 1) Point of concentration measurement. 2) For-mulation. 3) Magnetic stirrer used to stir the release medium. A) The 3 mm sample reservoir (SR3) used in Paper I. B) The sample reservoir (SR6 and SR8) used in Pa-per II. C) Free-flowing method used in PaPa-per II and III. D) Dialysis-membrane method used in Paper IV.
mm deep and 3 mm in diameter, with a sample volume of 21 µl. The DDS was placed in the cavity and retained with a diffusion barrier held in place by a ring-shaped magnet. The diffusion barriers that were investigated were: (i) a nylon mesh filter (pore size 150 µm), (ii) a polyvinylidene fluoride filter (pore size 0.45 µm) and (iii) a cellulose-based dialysis membrane, approximate pore size 0.003 µm (molecular weight cut-off 12-14 kDa). The resulting release profiles from the miniaturized in vitro method were compared to historical release data of each DDS.
In Paper II the miniaturized in vitro method was further improved by using the inert material polyether ether ketone (PEEK) to manufacture sample reservoirs (Figure 7B). Also, the screw-cap assembling procedure (see Paper II for details) of the sample reservoir was improved compared to the one used in Paper I. Two dimensions of sample reservoirs were manufactured, one had a diameter of 6 mm, a depth of 2 mm, and a cavity volume of 57 µl; the other had a diameter of 8 mm, a depth of 1 mm, and a cavity volume of 50 µl. In Paper II a free-flowing method where the DDS was not contained inside a cavity was studied (Figure 7C). The impact on the release of DOX from the beads of the used in vitro release method, i.e. the 6 mm and 8 mm sample reservoirs, and the free flowing method, were investigated in Paper II. Also, the effect on DOX release rates from the beads by release medium factors, such as release medium composition, temperature, and stirring rate were in-vestigated.
In Paper IV, the µDiss was used to study the release of DOX from four clinically relevant lipiodol-based emulsions. The lipid part of the formulation can interfere with the UV-analysis. Therefore, a dialysis membrane (12-14 kDa) was used to prevent the formulation from spreading. The lipiodol-based emulsions were placed inside the dialysis tube, which was placed inside the glass vial in a free-flowing set-up (Figure 7D).
Micropipette-assisted microscopy
A schematic illustration of a previously described micropipette-assisted microscopy technique used to study the bead-volume change and morphology of a single bead in Paper III is shown in Figure 8.97
Figure 8. A schematic illustration of the micropipette-assisted microscopy method.
The selected solution is pumped by single-pass through the flow pipette at 8 ml/min, giving a continuous flow over the investigated bead. The bead is positioned inside the flow pipette (2 mm in diameter). A micropipette and the suction of a
microinjector enables holding of the bead (70 – 500 µm in diameter) inside the flow pipette. The bead is monitored using light or fluorescence microscopy. The solutions used in the method is schematically illustrated in the top-right corner.
A Petri dish was placed on an optical light microscope (Olympus Bx-51, Olympus, Japan) equipped with a DP digital camera (Olympus, Japan) that enabled analysis of the bead in a microscopic picture. A peristaltic pump provided a continuous fluid flow rate of 8 ml/min through a 2 mm diameter glass flow-pipette. The bead was held in place inside the flow pipette with a micropipette combined with a microinjector, which was used to create suction
investigation of the distribution of molecule aggregates inside the bead, which can be difficult to assess using only light microscopy.
Theoretical models employed
In this section, the used theoretical models will be briefly described. For a full description of the models, the reader is referred to the respective papers.
The Weibull function can be fitted to several different release profiles, and it is useful in order to compare drug release profiles from various matrices.87
Monte Carlo simulations in combination with the Weibull function has been performed to suggest release mechanisms depending on the predicted values from the Weibull function.88 These release profiles of the miniaturized and
historical data were analyzed with the Weibull function to suggest release mechanisms for the investigated DDSs. The in vitro release profiles were also used together with GI-Sim to simulate in vivo plasma concentration vs time profiles.94
In Paper II the effect of stirring rates on DOX release from the beads in the free-flowing method was used to investigate the release mechanism(s). Two theoretical models were used; the film control and internal depletion-layer models. Each release model was based on the assumption that DOX-mono-mers were in local equilibrium with micelle-like aggregates of DOX inside the beads.63-65, 67 In the film-control model, DOX-aggregates inside the beads
were assumed to be homogeneously distributed in the bead throughout the release process (Figure 9). The release rate was controlled by the mass transfer of released DOX-monomers from the bead boundary across the stagnant layer film to the bulk phase of the release medium.
In the internal depletion-layer model DOX-aggregates were assumed to be heterogeneously distributed inside the beads (Figure 9). A shell, i.e. a depletion layer, free from DOX aggregates, was formed within the beads during the release process. During DOX release the core was assumed to have the same composition as the initially homogeneous bead. Furthermore, the effect of salt addition on the equilibrium between protonated and deprotonated DOX was investigated with the Poisson-Boltzmann (PB) cell model.98 Two
scenarios were considered: a) at the beginning of the experiment the initial DOX content in the beads was in local equilibrium with the solution; and b) at the end of the release experiment the beads were in equilibrium with the solution. The deprotonated form of DOX dominates in the aggregates even when the protonated form dominates in the solution, both at the start (a) and the end (b) of the release experiments. The effect of salt addition on DOX dimerization in the solution was investigated with a dimerization model that provided a qualitative account of DOX dimerization.
The film and internal depletion-layer models of Paper II describe the release of DOX in the free-flowing method. A limitation of the free-flowing
method is that the fluid velocity of the release medium relative that of the beads is unknown. Thus, it was used as a fitting parameter in the models. In Paper III, drug release from the beads was investigated in the micropipette-assisted microscopy method, which provides a controlled fluid flow during release (Figure 8). Therefore, the fluid flow can be calculated and does not need to be fitted. Also, no presumptions were made about the initial distribution of amphiphile within the bead during release, as was the case in Paper II. The amphiphile could exist as free monomer-ions of permanent charge, or as aggregates of a fixed aggregation number, similar to in Paper II. In Paper III, the mobile components of the system are the free amphiphile monomer-ions and the monovalent salt-ions. These three components can move through the system unaffected by the sterical hindrance of the bead polymer-network. The movements of the mobile ions were electrostatically coupled to each other, meaning that the monomers could only move if they did so accompanied by another charged species. The total charge of each bead was calculated from the experiments. The only variable parameter in the model was the critical aggregation concentration of the amphiphiles inside the bead (cacb), which describes the amphiphile concentration needed to induce
the formation of aggregates inside the bead.
Figure 9. Both film control and internal depletion-layer models are based on the
as-sumption that doxorubicin (DOX) forms micelle-like aggregates inside the bead. These aggregates are assumed to be in local equilibrium with DOX-monomers. In the film-control model (left) DOX is assumed to be homogenously distributed throughout the bead during the release process. In the internal depletion-layer model (right), DOX is assumed to be heterogeneously distributed throughout the release process. In this model, the bead will be divided into a DOX aggregate rich core and a shell without aggregates.
Investigations of emulsion-based formulations
Pharmaceutical factors of importance for the in vivo performance of the emulsion-based formulations were investigated in Paper IV. The solubility of DOX in phosphate buffer saline (PBS) and in the emulsion components were investigated in a shake-flask method.99 The distribution of DOX from the
aqueous phase of the emulsion to the lipid phase was investigated for four aqueous phase compositions at an aqueous-to-lipid phase ratio of 1:4. DOX distribution was analyzed after 15 min and 1 h, respectively. The stability of the emulsions was investigated both at the macroscopic and microscopic level by visual inspection. The microscopic investigation enabled measurements of emulsion droplet-size. The release of DOX from the emulsions was measured in a modified miniaturized in vitro method with the dialysis tube set-up (Figure 7D).
Results and discussion
In vitro methods
Pore size
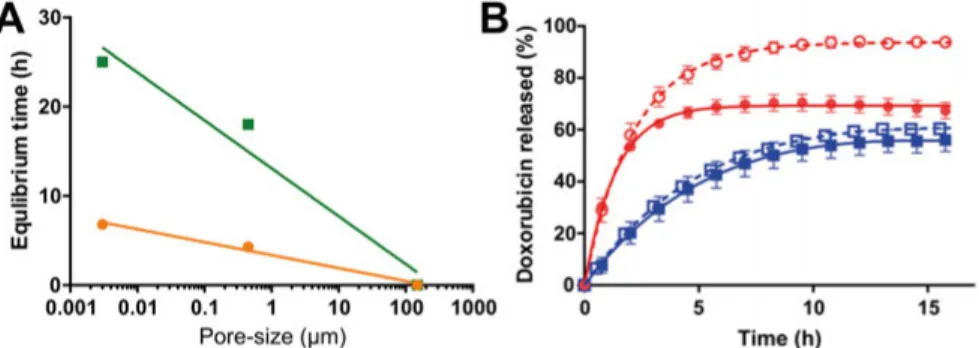
In Paper I, a miniaturized in vitro release method consisting of a sample reservoir was developed. In Paper IV, the dialysis tube was used to study the release of DOX from emulsions. The pore-size and material of the used diffusion barrier was shown to have an impact on the drug release rate in both Papers I and IV (Figure 10). In Paper I, the time needed to reach equilibrium through the nylon mesh filter, 150 µm pore size, was more than a hundred times shorter than that of the other two diffusion barriers: the polyvinylidene fluoride filter (with a pore size of 0.45 µm) and the cellulose-based dialysis membrane (with a pore size of 0.003 µm [molecular weight cut-off 12-14 kDa]). The different equilibrium times for diclofenac (6.8 h) and metoprolol (25 h) could be explained by a difference in membrane-affinity. This difference is related to the charge difference of the compounds, where the positively charged metoprolol will interact with the negatively charged membrane, resulting in longer retention time for metoprolol.
In Paper IV, the release of DOX from the aqueous phases of the emulsions were investigated using a dialysis membrane as the diffusion barrier (Figure 10B). Depending on the aqueous phase composition, the equilibrium was reached between 3 to 15 h, showing that this barrier caused a decrease in the appearance rate of DOX (Figure 10B).
The diffusion barrier in Paper II was a nylon mesh with a pore-size 80 µm. When an aqueous solution of 2 mg/ml DOX was loaded in the 6 mm sample reservoir, a complete transport across the mesh was reached within 1 min (Paper II). This shows that the 80 µm nylon mesh had a negligible effect on the release rate.
The effects of the diffusion barriers pore sizes and the hydrodynamics of the sample reservoir was further investigated (Paper ii).100 It was concluded
that the exchange of dissolution media between the sample reservoir and the release medium would be rapid, with almost complete mixing within less than one minute for nylon meshes of > 80 µm pore size.100 It was assumed that the
molecular diffusion is the mechanism of mass transport, the total available pore area will determine the transport rate across the membrane.
Figure 10. A) Correlation between equilibrium time (h) and pore-size described with
a nonlinear semi-log function for diclofenac and metoprolol, y = 3.4 - 1.5 * log x, R2 = 0.98, and y = 13 - 5.4 * log x, R2 = 0.96, respectively. Metoprolol observed values (■) and the non-linear semi-log function values (—); diclofenac observed values (●) and the non-linear semi-log function values (—). B) In vitro doxorubicin (DOX) release from emulsion 1:0, i.e., only the aqueous phase with DOX
concentration of 2.5 mg/ml, through a 12-14 kDa dialysis membrane. Emulsions compositions; water and lipiodol
□
(W/L), saline 0.9% and lipiodol ■ (S/L), iohexol and lipiodol ● (I/L), and a mixture of iohexol ○ (85%) and water (15%) (IW/L). All experiments were performed with the µDiss in 20 ml of phosphate buffer saline at a pH of 7.4, 37 °C, with a stirring rate of 100 rpm throughout the experiment. Lines represents the curve-fitted released DOX (%).Also, interactions between the drug and the diffusion barrier can further de-crease the diffusion across the membrane. As DOX is positively charged an interaction with the negatively charged cellulose membrane is possible. The use of dialysis membranes or diffusion barriers with small pore size should therefore be used with great care. However, for DDSs such as emulsions it is necessary to use a dialysis membrane, as it can prevent the DDS from spreading outside the sample container, thereby reducing the disturbance on the UV-measurements.101 If the applied diffusion barrier reduces the rate of
drug mass transport, this needs to be adjusted for in the data analysis, as the diffusion across the dialysis membrane will affect the appearance rate in the release medium.91, 102, 103 The empirical release model developed in Paper IV
is an example of a data analysis adjustment method for the appearance rate. To conclude, for particle DDSs the use of a diffusion barrier such as a nylon mesh > 80 µm does not affect the release rate. The use of dialysis membranes will most likely affect the release rate for non-solid DDSs, such as emulsions, which needs to be accounted for in the data analysis.
In vitro release investigations with the µDiss
In Paper I, the miniaturized µDiss method was used to investigate the release of four drugs from eight selected DDSs. These novel in vitro release profiles were compared to historical data.104-116 It was shown that the applied release
method had an impact on the release rate of the four studied drugs from the eight studied DDSs (Paper I). The applied method could increase or decrease the release rate, depending on the set-up. In the miniaturized method, only a representative portion of each DDS was investigated, whereas the historical release methods enabled examination of an intact formulation unit, such as a tablet. A drawback of the miniaturized method is that whole tablets were not examined. This could explain some of the observed differences between the
in vitro release profiles of the miniaturized and historical methods. However,
the difference in method set-up, such as release media and stirring rates, seemed to affect the drug release to a larger extent than if a whole tablet or a representative part of a tablet was examined (Paper I).
The used method also affected the release rate of DOX from the beads in Paper II. Here, the release of DOX from the beads were investigated in three experimental set-ups, one free-flowing and two sample-reservoir methods. The in vitro release rates of DOX from the beads in both the 6- and 8-mm sample reservoirs, as well as the free-flowing methods with a stirring rate of 0, 100, and 400 rpm, is shown in Figure 11A. For all bead sizes, the corresponding DOX release rates were significantly lower in the 6 mm sample reservoirs than in the free-flowing method (p < 0.05). The release rates in the 6-mm sample reservoir were significantly lower than in the 8 mm sample reservoirs, except for the 300 – 500 µm beads (p < 0.05). Since the 80 µm nylon mesh had a negligible effect on DOX diffusion across the nylon mesh, the release delay should not be attributed to the nylon mesh. It is suggested that the packing and resulting confinement of the beads in the sample reservoir could explain the observed reduced release rate. Similar results have been shown in a microfluidic-network method, where the release of DOX decreased with increased bead confinement.117
The in vitro release rate in the free-flowing method was also dependent on bead size (Figure 11A). DOX release rates increased with the higher available surface area of the smaller beads, which is in line with literature data.118 Salt
concentration of 100 mM in the release medium resulted in higher DOX release rates from the beads, compared to salt concentrations of 10 mM (Paper II). As ion-exchange had been proposed as a release mechanism, an increase in DOX release with increased salt concentrations was expected.118 However,
increase the diffusion rate of DOX, i.e. the Brownian motion of the molecule.59, 62, 64, 120, 121 For DDSs used in the treatment of HCC, prolonged
drug release at 37 °C, over weeks or even months, is often intended. To enable relevant evaluation times of the DDSs, accelerated in vitro release tests, such as increased temperatures, might be important.122 However, mechanistic
conclusions drawn from accelerated studies are only valid if the release mechanism is the same as in real-time investigations.76
Figure 11. A) Impact of in vitro method, i.e. free flowing (FF), 6-mm sample
reser-voir (SR 6) or 8-mm sample reserreser-voir (SR 8), on in vitro doxorubicin (DOX) release from beads in phosphate buffer saline (PBS), (20 ml, pH 7.4, 37 °C). The in vitro DOX release from three bead sizes is shown at three stirring rates (0, 100, and 400 rpm). B) In vitro doxorubicin (DOX) release rates (h-1) from 100 – 300 µm beads in free-flowing method (20 ml of 100 mM NaPO4 pH 6.3, under stirring at 400 rpm).
For many parenteral prolonged release DDSs it is challenging to use the in
vitro release rate to predict the in vivo release because of the lack of suitable in vitro release methods, as well as the complex design of these DDSs.123 The
in vitro release profiles of the free-flowing and sample-reservoir methods for
DOX from the beads were compared to literature data124 of local liver
plasma-concentrations collected in a healthy pig model (Paper II). The sample reservoir methods were more in vivo-like compared to the free-flowing method (Figure 12A). Also, the percentage DOX release were similar to deconvolution of plasma profiles of a clinical study where cumulative amounts of released DOX were estimated to 14 ± 5.6% (local) and 12 ± 4.6% (systemic) after 6 h.8, 50 The higher in vivo relevance of the sample reservoir
is also suggested to be due to the previously discussed bead confinement.117
In a clinical study based on four resected livers from HCC patients the concentration of DOX inside the beads were analyzed after 57 and 79 days.125
In clusters with less than 5 beads (22%) DOX concentrations were significantly lower, compared to in larger bead clusters.125 This suggests that
In Paper II, a decrease in release medium volume from 20 ml to 10 ml in the 6 mm sample reservoir further increased the similarities with in vivo literature data124 (Figure 12B). During the clinical TACE administration of the
beads, a full embolization is achieved.8 The embolization could limit the
volume of body fluid available for DOX release from the beads and this is suggested as a reason for the increased similarities with decreased release medium volume.
Figure 12. Comparisons of the doxorubicin (DOX) release (%) from 100 – 300 µm
beads in the investigated in vitro methods to observed in vivo data from a pig model.124 In vitro release profiles were collected in phosphate buffer saline (PBS), pH 7.4, 37 °C under stirring (400 rpm). (A) Free-flowing (FF), 6-mm sample reser-voir 6 (SR 6) and 8-mm sample reserreser-voir 8 (SR 8) in 20 ml PBS. (B) The effect of release medium volume with SR 6 in 10, 15, and 20 ml PBS.
Micropipette-assisted microscopy method
In Paper III the release of four amphiphilic molecules (dodecylpyridinium, chlorpromazine, amitriptyline, and adiphenine) from the beads were studied using both the micropipette-assisted microscopy method and the free-flowing method. The free-flowing method is easy to work with, but it does not provide information about the internal morphology of the beads.97, 126 The
micropi-pette-assisted microscopy method is somewhat cumbersome, but it provides information on internal morphology of the beads. It also enables adjustment and calculations on the fluid flow exposure of the beads. The release of the amphiphile from the loaded beads was initiated by changing the liquid in the flow-pipette from amphiphilic solution to 150 mM NaCl solution (Figure 8).
The shortest time for complete release was observed for adiphenine (< 300 s), followed by amitriptyline (< 450 s), dodecylpyridinium (< 1000 s), and chlor-promazine (< 1500 s). Apart from the fact that the last two appear in the re-verse order, the swelling rate increased with increasing cmc (Paper III).
The initial swelling rate of the beads during release of the amphiphile substances in the micropipette-assisted release method correlated (r2 was 0.99
and p-value < 0.0001) with the initial release rate from the beads measured in the free-flowing method in the µDiss (Figure 13). This shows that the swelling rate could be used as an indication of the release rate.
Figure 13. Correlation of swelling rate (s-1) in micropipette-assisted microscopy and release rate (s-1) in µDISS of surfactant or amphiphilic drug solutions from 50 µl bead:water slurry (1:1) of bead sizes 100 – 300 µm in 20 ml of 150 mM NaCl. Free-flowing method at room temperature, a magnetic stirrer (100 rpm), provided stirring of the release medium. Release data was normalized towards maximum concentra-tion released. Swelling rate=0.13 × release rate + 0.00022, r2= 0.99, p < 0.0001.
Both DOX and cetylpyridinium were also investigated using the micropipette-assisted microscopy method. When compared at similar concentrations, DOX and cetylpyridinium had similar rates of shrinkage upon loading as the other amphiphile molecules (Paper III). However, the swelling rate upon release was considerably slower than for the other amphiphilic molecules. DOX and cetylpyridinium showed an uncompleted release after 6000 s, whereas all other amphiphilic were completely released after 1500 s. Both DOX and cetylpyridinium has one order of magnitude lower cmc than the other studied amphiphilic. Cetylpyridinium was included because of its comparable hydrophobicity to DOX, represented by its aggregating concentration. Despite the simple molecular structure of cetylpyridinium, it was the best model substance for DOX with regard to binding and release from the beads.
This supports the findings from Paper II, where the tendency to self-aggregate was suggested to be of importance for the release rate of an amphiphile from the bead.
Theoretical models
In Paper I, II and III, theoretical models were used to investigate the release mechanism of the drugs from each DDS. The Weibull function was successfully fitted to both miniaturized and historical in vitro release profiles of all compounds and DDSs (Paper I). The estimated parameters of the Weibull function were used to describe the release mechanism in accordance with the work of Papadopoulou et al.88 The drug-release mechanisms for seven
in vitro release profiles of the IR formulation data sets were diffusion through
a fractal/disordered matrix, or diffusion according to Fick’s law (first-order release) (see Paper I). This was in accordance with the formulation strategy for the IR DDSs. In contrast, the data sets for IR naproxen and IR diclofenac suggested complex release mechanisms involving erosion or influence of the relative insolubility of the APIs.127
The individually coated pellets of MR metoprolol released its content over a period of 24 h. It is the coating of the pellets that provides the almost zero-order release kinetics.128, 129 The proposed release mechanisms for the three
MR metoprolol data sets were either a complex mechanism or diffusion- controlled in combination with case II transport (Paper I). This is in line with the reported approximate zero-order release.128
For several of the investigated DDSs the indicated release mechanism varied with the method used. As an example, the release of diclofenac from the gel was studied using two methods, one historical130 and the miniaturized
method (Paper I). There was a 50,000-fold difference between pore sizes of the used filters, which is assumed to be responsible for the observed difference in release rate. Again, this highlights the impact of the used diffusion barrier on the release rate. Also, there were differences in the applied stirring rates, release medium (e.g. differing in pH and/or the addition of surfactant), and in the volume of release medium used between the miniaturized and historical release methods. These factors could have an impact on the estimates of the Weibull function and hence on the indicated release mechanism. As the indicated release mechanism varied with the choice of in vitro method, the suggested release mechanisms should be carefully interpreted.
The release parameters of both miniaturized and historical in vitro release methods were used to simulate in vivo plasma concentration-time release
formulations, indicating the overall accuracy of the modified miniaturized method. Also, the small release volume and the use of the sample reservoir seems beneficial for in vivo predictions.
For each bead size, the experimental data points of DOX release collected in the free-flowing method at three stirring rates (0, 100, and 400 rpm), were used in the mechanistic model (Paper II). In the free-flowing method the flow rate of the release medium was unknown and therefore it was estimated by model fitting. The model was fitted by adjusting the two independent param-eters manually. The theoretical upper-limit of the fluid flow was based on the dimensions of the 2-cm stirring bar and the applied stirring rate (Paper II). After 4 hrs, all experimental curves had developed plateaus, indicating that an equilibrium had been reached during the experiment. The film-control model fitted all data sets and had flow rates within the theoretical limits (Paper II). The internal-depletion model could describe the release of DOX from 70 – 150 and 100 – 300 µm beads. For the 300 – 500 µm beads, the internal depletion-layer model could not capture the release profile, and the theoretical flow rates were equal or close to the theoretical limit. This is contradictory, as larger particles have a tendency towards depletion layer release, since the diffusion length inside the particle is larger than for small particles.90
Figure 14. Historical in vivo drug concentrations in plasma over time (CP OBS) and
simulated (GI-Sim) in vivo plasma concentration-time profiles based on in vitro data obtained from the miniaturized method (µDiss) and historical sources. Symbols rep-resent historical CP OBS, lines reprep-resent simulated plasma concentrations. A) Ob-served data from Sandberg et al.104, simulated red line data from Gohel et al.105, sim-ulated green line data from Sandberg et al.104, and simulated blue line data from the miniaturized method. B) Observed data from Sandberg et al.104, red line data from Löbenberg et al.106 and blue line data from the miniaturized method. C) Observed data from Zhang et al.107, red line data from Friedman et al.108, and blue line data from the miniaturized method. D) Observed data from Kovacevic et al.109, red line data from Elqidra et al.110, green line data from Kovacevic et al.109, purple line data from Nan et al.111, and blue line data from the miniaturized method. E) Observed data from Zhang et al.107, red line data from Zhang et al.107, and blue line data from the miniaturized method. F) Observed data from Zhou et al.112, red line data from Yuksel et al.113, and blue line data from the miniaturized method. G) Observed data from Reiner et al.114, red line data from Al Ameri et al.115, green line data from Nishihata et al.116, and blue line data from the miniaturized method.
It has previously been reported that the release of DOX from the beads happens through an ion-exchange mechanism highly dependent on the con-centration of salt in the release medium.118 After 24 h in 250 ml of release
medium containing NaCl concentrations of 77, 150, 770, and 1500 mM, respectively, a maximum fraction of DOX release of 7, 12, 14, and 28%, respectively, was generated.118 This suggests that the amount of salt available
during release is not rate limiting for DOX release from the beads. In Paper II the effect of salt on the release of DOX from 100 – 300 µm beads were investigated in the 8 mm sample reservoir. A 10-fold increase in salt concentration generated a 3–5 fold increase in DOX released, depending on the pH of the release medium. The effect on salt addition was further investigated with the PB-cell model and the dimerization model. The combined calculations of the two models showed that a 10-fold increase in salt concentration would generate a 2-fold increase in the maximum DOX-fraction being released, which is in qualitative agreement with the observations. The suggested mechanism behind this is that the deprotonated form of DOX dominates in the aggregates inside the bead even when the protonated form dominates in the solution. This could be due to the dimerization of DOX, which starts at concentrations in the lower µM range and increases with increasing salt concentrations, and explains the possibility of dimers being present at 100 mM and not at 10 mM.69
The combined results of the applied theoretical models in Paper II suggested that the release of DOX from the beads was of film-controlled type, and that DOX self-aggregation, DOX-PVA aggregation, and deprotonation of DOX were all important in the release mechanism.
The effect of self-aggregation, measured as the swelling rate of the beads upon release, was further investigated in Paper III. Here, it was suggested that
there is a scaling relationship between literature cmc-values63, 120, 131-135 and
swelling rate, i.e. the release rate (Figure 15).
Figure 15. Relationship of swelling rate (s-1) and critical micelle concentration (cmc) for the investigated substances.63, 120, 131-135 On a log-log scale to separate dox-orubicin and cetylpyridinium from axis-origin.
The theoretical models used in Paper II were further developed in Paper III. The micropipette-assisted microscopy method enabled measurements on bead swelling in a constant fluid flow, meaning that the fluid flow parameter could be fixed in the applied models.97, 126 The only variable parameter in the model
was cacb, which describes the concentration of amphiphile inside the bead that
induces aggregate-formation. The release of DOX from the beads have been described to take place by an ion-exchange mechanism in which one sodium ion displaces one bound DOX molecule.54, 118, 121, 136 The calculations in Paper
III shows that the diffusion of NaCl will be rate-limiting only at low salt concentrations. At physiological conditions (approximately 150 mM NaCl) it was suggested that the diffusion of NaCl into the bead was completed within a few seconds (Paper III). This fast diffusion of NaCl into the beads contradicts the proposed ion-exchange mechanism.118, 136 After diffusion of
NaCl into the bead, the monomers in local equilibrium with the aggregates in the outermost layer were released (Figure 16). When the aggregates in the outermost layer werecompletely depleted, release of aggregates from the next
Figure 16. Proposed mechanism of release of amphiphile, showing amphiphile
mon-omers (small circles) and aggregates (clusters). As the free amphiphile-monomer diffuses out of the bead, aggregates dissolve to maintain the monomer concentration. This prevents flux of amphiphile within the bead, leading to complete depletion of the aggregates in the outermost layer.
It was further suggested that the time for complete release was approximately inversely proportional to cacb. A molecule with a high cacb has a low tendency
for aggregation inside the bead. Therefore, it has a relatively higher monomer concentration. This higher monomer concentration leads to a larger concen-tration gradient and a faster release rate. The monomers in local equilibrium with the aggregates inside the beads will develop a concentration gradient, which will vary, from the cacb at the inner boundary, to zero at the outer
boundary.
The results of the models developed and used in Papers II and III are not consistent. There were several differences in the models developed in Papers II and III. Firstly, in Paper II in vitro release experiments were conducted towards equilibrium but in Paper III it was conducted in an infinite sink. Secondly, the theoretical models of Paper II contained presumptions on the distribution of aggregate inside the beads. No such assumptions were made in Paper III. Thirdly, the fluid flow relative to the bead was used as a fitting parameter in Paper II, whereas in Paper III it could be calculated. The results in Paper II showed that it was difficult to elucidate if film-control or internal depletion-layer release mechanism fit the release data best. The film-control model was chosen because it could be fitted to all investigated bead sizes. As the models in Paper III contained no presumption on the distribution of aggregates and only had one variable fitting parameter (cacb), the suggested
release mechanism of internal depletion-layer release is our proposed release mechanism. The results from both Paper II and Paper III were, however, conclusive on the importance of amphiphile self-aggregation on the release rates from the investigated beads.
Emulsion-based formulation properties
The DOX solubility experiments in PBS and the various emulsion components were performed using a shake-flask method. The results are summarized in Table 1.99 The values represent DOX concentrations measured in the samples
supernatant, or from the top of the vials when no supernatant was present. The DOX formed solid precipitate only in lipiodol. It is suggested that this was due to the ionization of DOX, which reduces its solubility in lipids. In the aqueous solvents, viscous gel-like structures were observed with increasing concentrations of DOX. The solubility of DOX in PBS (7.1 mg/ml) and saline solution (10 mg/ml) were similar, but lower than in water (> 40 mg/ml). The difference in solubility is explained by their respective ionic strengths, PBS 0.14 M and saline 0.15 M, and the ‘salting out’ effect. Salting out means that the entropic penalty of separating out an electrolyte decreases with increasing ionic strength.137 Similar results have been reported with DOX in 0 – 0.4 M
NaCl solution, where an increase in NaCl concentrations increased the viscosity due to an increased stacking of DOX aggregates.65 Recently, it was
suggested that the addition of NaCl screens the electrostatic repulsions of DOX, which facilitated the formation of elongated DOX bundles responsible for the observed increase in viscosity.67
In water, the mixture of iohexol and water, and iohexol, the whole sample was viscous and gel-like at concentrations above 50 mg/ml. Iohexol does not self-aggregate in water. Therefore, it cannot increase DOX solubility by forming mixed micelles with DOX.138 Iohexol was used in the form of the
clinically used commercial product OmnipaqueTM. This product also contains
three other compounds; tromethamine, edetate calcium disodium and hydrochloric acid/sodium hydroxide (for pH adjustment), which could cause the whole sample to form the observed gel-like behavior.139
Table 1. Solubility (mg/ml) of doxorubicin hydrochloride (DOX) at room tempera-ture after 24 h of mixing in the emulsion components, presented as the mean ± SD (n=3).
Solvent Measured Solubility (mg/ml) pH PS
Lipiodol 0.02 ± 0.01 NM solidc
Water > 50 4.2 ± 0.2 gel-likea
Saline 10.2 ± 1.7 4.6 ± 0.1 gel-likeb
Iohexol > 75 5.2 ± 0.2 gel-likea
Iohexol and water* > 69 5.3 ± 0.04 gel-likea
PBS 7.1 ± 2.9 6.1 ± 0.1 gel-likeb
PS, precipitation state, *Iohexol (85%) and water (15%), PBS, phosphate buffer saline pH 7.4, NM, not measurable.
The results of DOX distribution into the lipid phase is shown in Figure 17A. After 15 min no DOX could be detected in the lipid phase of the W/L and S/L emulsions. At 1 h DOX could be detected in the lipid phases of all tested emulsions, were it ranged from 0.5 to 20%, depending on the composition of the aqueous phase of the emulsion. From 15 min to 1 h there was a significant (2-fold) increase of DOX in the lipid phase of emulsions I/L and IW/L, showing the time-dependent distribution of DOX to the lipid phase. DOX dis-tribution to the lipid phase also increased with the addition of iohexol, and after 1 h 0.50 ± 0.30% of DOX was distributed to the lipid phase of emulsion W/L and 20 ± 2.3% for emulsion IW/L.
Emulsion stability has been proposed as an important factor in HCC treat-ment. In a clinical study with lipiodol-based emulsion at an aqueous-to-lipid phase ratio of 1:2 and the cytostatic agent idarubicin, it was suggested that more stable emulsions increased the concentration of the active metabolite idarubicinol, which would indicate a high level of hepatic extraction.23 In
Paper IV the emulsion stability was studied both with macroscopic visual inspection and by microscopy, which enabled measurements of droplet-size (Table 2). The macroscopic investigation showed that three emulsions (emulsion S/L ratios of 1:1 and 1:4, and emulsion W/L 1:1) separated within 15 min. No emulsion or emulsion-droplets were present in these three emulsions after 10 min in the microscopic investigation due to complete emulsion breakage. In the macroscopic investigation, emulsion W/L 1:4 was stable for 1 h, but after 72 h it had separated. The microscopic investigations showed similar results, where, after 1 h, an emulsion with droplet-sizes ranging between 8 – 60 µm were present.
Table 2. Stability of the emulsions with aqueous-to-lipid phase ratio of 1:1 and 1:4 determined with visual inspection# and droplet-size range of emulsions investigated with microscope*. Aqueous-to-lipid phase ratio (ATLR). Emulsion composition; water and lipiodol (W/L), saline 0.9% and lipiodol (S/L), iohexol and lipiodol (I/L), and a mixture of iohexol (85%) and water (15%) (IW/L).
Emulsion W/L S/L I/L IW/L
ATLR 1:1 1:4 1:1 1:4 1:1 1:4 1:1 1:4 Time 10 min* (µm) - 8 - 60 - 8 - 60 20 - 30 20 - 30 10 - 40 10 - 40 15 min# - + - - + + + + 1 h# - + - - + + + + 1 h* (µm) - 8 - 60 - 50 - 200 20 - 30 20 - 30 10 - 40 10 - 40 72 h# - - - - - + + +