Contaminated
Sites
f o r
f o r
Contaminated
Sites
TO ORDER: Swedish Environmetal Protection Agency Customer Services
SE- Stockholm, Sweden TELEPHONE: + TELEFAX: + E-MAIL: kundtjanst@naturvardsverket.se INTERNET: http://www.naturvardsverket.se ISBN ---.pdf ISSN - PRODUCTION: ARALIA DESIGN: IdéoLuck AB
TRANSLATION: Celia Jones, Kemakta konsult AB and Al Burke, Sea Otter
PRINTING: Fälth & Hässler, Värnamo 1ST EDITION: copies
Contents
Foreword 4
Summary 5
PART 1: ENVIRONMENTAL QUALITY CRITERIA FOR
CONTAMINATED SITES 7
Introduction 8
Environmental Quality Criteria for Contaminated Sites 14
Hazard Assessment 18
Contamination Level 22
Potential for Migration 31
Sensitivity and Protection Value 43
Comprehensive Assessment, Risk classification 46 PART 2: GUIDANCE FOR DATA COLLECTION 51
Introduction 52
MIFO Inventories 58
Phase 1: Preliminary Survey 64
Phase 2: Preliminary Site Investigation: Inspection, Geological
Profile and Sampling Plan 74
Phase 2: Preliminary Site Investigation: Sampling and Field Studies 83 Phase 2: Preliminary Site Investigation: Lab Analysis and Tests 95
Quality Control 100
Safety Issues 102
Reporting 104
Foreword
In 1990, the Swedish Environmental Protection Agency was assigned the task of planning for the remediation of the nation's contaminated sites. A nation-wide inventory of industrial branches was carried out during 1992–1994 for the purpose of identifying the sites and branches most urgently in need of attention. The inventory was based on existing information, which indicated that field inves-tigations had not yet been undertaken at the majority of the sites.
The industrial inventory is now being complemented, and for that purpose a method has been developed for the assessment of risks on a uniform basis and with a reasonable degree of reliability. By applying a uniform method, sites can be compared in order to set priorities for further investigation and remediation, and to make decisions about hazardous and suspected hazardous sites.
The method consists of three parts. The first part deals with environmental quality criteria for contaminated areas, including a method for risk classification. The second part provides guidance for the collection of data required for risk classification. The third part, presented in a separate report, describes analytical procedures which are included in the method.
The first part is included in a series published by the Swedish Environmental Protection Agency under the general heading of Environmental Quality Criteria. The other reports in the series are entitled The Forest Landscape, The Agricultural Landscape, Groundwater, Lakes and Watercourses and Coasts and Seas.
This report, Contaminated Sites, is based on our current understanding of environmental effects and their causes. As our understanding is being improved continuously, a revision will be needed eventually. Developments in the work of the Swedish Environmental Protec-tion Agency can be followed on our Internet web site: www.environ.se. Concise versions of the reports are available there as well.
The project leaders for this report are Per Gullbring and Fredrika Östlund of the Swedish Environmental Protection Agency. The work has been carried out in co-operation with the following individuals and institu-tions: Ingvar Björklund, Hans Borg, Thomas Alsberg, Cecilia Andrén and Erik Gravenfors of the Institute for Applied Environmental Research at Stockholm University; Ingemar Cato, Dag Fredriksson and Ulf Qvarfort of the Swedish Geological Survey; and Lennart Dock of the Institute of Environmental Medicine at Karolinska Institute.
The method has been tested with trial inventories of contaminated sites in eight Swedish counties. It has also been submitted for review and comment by government agen-cies, universities and other interested parties.
The Swedish Environmental Protection Agency is grateful for the assistance of all who participated in the project.
Swedish Environmental Protection Agency Stockholm, 2002
Summary
Part 1 of this report on contaminated sites is one of six in a series of reports issued by the Swedish Environmental Protection Agency under the general heading of ENVIRONMENTAL QUALITYCRITERIA. The others are entitled The
Forest Landscape, The Agricultural Landscape, Groundwater, Lakes and Watercourses and Coasts and Seas.
The purpose of the series is to enable local and regional authorities and others to make accurate assessments of environmental quality on the basis of available data, thus providing a more solid foundation for environmental planning and the establishment of environ-mental objectives. Each of the reports includes assessment criteria for a selection of param-eters relating to objectives and threats that are associated with the main subject of the report.
A contaminated site is a landfill site or area of soil, groundwater or sediment which is so contaminated by a point source that concentrations significantly exceed local or regional background levels. The environ-mental quality criteria described in this report may be used to assess individual contaminated sites. They are a tool for assessing the risk associated with a contaminated site on the basis of limited information. The area is assigned to one of four risk classes as a result of the assessment.
The risk classification is an overall assess-ment of the degree of hazard posed by the contaminants, the level of contamination, the potential for migration of the contaminants as well as the degree to which protection of human health and the environment is required in the area. Criteria, questionnaires and tables have been provided to assist in various aspects
of the assessment. Only a small part of the information required for risk classification is derived from environmental monitoring programmes. Most of the data is generated by special studies and investigations conducted at each site.
Part 2 of this report provides guidance regarding the requirements that must be met by the input data used in order to classify the risks associated with contaminated sites with an adequate degree of reliability. The guidance also explains how to collect the necessary data, plan and carry out the required sampling and analysis. Together, parts 1 and 2 comprise a complete guide for all the steps involved in conducting inventories of contaminated sites.
The model thus described is entitled MIFO, which, in Swedish, stands for Methods for Inventories of Contaminated Sites, and consists of two phases. The first phase is a preliminary survey, which begins with the identification of relevant objects for assessment and industries, followed by data-collection from maps and archives, together with on-site inspection and interviews. The preliminary inventory concludes with descriptions, evaluations and a final report.
The second phase is a preliminary site investigation that begins with an on-site inspection and the drawing up of a geological profile and sampling plan. Samples are then taken at strategically selected locations and analysed to quantify the relevant parameters. The preliminary site investigation concludes with descriptions, evaluations and a final report.
This report also contains information on quality assurance and safety issues.
PART 1
Environmental
Quality Criteria for
Contaminated Sites
Environmental
Quality Criteria
The vision of an ecologically sustainable society includes protection of human health, preservation of biodiversity, conservation of valuable natu-ral and historical settings, an ecologically sustainable supply and efficient use of energy and other natural resources. In order to determine how well basic environmental quality objectives and more precise objectives are being met, it is necessary to continuously monitor and evaluate the state of the environment.
Environmental monitoring has been conducted for many years at both the national and regional levels. But, particularly at the regional level, assessments and evaluations of current conditions have been hindered by a lack of uniform and easily accessible data on baseline values, environ-mental effects, etc.
This report is one of six in a series which purpose is to fill that infor-mation gap, by enabling counties and municipalities to make compara-tively reliable assessments of environmental quality. The reports can thus be used to provide a basis for environmental planning, and for the setting of local and regional environmental objectives.
The series bears the general heading of “E Q C”, and includes the following titles: The Forest Landscape, The Agri-cultural Landscape, Groundwater, Lakes and Watercourses, Coasts and Seas, and Contaminated Sites. Taken together, the six reports cover most of the natural ecosystems and other types of environment found in Sweden. It should be noted, however, that coverage of wetlands, mountains and urban environ-ments is incomplete.
Each of the reports includes assessment criteria for a selection of pa-rameters relating to objectives and threats that are associated with the main subject of the report. The selected parameters are, for the most part, the same as those used in connection with national and regional environ-mental monitoring programmes; but there are also some “new” parame-ters that are regarded as important in the assessment of environmental quality.
Most of the parameters included in the series describe current condi-tions in natural environments, e.g. levels of pollution, while direct measures of human impacts, such as the magnitude of emissions, are generally not
included. In addition to a large number of chemical parameters, there are several that provide direct or indirect measures of biodiversity.
In all of the reports, assessments of environmental quality are handled in the same way for all of the parameters, and usually consist of two sepa-rate parts (see also page 13). One part focuses on the effects that observed conditions can be expected to have on environment and human health. Since knowledge of such effects is often limited, the solution in many cases has been to present a preliminary classification scale based on general knowledge about the high and low values that are known to occur in Swe-den.
The second focuses on the extent to which measured values deviate from established reference values. In most cases, the reference value repre-sents an approximation of a “natural” state, i.e. one that has been affected very little or not at all by human activities. Of course, “natural” is a concept that is not relevant to the preservation of cultural environments; in such contexts, reference values have a somewhat different meaning.
The results of both parts are expressed on a scale of 1-5, where Class 1 indicates slight deviations from reference values or no environmental effects, and Class 5 indicates very large deviations or very significant effects. The report on Contaminated Sites with its discussion of pollutants in heavily affected areas complements the other five reports. In those cases where the parameters are dealt with in several of the reports, which is par-ticularly the cases for metals, the report on Contaminated Sites corre-sponds (see further pages 13-14). However, the various parameters cannot be compared with each other in terms of risks. The following paragraphs review the extent of agreement with corresponding or similar systems used by other countries and international organizations.
INTERNATIONAL SYSTEMS FOR ENVIRONMENTAL QUALITY ASSESSMENT
Among other countries, the assessment system that most resembles Swe-den’s is that of Norway. The Norwegian system includes “Classification of Environmental Quality in Fjords and Coastal Waters” and “Environmental Quality Classification of Fresh Water”. A five-level scale is used to classify current conditions and usability. Classifications are in some cases based on levels of pollution, in other cases on environmental effects.
The European Union’s proposal for a framework directive on water quality includes an assessment system that in many ways is similar to the Swedish Environmental Quality Criteria.
If the parameters used in the latter are regarded as forms of environmental indicators, there are many such systems in use or under development. However, the concept of environmental indicators is much broader than the parameters of Environmental Quality Criteria.
The forest landscape
Acidification Leaching of nutrients Metals
Proportion of ancient forest and deciduous forest in the landscape.
Presence of dead wood and large trees
Groundwater Acidification Nutrients Metals Pesticides Water table Chloride Redox
Lakes and watercourses
Acidification Nutrients Metals Presence of aquatic organisms Light conditions Oxygen Acidification Eutrophication Organic pollutants
The agricultural landscape
Acidification Leaching of nutrients Metals
Content and extent of the agricultural landscape
Customary land use Quality of arable land Number of species
Contaminated sites
Metals
Organic pollutants
Coasts and seas
Nutrient concentrations Secchi depth
Chlorophyll concentration Oxygen
Benthic fauna and macrovegetation Metals
Organic pollutants
Internationally, the most widely accepted framework for environmental indi-cators is based on PSR-chains (Pressure-State-Response). Indiindi-cators are chosen which reflect the relationship between environmental effects, and/or there causes and measures taken. There is also a more sophisticated version, called DPSIR (Driving forces-Pressure-State-Impact-Response). Variants of the PSR/DPSIR systems are used by, among others, the OECD, the Nordic Council of Ministers, the United Nations, the World Bank, the European Union’s Environmental Agency.
ASSESSMENT PROCEDURE
Assessment of current conditions
Wherever possible, the scale used in assessments of current conditions is correlated with effects on different parts of the ecosystems and their biodi-versity, or on human health (”effect-related classification”). In some cases, the assessment is based only on a statistical distribution of national data (”statistical classification”).
The scale is usually divided into five classes. Where the assessment is based on effects, Class 1 indicates conditions at which there are no known negative effects on the environment and/or human health. The remaining classes indicate effects of increasing magnitude. Class 5 includes conditions leading to the most serious negative effects on the environment and/or human health. Due to wide natural variations, especially with regard to biological pheno-mena, the indicated effects are not always the result of human activities, in which case they can not be labelled as “negative”(see below).
Where the assessment is based only on a statistical distribution, there is no well-defined relationship between effects and class limits. It should be noted that parameters that are evaluated on the basis of different criteria cannot be compared with each other.
Reference values
Ideally, the reference value for a given parameter represents a natural state that has not been affected by any human activity. In practice, however, refe-rence values are usually based on observations made in areas that have expe-rienced some slight human impact. In some cases, historical data or
model-Assessment of current conditions — indicates environmental effects associated with
current conditions Measurements/data
Assessments of deviation from reference values — indicates environmental
based estimates are used. Given that there are wide natural variations of several of the parameters, reference values in many cases vary by region or type of ecoystem.
Deviations from reference values
The extent of human impact can be estimated by calculating deviations from reference values, which are usually stated as the quotient between a meas-ured value and the corresponding reference value:
Measured value Deviation = —————————
Reference value
The extent of deviation is usually classified on a five-level scale. Class 1 includes conditions with little or no deviation from the reference value, which means that effects of human activity are negligible. The remaining classes indicate increasing levels of deviation (increasing degree of impact). Class 5 usually indicates very significant impact from local sources.
Organic pollutants and metals in heavily polluted areas are dealt with in greater detail in a separate report, Contaminated Sites, which includes a further sub-division of Class 5, as follows:
Contaminated Sites
Impact from point sources:
None/ Moderate Substantial Very slight great
Class 1 Class 2 Class 3 Class 4 Class 5
State of the environment and problems
A contaminated site is a well-defined area for which the level of contamination from one or more point sources significantly exceeds the relevant background level. A site may consist of a landfill or an area of contaminated soil, groundwater or sediment.
The pollution of land and water by industrial activities has occurred over a period of several hundred years, resulting in a large number of landfills and other contaminated sites. The Swedish Environmental Protection Agency estimates that there are about 22,000 contaminated sites through-out the country.
Contaminated sites have only recently been considered from the planning and environmental protection viewpoints. Many of these sites are already releasing large quantities of contaminants that have unacceptable effects on the environment. In many cases, the pollutants comprise serious future threats to human health and the environment.
Environmental quality assessments
Environmental quality criteria are used to assess individual contaminated sites, which may range in size from a petrol station to a large industrial complex or part of a groundwater system that has been polluted by a point source. The criteria have been developed primarily for the investigation of contaminants that have been in the ground for a long period of time, but they may also be applied to more recent, acute problems.
The purpose of the criteria is to permit a comprehensive assessment of the risks associated with specific contaminated sites, even in cases for which available data are limited. The results are intended to provide a basis for the setting of priorities and for decisions concerning additional investi-gations, remediation, the declaration of a hazardous site or other meas-ures. The area is assigned to one of four risk classes as a result of the assessment.
Class 1: Very high risk Class 2: High risk Class 3: Moderate risk Class 4: Low risk.
Environmental
Quality Criteria for
Contaminated Sites
There is no limit to the number of parameters that may be used in connection with environmental quality criteria for contaminated sites. It should be possible to assess all kinds of contaminants that may be present in a contaminated site. Therefore guidance on how to carry out assessments for a number of parameters is given in Appendices 4 and 5.
Environmental quality criteria are used to classify contaminated sites ac-cording to level of risk. In the following pages, the term “risk classification” is used in place of “environmental quality criteria for contaminated sites”.
TABLE 1.
Questions concerning risk classification of contaminated sites
Questions concerning risk to man and the environ-Questions about the site ment and scale on which answers are placed
Hazard assessment Which contaminants are present? Level of hazard?
Low <————————————> Very high Contamination level
Level of contaminants in each of the What is the current conditions? media in which they occur? (How serious are the effects?)
Slight <—————> Very serious
Deviation from reference value, i.e. degree of influence from point source?
None <————————————> Very large Total amount of each pollutant? Small <———————————> Very large Total volume of contaminated material? Small <———————————> Very large
Migration potential How rapidly does the pollutant
spread through various media? Slow <———————————> Very rapid Sensitivity/Protective value
Potential exposure of humans, Sensitivity of exposed groups?
present and future? Low <———————————> Very high Potential risk to the environment, Level of protection required for exposed present and future? environment?
Low <———————————> Very high Comprehensive risk assessment
Overall risk of the site to humans and to the environment?
Low <———————————> Very high Procedures for data-collection are described in Part 2 of this report. The data collected from a contaminated site provide answers to a number of questions relating to present conditions at and around the site, and to the associated risks to man and the environment (see Table 1). Many
different aspects are considered, within the context of the following four general issues: • hazard assessment • contamination level • migration potential • sensitivity/protection value
The risk associated with each of these aspects is assigned one to four lev-els. The boundaries between the levels are set so that conditions at all con-taminated sites in Sweden – from those which present only a slight risk, to the most severely contaminated – are taken into account.
Finally the four aspects are weighed together in a comprehensive assess-ment on the basis of which the site is assigned to one of the four risk classes.
Assessments of current conditions and deviations from the reference val-ues are conducted according to the same principles as those applied to the other five major categories of environmental quality criteria, with two ex-ceptions: Firstly, only those contaminated sites which have been polluted by a point source are considered and the reference value is represented by the contaminant concentration that would occur if the site were not affected by a point source. This concentration, or reference value, can often be measured in a nearby area. The reference value reflects the natural concentration of the relevant substance, possibly with a slight addition from the effects of human activity. Secondly, in comparison with the other major categories of environ-mental quality criteria, classes 4 and 5 have been further subdivided.
The human health risk is evaluated at the individual level, which means that the risk is the same whether one or several persons are exposed. Risk to the environment is evaluated in relation to species and ecosystems.
Risk is evaluated with regard to both current and future situations, i.e. for the area that is already contaminated and areas that may experience negative effects in the future due to the spread of contaminants. The magnitude of the risk is dependent on factors such as type of land use.
The time frame considered in the assessment is hundreds to thousands of years. The point of departure for assessments of the exposure of humans and the environment is the type of land use, which may already have been decided in a detailed plan or merely been proposed in a general planning document.
Risk assessments apply to contaminated buildings and other construc-tions, land, groundwater, surface water and sediments. Landfills and filled-in areas are regarded as land.
In order to make assessments of the various aspects readily comprehensi-ble, three forms are completed for each site – two for underlying assess-ments, and one for the comprehensive risk evaluation (see Appendices 3, 6 and 7). As much information as possible is compiled; even uncertain data are noted, and indicated with a question mark (“?”). This is because valuable information may be lost if only that which is absolutely certain is noted.
The conclusions derived from the two underlying assessments are noted on the form for comprehensive risk assessment, contributing to an overview of the entire situation. All parameters are first evaluated separately, and then weighed together in the final assessment for risk classification.
Data requirements and method
Very little of the data used in assessing environmental quality criteria for contaminated sites comes from environmental monitoring programmes. Most of the data comes from the preliminary surveys and the preliminary site investigation that is carried out in connection with the inventories of contaminated sites. The relevant procedures for data collection are described in Part 2 of this report.
The method presented here for risk classification can be applied to sites for which the volume of data varies widely. It can also be applied to sites for which data have been acquired by means other than inventories, for example in cases where field studies have previously been conducted.
Risk classification may be repeated several times for the same site if new data are acquired. Underestimation of the risks must be avoided when carrying out the assessments. Assessments must be based on a “reasonably conservative” scenario. To base them on a “worst case” scenario may result in a significant overestimate of the actual risk. The greater the degree of uncertainty in the data, the greater the need for strict evaluations.
Area typology
For assessments of contaminated sites, there is no area typology. Contam-inated sites often have levels of contamination that greatly exceed natural variations in the country. Therefore, the method described here is consid-ered to be more appropriate than the use of an area typology based on natural or background levels which are then related to reference values.
References
Swedish Environmental Protection Agency, “Branschkartläggningen – en översikt-lig kartläggning av efterbehandlingsbehovet i Sverige”; report nr. 4293, 1995 Swedish Environmental Protection Agency, “Handlingsprogram för efterbehand-ling”; report nr. 4454, 1995
Swedish Environmental Protection Agency (1996), Generic guideline levels for contaminated sites (In Swedish: Generella riktlinjer för förorenade områden – beräkningsprinciper och vägledning för tillämpning) Report No. 4638
Swedish Environmental Protection Agency (1998), Proposed guideline levels for contaminated petrol stations (In Swedish: Förslag till branschspecifika riktvärden för förorenade bensinstationer). Report No. 4889
This section is concerned with assessment of the risks associated with the hazardous properties of the contaminants present at the site.
Background
It is necessary to know what contaminants are present at the site.
When there are no analytical results, which usually is the case during the preliminary survey (phase 1), the hazard assessment will have to be based on knowledge of the activities previously located at the site and the industrial processes and chemicals involved. Such information will indicate which chemicals are likely to be found at the site. Additional useful information can be obtained from previous site investigations, verbal reports and impressions from on-site observations.
When the preliminary site investigation (phase 2) has been performed, the analytical data obtained should reveal which contaminants are actually present. However, such information may also be available as a result of previous investigations of the site.
Hazard assessment
The hazard depends on the intrinsic properties of the contaminants.
In the present context, hazard is defined as the inherent potential of a substance or a group of substances to harm human beings or the environ-ment. This potential is also referred to as the toxicity of the substance. The hazard depends entirely on the chemical properties of the substance.
A contaminated site often contains a mixture of contaminants. How and to what extent these interact is usually unknown. In the part of an assessment of a contaminated site which is based on the intrinsic chemical properties of the contaminants present, each contaminant is treated as a separate entity. This generally means that a site contaminated with multiple contaminants will be classified as representing a greater hazard than a site containing only one type of contaminant.
The regulations and recommendations of the Swedish National Chemicals Inspectorate (KemI), which cover a broad range of chemicals, are suitable tools for use for the hazard assessment of a contaminated site.
The first step is to check if the contaminants present at the site are banned from use or if their use is restricted. Such chemicals are listed in
the KemI limitation list. If a contaminated site is suspected to contain chemical compounds that are banned from commercial use or are being phased out, the site has to be considered a serious hazard.
The next step is to check if the contaminants belong to the 200 sub-stances listed in the KemI Observation list or included in the “Sunset project”. If so, the site also has to be considered a serious hazard.
The KemI Regulations on the Classification and Labelling of Chemical Products, which cover more than 2200 substances, describe how chemicals can be classified according to their hazardous properties with respect to health and environmental effects. If a particular property of a chemical is not classified it may be because an assessment has not been carried out. The KemI procedure of substance classification includes an assignment of each substance to one or several “hazard classes” with associated risk phrases describing the nature of the health or environmen-tal hazard. The assignment follows strictly defined criteria. The hazard classes for chemical compounds used by the KemI include: Highly toxic (T+), Toxic (T), Corrosive (C), Harmful to the environment (N), Harmful to health (Xn), Irritating (Xi), Harmful to the environment without symbol (-), Moderately harmful to health (V). The environmental hazard assessment is subdivided into aquatic environments and all other environ-ments. The aquatic hazard assessment is based on information on acute toxicity, persistence in the environment, and potential for bioaccumulation. All these properties indicate a possibility for harmful environmental effects.
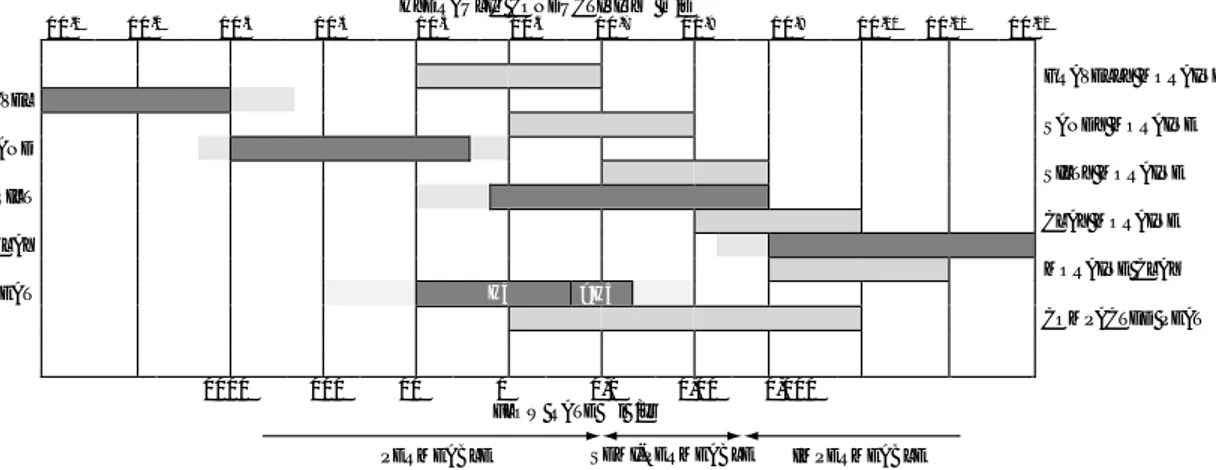
The KemI hazard classification system can be used for the hazard classification of contaminants at polluted sites as listed in Table 2.
Metals are generally considered to be present in their most toxic form. Exceptions can be made under certain circumstances, for example if the actual chemical species is known. The reason for any exception should always be clearly stated in the evaluation report.
The KemI classifications and regulations generally consider pure individual chemical substances and may therefore be difficult to apply to
TABLE 2.
Criteria for the classification of hazard assessment
Slightly hazardous Moderately hazardous Very hazardous Extremely hazardous “moderately harmful “harmful to health“ (Xn), “toxic” (T), “very toxic” (T+), to health” (V) “irritating” (Xi) “corrosive” (C) substances that are not
“harmful to the environ- “harmful to the allowed to be handled ment without symbol” (-) environment” (N) commercially or are
TABLE 3.
Hazard classification of certain chemical substances, products and mixtures
* Swedish EPA generic guideline levels available
**aged creosote with high content of polycyclic aromatic hydrocarbons
Extremely hazardous Arsenic* Lead* Cadmium* Mercury* Chromium (VI)* Sodium (metal) Benzene* Cyanide* Creosote*,** Coal tar PAH* Dioxins* Chlorobenzenes* Chlorophenols* Chlorinated solvents Organochlorine compounds PCB* Tetrachloroethylene* Trichloroethane* Trichloroethylene* Pesticides Very hazardous Cobalt* Copper* Chromium* (if Cr VI is not present) Nickel* Vanadium* Ammonia Aromatic hydrocarbons* Phenol* Formaldehyde Glycol Concentrated acid Concentrated bases Solvents Styrene Petroleum ash Petroleum products Aviation fuel Heating oil Waste oil Lubrication oil Hydrogen peroxide Paints and dyes Cutting oil Petrol Diesel oil Wood tar Moderately hazardous Aluminium Scrap metal Acetone Aliphatic hydrocarbons Wood fibre Tree bark Zinc* Slightly hazardous Iron Calcium Magnesium Manganese Paper Wood
contaminated sites where contamination by several contaminants is likely. In order to facilitate the assessment of chemical hazards at contaminated sites a number of substances and groups of substances frequently present at such sites have been evaluated and listed in Table 3, basically according to the KemI criteria. The Swedish Environmental Protection Agency (Swedish EPA) has issued guideline values for several of the substances and this is indicated in the table.
The contaminants present at the site being assessed are noted in the appropriate box under the heading “chemical hazard assessment” in the
comprehensive risk assessment protocol (Appendix 7), an example can be seen on page 50. Incomplete information, i.e. suspected, but not verified, contaminants, is noted with a question mark (“?”). Naturally occurring substances are only included if their levels exceed the guideline level or the natural background level. Substances that are not normally present in the environment are always included.
References
Swedish Environmental Protection Agency (1996), Generic guideline levels for contaminated sites (In Swedish: Generella riktlinjer för förorenade områden – beräkningsprinciper och vägledning för tillämpning) Report No. 4638
Swedish Environmental Protection Agency (1998), Proposed guideline levels for contaminated petrol stations (In Swedish: Förslag till branschspecifika riktvärden för förorenade bensinstationer). Report No. 4889
National Chemicals Inspectorate (1996), Limitation List (In Swedish:
Begränsningslistan – förteckning över ämnen som är förbjudna eller vars använd-ning är inskränkt)
National Chemicals Inspectorate (1997), Regulations on the Classification and Labelling of Chemical Products, KIFS 1997:5 (English translation of KIFS 1994:12, available at www.kemi.se)
National Chemicals Inspectorate (1998), Observation List – Example list of chemicals requiring particular attention. (available at www.kemi.se) National Chemicals Inspectorate (1994), The Sunset Project (In Swedish: Solnedgångsprojeket), KEMI Report 13/94
Contamination Level
This section is concerned with assessment of the risks associated with the amounts and concentrations of the contaminants, and with the volume of contaminated material.
Background
It is necessary to determine the level of every contaminant in each of the media where it is present, as well as the total amount of every contaminant at the site and the total volume of contaminated material.
Phase 2 of the inventories, the preliminary site investigation, includes sampling and analysis. The results are used in the assessment of the level of contamination. In some cases, an estimate of the level of contamination can be made already in the first phase, based on olfactory and visual impressions at the site, or on data from previous studies. The reliability of the sampling procedures and analytical methods used in previous studies must be evaluated, in order to ensure that the quality of the results is adequate. If the quality is adequate, the results from previous studies may be used in the same way as fresh data acquired in phase 2 of the inventory.
If only 1–5 samples have been taken at the site, the highest observed value is used in the comparisons. If more than five samples have been taken it may be more appropriate to use either the next-highest value or the 90th percentile.
An estimate of the amounts of the contaminants and the volume of contaminated material in buildings and other constructions, in the ground and in sediments is required. For this purpose, it may be possible to use information about or estimates of the amounts used at the site of chemi-cals which are now regarded as contaminants due to spillage, etc. General knowledge about branch or industry practices in the handling of chemi-cals, visual and olfactory impressions during visits to the site, and the results of sample analysis may also be useful in making such estimates.
Assessment of the contamination level
Risks are related to:
• the severity of the effects which can be caused by the observed contaminant concentrations; the extent to which the site is affected by point sources; the amounts of the contaminants; the volume of contaminated material.
The current conditions is assessed by measuring the concentrations of contaminants at the site. Those levels are then compared with reference values to determine the extent of deviation from those values.
The contamination level is a combination of the current conditions, de-viation from reference values, the amounts of contaminants, and the vol-ume of contaminated material. The current conditions and deviation from reference values are assessed for all media, with the exception of buildings and other constructions. The amount of each contaminant and the volume of contaminated material are assessed for buildings and other constructions, land and sediments.
To assist in the assessment of the contamination level, an assessment form is provided (see Appendix 3). The number of samples taken at the site, and which of them are used for comparison should be noted on the form. Information on all contaminants, both observed and suspected, is noted. Assessments based on uncertain data are indicated with a question mark (“?”). Analysis results that cannot be used due to lack of comparative data are noted in a special area. Also noted are references to the data with which the measured values are compared. If comparisons with different references yield different results, this should be noted in the areas provided, if the connection between specific references and results is clear. An exam-ple of a comexam-pleted form is provided at the end of this chapter.
Conclusions regarding contamination levels are entered on the form for comprehensive risk evaluation (see Appendix 7).
Assessment of current conditions
The state of the environment is related to the severity of the effects that may be caused by contaminants at the measured concentrations. The concentrations measured at the site are compared with effects-related values, which can be used to make an effects-related assessment. Several types of effects-related values can be used.
For soil, the Swedish guideline values for contaminated soil are preferred. As of spring 2000, there are general guideline values for 36 substances in soil, and sector specific guideline values for contaminated petrol stations. The guideline values for contaminated sites may be regarded as levels of contamination below which there is no short- or long-term risk for negative effects on humans or the environment. Guideline values for soil have been developed for several different types of land use. To assess current conditions, comparisons are made with the guideline values for the most sensitive type of land use. If there are no Swedish guideline values available, corresponding values from other countries may be used instead.
Guideline values are also preferred for groundwater. Guideline values for a number of substances at petrol stations have been proposed. For other substances, Swedish drinking water quality standards are used, where these are based on health criteria. If no Swedish value for drinking water quality
is available, corresponding values from the World Health Organization, the European Union and other countries may be used, on condition that they are based on health criteria.
There are no guideline values for contaminated surface water in
Sweden. However, use can be made of values developed in connection with the Swedish Environmental Quality Criteria for Lakes and Watercourses or the Canadian water quality criteria for the protection of aquatic life.
At present, there are no adequately documented effect-related values for sediment upon which to base a classification of current conditions. For certain substances, guideline values from other countries can be used. Se-lected effect limits are noted in Table 6, Appendix 4. For sediment, the de-viation from reference values is assigned greater weight when assessing the contamination level.
TABLE 4.
Criteria for the classification of current conditions
Moderate Slightly serious Moderately serious Serious Very serious Land, sediment and < guideline 1–3 x guideline 3–10 x guideline >10 x guideline groundwater, if guide- values values values values line values are available
Groundwater, if < drinking 1–3 x drinking 3–10 x drinking > 10 x drinking guideline values water quality water quality water quality water quality are not available standard* standard* standard* standard* Surface water < Cwq 1–3 x Cwq 3–10 x Cwq > 10 x Cwq
< L/W 1–3 x L/W 3–10 x L/W >10 x L/W Tox data < LC50/1000 LC50/1000– LC50/300– >LC50/100
LC50/300 LC50/100 * = threshold of risk to human health
Cwq = Canadian water quality criteria
L/W = material from Environmental Quality Criteria for Lakes and Watercourses; see Table 4, Appendix 4
If effects-related data of the type noted above are lacking for specific substances, assessments may be made with the help of toxicological and ecotoxicological data taken from reference books and data bases such as IUCLO. In the absence of more suitable information, it can be assumed that the LOEC (lowest observed effect concentration) is approximately the LC50 level divided by 1000, where the LC50 is the concentration at which fifty percent of the test organisms die. In certain tests, an EC (effects concentration) is used instead of the LC to describe acute effects.
The criteria used in assessing current conditions at contaminated sites are summarised in Table 4.
The classification of various substances in different media (except sediment) is presented in Appendix 4.
Deviation from the reference value
Reference value
Reference values represent the concentrations of substances which would be found at a site if it were not contaminated by one or more point sources. They can be used to determine the extent of contamination from such sources.
Reference values can often be obtained in the immediate vicinity of a given site, as long as the point source has not affected the area where they are measured. A contaminated site may, itself, function as an intermediate source of contamination that can affect its surroundings. The reference values given in Appendix 5 indicate the concentrations above which a site may be regarded as being affected by a point source. Sites where
concentrations are below those reference values may also be affected by a point source, though the observed levels may also be the result of natural causes or the diffuse spread of contaminants.
Thus, reference values reflect natural concentrations, possibly with some minor addition of contaminants from human activity. Urban areas usually have higher reference values than rural areas. Reference values may also be available for substances that do not occur naturally in the environ-ment. Reference values reflect current environmental conditions, and have nothing to do with levels that are regarded as desirable or levels that have negative effects.
Reference values can be established in a number of ways. The best reference values are based on data from areas that are unaffected by point sources in the immediate vicinity. Investigations based on the analysis of less than five samples are not valid in this context. Where 5–20 samples have been taken, either the highest or next-highest value is used as the reference value. Where more than twenty samples have been analysed, the 90th or 95th percentile may be used.
When there are no studies of nearby areas that are unaffected by point sources, regional or national data may be used. These often have the advantage of being based on a very large number of samples. If possible, reference values from several different studies are used. Appendix 5 includes reference values for various media, based primarily on national inventories.
For soil, the reference values presented correspond to the 90th percentile of the Swedish Geological Survey's geochemical mapping, involving the analysis of 12,000 samples of the fraction smaller than 0.063 mm, i.e. fine sand, silt and clay. Particle size affects metal concentrations:
In general, the smaller the particles, the higher the concentration of metals. Samples analysed in connection with inventories are the coarser, less homogenous fraction of particles smaller than 2 mm, which makes
comparisons more difficult. Pollutant concentrations measured for particles smaller than 0.063 mm are roughly 1.4 times greater than those measured for larger particles.
For soil, reference values for metals and certain organic substances in urban soils are available. The values are based on the sampling, analysis and statistical treatment of the data from 50–170 samples from each of nine urban areas. The 90th percentile of these samples is used as the reference value.
For groundwater, the reference values presented have been developed in connection with Environmental Quality Criteria for Groundwater. For both sediment and surface water, national reference values have been developed in connection with Environmental Quality Criteria for Lakes and Watercourses.
For marine sediments, national reference values have been developed in connection with Environmental Quality Criteria for Coasts and Seas.
For all four categories – soil, groundwater, surface water and sediment – there are also reference values available for certain group parameters and toxicity tests, based on a trial inventory conducted during 1994–1995. Some naturally occurring substances may register on tests for EGOM (extractable gas-chromatographic organic material), PBS (potential bioaccumulating substance) and AOX (adsorbable organic halogen). Elevated analysis results indicate either that organic contaminants may be present, or that background concentrations may be high. The organic group parameters are intended to serve a screening function that is suffi-ciently specific to determine whether or not a site is contaminated. The results of such analyses should be interpreted with caution, given that they provide no information on, for example, which chlorinated substances or PAHs (polycyclic aromatic hydrocarbons) may have affected the outcome.
Classification of the deviation from reference values
The criteria used to classify deviation from reference values for contami-nated sites are summarised in Table 5. Examples of such classifications for
TABLE 5.
Criteria for classifying the deviation from reference values Effect of point sources
Little or none Moderate Large Very large
a number of parameters in various media are provided in Appendix 5. The tables in which the sample characteristics best match the conditions at the site being assessed is the most appropriate for use in the assessment.
Amount & volume
The risk to health and the environment is also related to the amount of a contaminant at the site and the volume of contaminated material. There is no general method for determining whether an amount is considered to be large or small. The assessment of the amount of a contaminant is depend-ent upon its toxicity.
One possible set of classification criteria is proposed in Table 6; but this is not valid for contaminants of very high toxicity, such as dioxins. Such substances must be regarded as presenting an “extremely great hazard”, and their mere presence indicates that the amounts should be regarded as “very large”.
TABLE 6.
Criteria for classification of the amount of contaminants and the volume of contaminated material (in kilograms)
Amount/volume: Slight Moderate Large Very large
Amount of extremely — — Few kg Tens of kg hazardous contaminant
Amount of very — Few kg Tens of kg 100s of kg hazardous contaminant
Amount of moderately Few kg Tens of kg 100s of kg Tons hazardous contaminant
Volume of <1000 m3 1000–10 000 10 000–100 000 >100 000 m3 contaminated material
The volume of contaminated material (soil or sediment) is assessed without regard to type and concentration of the contaminant. In general, the greater the volume of contaminated material, the greater the risk. Assessing total volume is difficult and, at some sites, impossible, due to lack of information.
Comprehensive assessment of the contamination level
The level of contamination is assessed for each contaminant separately, in each of the media where it is present, by weighing all four major factors – current conditions, deviation from the reference value, amount of pollutant and volume of contaminated material.
Large amounts of contaminants occurring in high concentrations and in a large volume of material imply a high general contamination level. The reverse is true for sites with small amounts of a contaminant in low concentrations and small volumes of material. A site with a few “hot spots”, but with small total amounts of contaminants, has a lower general contamination level than a site with the larger amounts of the same con-taminants.
Conclusions from the assessment of the contamination level are en-tered on the form for comprehensive risk assessment. The substances that should go forward to the comprehensive risk assessment are those for which the contamination level is high or very high and those that are very or extremely hazardous.
References
Canadian Council of Resource and Environment Ministers for the Environment,
CCME Canadian Water Quality Guidelines; 1996
Swedish Environmental Protection Agency, The chemistry of groundwater in Sweden (In Swedish: Grundvattnets kemi i Sverige); report nr. 4415, 1995 Swedish Environmental Protection Agency (1996), Generic guideline levels for contaminated sites (In Swedish: Generella riktlinjer för förorenade områden – beräkningsprinciper och vägledning för tillämpning) Report No. 4638
Swedish Environmental Protection Agency, Bakgrundshalter i mark - halter av vissa
metaller och organiska ämnen i jord i tätort och på landsbygd; report nr. 4640, 1997
Swedish Environmental Protection Agency (1998), Proposed guideline levels for contaminated petrol stations (In Swedish: Förslag till branschspecifika riktvärden för förorenade bensinstationer). Report No. 4889
Swedish Environmental Protection Agency, Metallerna och miljön; report nr. 4135, 1993
Swedish Environmental Protection Agency, Långlivade organiska ämnen och miljön; report nr. 4136, 1993
Swedish National Food Administration, “Livsmedelsverkets kungörelse om dricksvatten”; SLVFS 1993:35, 1993
World Health Organization (WHO ), Guidelines for Drinking Water Quality:
BKL 123
7
x
As, Co, Pb, V Cu, Ni, Cr Cd, Zn Hg Mn, Mo, Ti
As, Cd, Co, Pb, V, Ni,
SPOT Cu, Ni, Cr Zn, Ha, EGOM, EOX
Mn, Mo, Ti
3
x
As, Cu Ni, Cd Cu Cr, Pb V, Co, Zn, Mo
Cu, EGOM As, EOX Al, Zn, Cd, SPOT,algae test Pb, Microtox
Appendix 4, Table 3: Norms for drinking water.
/////Appendix 5, Table 6: Environmental quality criteria for groundwater.
/////Note: This does notdoes notdoes notdoes notdoes not refer torefer torefer torefer torefer to observed mercury in groundwater.
Fredrika Norman, 1998-07-10
Page 1 of 2
Form C. CONTAMINATION LEVEL
Object: Recorded by (name, date): ID no.: Revised by
(name, date): Indicate uncertain items with question mark (“?”)
Soil
Note substances, with reference numbers in parentheses No. samples
Comparisons made with (tick): ❑ ...percentile, ❑ next-highest value, ❑ highest value, ❑ sensory impression Current conditions Slightly serious Moderately serious Serious Very serious Substances for which assessment of status is
not possible due to lack of comparative data
Deviation from Little or no effect Moderate effect Large effect Very large effect reference value from point source from point source from point source from point source Substances for which assessment of deviation is
not possible due to lack of comparative data
Slight Moderate Large Very large Amount of pollutant
Volume of
contaminated material References used
Groundwater
Note substances, with reference numbers in parentheses No. samples
Comparisons made with (tick): ❑ ...percentile, ❑ next-highest value, ❑ highest value, ❑ sensory impression Current conditions Slightly serious Moderately serious Serious Very serious Substances for which assessment of status is not
possible due to lack of comparative data
Deviation from Little or no effect Moderate effect Large effect Very large effect reference value from point source from point source from point source from point source Substances for which assessment of deviation is
not possible due to lack of comparative data References used
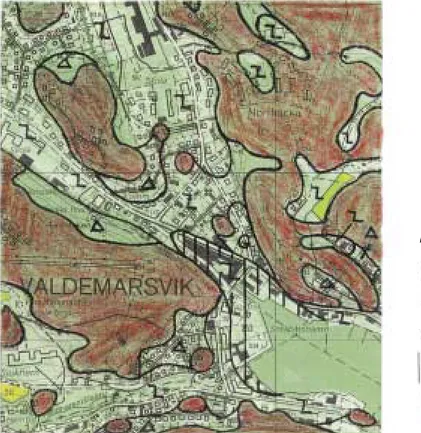
Valdemarsvik (formerly Lundberg's Leather)
Appendix 4, Table 1: General guideline values for contaminated soil ////Appendix 5, Tables 1-3: Background levels in soil
Surface water
Note substances, with reference numbers in parentheses No. samples
Comparisons made with (check): ❑ ...percentile, ❑ next-highest value, ❑ highest value, ❑ sensory impression Current conditions Slighty serious Moderately serious Serious Very serious Substances for which assessment of status is
not possible due to lack of comparative data
Deviation from Little or no effect Moderate effect Large effect Very large effect reference value from point source from point source from point source from point source Substances for which assessment of deviation is
not possible due to lack of comparative data References used:
Sediments
Note substances, with reference numbers in parentheses No. samples
Comparisons made with (check): ❑ ...percentile, ❑ next-highest value, ❑ highest value, ❑ sensory impression Current conditions Slighty serious Moderately serious Serious Very serious Substances for which assessment of status is
not possible due to lack of comparative data
Deviation from Little or no effect Moderate effect Large effect Very large effect reference value from point source from point source from point source from point source Substances for which assessment of deviation is
not possible due to lack of comparative data
Slight Moderate Large Very large Amount of pollutant
Volume of
contaminated material References used
Buildings and other constructions
Note substances, with reference numbers in parentheses No. samples
Slight Moderate Large Very large Amount of pollutant Volume of contaminated material References used Page 2 of 2
5
x Cd Al, V, Mn, Co, Mo As, Cd, Microtox Cr, Ni, Zn, As, Pb, Cu V, Cr, Ni, Cu, Zn, Pb, EOX, AOX Co Al, Mn, Mo/Appendix 4, Table 4: Environ. quality criteria for lakes and watercourses ///////Appendix 4, Table 4: Environmental quality criteria for lakes and watercourses
///////Note: This does notdoes notdoes notdoes notdoes not refer torefer torefer torefer torefer to observed mercury in groundwater
4
x
Zn, Cd, Ni, As, Pb, Co Cu, Hg, SPOT, EOX Cr
0
Potential for Migration
This section deals with the factors that determine how rapidly contaminants can be dispersed within and between various media, in concentrations and amounts that imply a risk for harmful effects.
Background
It is necessary to know how quickly contaminants (in concentrations and amounts that imply a risk for harmful effects) spread within and between different media.
It is not necessary to determine the exact rate of migration, since that would require significant resources and a large database. It is sufficient to carefully determine whether or not the spread of contaminants is currently in progress or likely to occur in the future, and in either case to estimate the order of magnitude of the migration rate.
In order to make such an assessment, the following information is re-quired:
• the geology and hydrology of the site • the chemical attributes of the soil • the current distribution of contaminants
• the characteristics of buildings and other constructions • the behaviour of the contaminants in the environment.
For most sites, the first phase of the inventory is based on information collected from a variety of sources, including on-site inspection, a descrip-tion of the site and its surroundings, maps and a preliminary analysis of the speed and direction of groundwater flows. For some sites, data may be available from previous studies of sufficiently high quality to be suitable for use. Descriptions and estimates of migration rates during the first phase should be completed during the on-site inspection, not afterwards, in order to ensure that all the necessary information is collected.
The information used in the second phase is more extensive. In addition to that collected during the first phase, it includes the results of fieldwork such as borehole samples, geological charts and analyses. The information thus obtained is still limited in scope, but nevertheless yields improved hydrogeological data on the slope of the groundwater surface, the characteristics of individual soil strata, the distribution of impermeable and porous layers, fracture zones in the bedrock, and other phenomena which provide favourable conditions for the spread of contaminants.
Information concerning the behaviour of contaminants in the environ-ment is available from the scientific literature and from persons with expertise in the area.
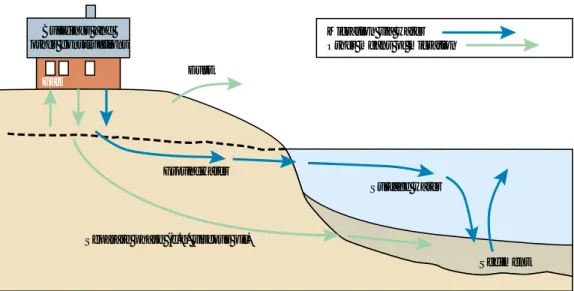
The most common mode of transport for environmental contaminants is via water. However, some contaminants, e.g. viscous oil, move in a separate phase through the environment. Others are transported via the atmosphere, either as gases or as particles. Apart from the means of transportation, the migration rate is influenced by such factors as degrada-tion processes, diludegrada-tion and sorpdegrada-tion.
FIGURE 1: Migration pathways of contaminants in the environment. Each arrow indicates a pathway considered in risk classification.
The transport of contaminants in various media is described for the area that is already contaminated, as well as for the surrounding area which may be affected in the future by levels of contamination that imply a risk of harmful effects. Together, they comprise the “affected area” which includes all associated media – soil, buildings and other constructions, groundwater, surface water and sediments.
The migration rate is described on the basis of a “reasonably conservat-ive” scenario. The greater the uncertainty of the data, the more conservative the assessment. Special attention must be paid to phenomena and condi-tions which, in themselves, can increase or decrease the rate of contaminant migration, for example: impermeable layers, utility trenches, piles, below-ground constructions, layers of sand and gravel, and fracture zones.
It is difficult to calculate the migration rate when the available informa-tion is limited, which is often the case. The assessment form shown in Appendix 6 is intended to assist in this regard. It serves as a checklist to ensure that all conceivable transport paths have been considered, thus helping to systematise the data from which the migration rate is estimated. A map of the “affected area” and a diagram of boreholes are drawn directly
Buildings and other constructions
Gas Dust
Groundwater
Separate phase (e.g. viscous oil)
Surface water
Sediment Migration via water
on the form. An example of a completed form is provided at the end of this chapter.
The migration of every contaminant is described separately for each medium in which it is present. Historically documented migration patterns are often helpful in estimating current and future distribution.
The following sections explain how to draw a borehole diagram, system-atise the data, and calculate or estimate the rate of contaminant migration.
Borehole diagram and map of “affected area”
A borehole diagram, including any lakes or watercourses in the area, is drawn on Form D, “Migration Factors”. The diagram should include the soil types and their distribution, the elevation of the ground surface, the height of the groundwater table, the level of the upper edge and tip of the borehole casing, and other standard borehole data. The data should always be presented according to the reporting standards of the Swedish
Geotechnical Association.
A map of the affected area should also be drawn on the form and include the contaminated site and the surrounding area within which there is a risk of future contamination. A rough sketch of the map is made at the begin-ning of the assessment of migration potential, and is completed after all the migration pathways have been considered. It may sometimes be necessary to divide the area into sub-sections, each with different conditions.
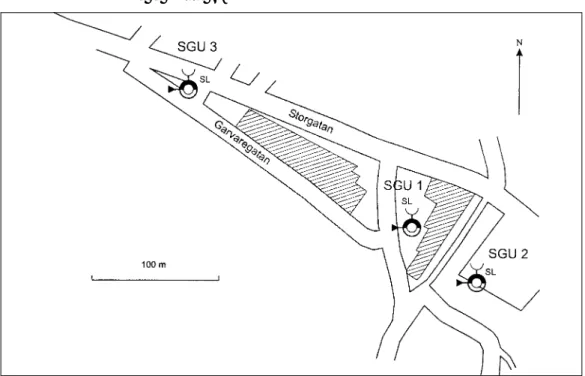
The boundaries of the affected area are comprised of lakes, drainage channels (i.e. watercourses), surface depressions, and any other feature that may arrest the flow of groundwater and thereby limit the expansion of a contamination “plume”. If there are no natural or artificial barriers to this expansion, the approximate distance of contaminant migration over one thousand years is used to denote the outer limit of expansion. This applies only to contamination concentrations and/or amounts that imply a potential risk to human health and the environment. The completed map should be drawn on a scale of 1:10,000, and indicate the area boundaries, grid inter-sections, the direction of groundwater flows, the geographical north, and the locations at which contamination has been verified.
Migration to and from buildings and other constructions
Contaminants may disperse from buildings and other constructions to be transported via soil, groundwater, surface water or sediments. This migration should be estimated as the percentage leached per year. The movement of gases and fluids from the ground and into the buildings should also be described. The permeabilities of both the ground and the building are key factors with respect to the penetration of volatile substances into buildings.
Migration in soil and groundwater
The distance over which contaminants can migrate each year in the ground and in groundwater should be noted. The migration of both water-soluble
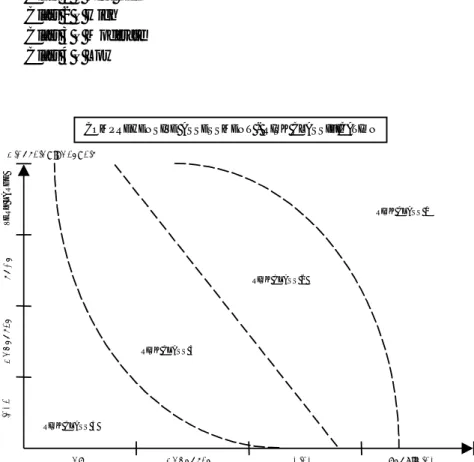
HYDRAULIC CONDUCTIVITY m/s 10-1 10-2 10-3 10-4 10-5 10-6 10-7 10-8 10-9 10-10 10-11 10-12 GRAVELLY MORAINE GRAVEL SANDY MORAINE SAND SILTY MORAINE SILT CLAY MORAINE CLAY MORAINE CLAY PEAT ≤H5 >H5 COMPACTED PEAT 1000 100 10 1 0,1 0,01 0,001
FLOW RATE m/yr
PERMEABLE SEMI-PERMEABLE IMPERMEABLE
substances and substances that move in a free phase or in the form of dust particles should be included.
The rate of migration for water-soluble contaminants is described or calculated first. The initial assumption is that they move at the same speed as the groundwater.
It is appropriate to make a preliminary calculation of the groundwater flow in the soil. This can be done by reference to Figure 2. The flow rates indicated are those that apply when the slope of the groundwater surface is one percent. If instead the slope is, for example, five percent, the rate of flow increases by a factor of five.
FIGURE 2: Groundwater flow rate and hydraulic conductivity in various soils, where the slope of the groundwater surface is one percent (ref. Carlsson & Gustavsson, 1984). (Light-grey indicates area of uncertainty).
A contaminant that infiltrates through the ground surface is transported via the unsaturated zone down to the groundwater. The rate at which this occurs depends on the permeability of the soil above the water table. It is assumed that any contaminant located above the water table will eventually filter down into the groundwater.
Groundwater tends to flow through those sections of the soil where the resistance is least. Contaminants are often spread out in a branching pattern. It may be assumed that groundwater flows at right angles to the contours of the ground surface, from higher to lower ground.
Theoretically, a so-called “migration plume” extends from the source of contamination in the direction of the groundwater flow – if the soil has a uniform composition. However, such a pattern seldom occurs in reality. Because of diffusion and differences in density, migration may even occur at right angles to or in the opposite direction of the groundwater flow.
After first equating the rate of contaminant migration with the groundwater flow rate, the following factors must also be considered:
• degradation of contaminants
• sorption of contaminants in the ground
• increases in the rate of contaminant migration due to:
a) presence of natural transport paths such as cracks in dry clay, layers of sand, gravel and clay, peaty soils, fracture zones in rock, etc. b) man-made transport paths such as technical installations, including
drainage ditches in industrial areas, utility trenches, piles, tanks, old and new sewers, sewage and water discharges into lakes and ditches, below-ground constructions, paved surfaces, etc.
• Past migration. Information about present migration pathways can be deduced by observations of settling in the ground or landfills, changes in the odour and colour of soil layers, and changes in vegetation, as well as by sampling and analysis.
Each of these factors can give cause for modification of the migration rate initially assumed.
Separate migration rates must be calculated or estimated for contami-nants that move in a free phase. Their speed depends primarily on the ground's permeability and on the composition of the fluid, i.e. whether or not it is viscous.
Separate rates are also calculated for contaminants that can be spread in the form of dust. The rate depends primarily on the extent of vegetation cover, exposure to wind, and the moisture content of the ground surface.
Migration from soil and groundwater to surface water
Contaminants can spread from soil and groundwater to nearby lakes and watercourses. An assessment can be made both for watercourses and for the lakes they discharge into. If the surface water is already contaminated, that fact is noted on Form D. If it is not contaminated, an estimate is made of how many years it takes for contaminants in soil and groundwater to migrate to it.
The direction of the groundwater flow determines which surface water body is threatened with contamination. The length of time to contamina-tion is related to the distance from the contaminant's starting point to the surface water, the migration rate in soil and groundwater, and the volume of run-off via the ground surface, ditches and sewage lines.
Contaminants are spread to watercourses via groundwater or run-off from the land. It is not unusual for older sewers to empty directly into a lake or watercourse. Even if these are no longer being used for their original pur-pose, contaminated water may drain through them. Ditches and drainage systems that have been, or are still being, used to transport surface water and/or shallow groundwater may also transport contaminated water. Maps and diagrams are the most suitable references for locating such channels, but changes in vegetation and visible chemical deposits may also provide clues.
It may be difficult to observe deep groundwater inflows to lakes and watercourses, but springs on lake-bottoms are not unusual. These are often located in deep holes where the water is colder than the surrounding water during summer.
Contaminant migration to surface water occurs more rapidly from soils located in a groundwater outflow zone than from those in an inflow zone. Calculations should be made both for substances dispersed via water and for those that move independently.
Initially contaminants should be assumed to migrate at the same speed as the soil- and groundwater. The next step is to determine whether there is any reason to modify that assumption on the basis of the following factors: • spreading of contaminants into lakes and other destinations via run-off
from land, ditches and sewers
• increased migration rates due to high and varying water tables, high surface-water levels and flooding.
Migration in surface water
The distance travelled by the contaminants is expressed in terms of kilo-metres per year. The factors determining contaminant transport are the flow rate and the water turnover in surface water bodies. A rapid turnover can lead to such dilution of the contaminants in surface water that they do not reach harmful levels.
Initially it should be assumed that contaminants migrate at the same rate as the water flow. The next step is to determine whether there is any reason to modify that assumption because of uneven migration.
In general, the rate of migration is related to water flow conditions and the type of surface water involved. A complete blending of contaminants with flowing water does not usually occur until they have been transported over a fairly long distance. The rate and extent of mixing may vary with bottom conditions, the volume of the water flow and other factors.
Migration in lakes and along shorelines is often related to the water turnover, the water depth, the size of the lake, wind conditions and other factors. Turnover times for small Swedish lakes are often a year or longer. Contaminated water from land areas can settle at various depths in the water column due to differences in water density resulting from variations in temperature and salinity.
Migration in sediments
The rate of migration for contaminants in sediments, at levels that imply potentially harmful effects, should be given in metres per year. There are two types of migration processes:
1. The migration of contaminants in a separate, sinking phase or con-taminants bound to a rapidly sinking solid phase, e.g., lead shotgun pellets, red lead oxide in sand-blasting waste, and heavy oils. The migration rates for such substances are slight to moderate.