Working Papers n° 1
May 2003
by Ulf Fredriksson
New technologies
in education:
trends, risks and
opportunities
The views expressed by the author do not represent the official position of Education International, they are nevertheless invaluable contributions to the ongoing discussions and research conducted at Education International.
Education International Working Papers is a series of research documents produced for
web-publishing. Originally written by EI staff for conferences, round tables, seminars and other EI activities, or specially commissioned for certain research projects, EI Working Papers are intended to supplement ongoing discussions and research in EI and do not necessarily reflect EI's official positions.
To obtain a copy of an EI Working Paper in PDF format, please feel free to download it directly from our website. Hard copies can be ordered from the Brussels headquarters:
Education International
5 bd du Roi Albert II
B-1210 Brussels, Belgium
Tel: +32 2 224 0611
Fax: +32 2 224 0606
info@ei-ie.org
www.ei-ie.org
Please note that EI Working Papers are normally published in the original language in which they are written, and you should first consult us before undertaking any translation, for reasons of copyright.
Education International is eager to involve researchers (both individuals and from our affiliates) working on any of the wide array of topics pertaining to our work. Should you like to have your paper included in this series, please contact Elie Jouen (elie.jouen@ei-ie.org) Ulf Fredriksson (ulf.fredriksson@ei-ie.org) for further information.
Education International Working Paper No.1 (May 2003): "New technologies in education: trends, risks and opportunities" was written as a background paper to the Education International Round Table for the European Region on Information and Communication Technologies in Education held in Amsterdam on 14-15 November 2002. The paper was written by Ulf Fredriksson, Research Coordinator at the Education International Secretariat in Brussels.
New technologies in education: trends, risks and
opportunities
One of the most radical changes in many societies over recent decades has been the development of new technologies in the area of information and communication. These changes are even sometimes referred to as an "information revolution" and it is assumed that societies are in the process of developing into what has been called "the information society" or "the knowledge society". These changes have affected education and will probably in the future affect the development of education even more. The purpose of these papers is to discuss some of the changes we have seen in this field and the kind of developments we may expect. Due to the importance of these developments, there is a need for teacher unions to reflect on their strategies related to the use of new technologies in education.
1.
Changes in society
During the second part of the last century, computers and the use of computers went through a rapid and profound change. In the 50's and the 60's computers were huge machines used to make complicated calculations and to store large databases. Gradually in the 70's and the 80's computers turned into desk-tops, not only used for calculations but also for word processing. Progressively, computers replaced typewriters in offices and homes. In the 90's the computers became even smaller and portable computers, referred to as lap-tops, became more common. The computers were no longer only calculators and typewriters, but also became instruments for communication. Through the development of and the expanded use of e-mail and the World Wide Web (www), people got the opportunity to send and receive message and to find information through their computers. The computers became an important complement to the telephone, the fax and the ordinary post service. On top of this development, the use of computers has further developed in many other areas of relevance to a range of specific tasks.
1.1. In business
In the 50's a few enterprises had computers which were usually located at special centres. Today, computers are found in almost all types of enterprises. Table 1 below gives some indications of this development.
The figures in the table do not give the whole picture of the use of computers in working life, but they give an idea about how widespread ICT1 is and the rapid
changes which have taken place during recent years.
Table 1. Level of Internet access in enterprises
% of enterprises with access to internet Country 2000 2001 Austria 84 99 Belgium 79 93 Denmark 87 96 Finland 92 99 France 58 73 Germany 82 96 Greece 54 83 Iceland 94 : Ireland 77 95 Italy 72 91 Japan 45 : Luxembourg 55 85 Netherlands 65 91 Norway 73 : Portugal 64 66 Spain 67 92 Sweden 90 99 United Kingdom 63 84 : no information available Source: Eurostat, 2002 1.2. In the home
In the same way as new technologies have become an integrated part of activity at many workplaces the use of computers and access to computers have increased in the home. Table 2 gives a picture of the level of Internet access in homes.
Table 2. Level of Internet access in homes
% of homes with access to internet Country 1998 1999 2000 2001 Austria 6.8 12 38 47.2 Belgium : 12 29.2 36.4 Denmark 8.2 35 51.6 58.6 Finland 17.2 21 43.5 50.2 France 3.9 8 19 30.1 Germany 24.6 11 27.1 38.4 Greece 7.1 3 11.7 9.9 Iceland : : : 69.7 Ireland 8.4 6 35.5 47.6 Italy 6.1 7 23.7 33.5 Japan : 19.1 34 : Luxembourg 14 17 36.3 43 Netherlands 19.6 21 54.8 63.8 Norway : : : 58.2 Portugal 3.4 4 18.1 26.1 Spain 5 6 15.7 24.7 Sweden 39.6 51 53.8 60.7 United Kingdom 10.7 17 40.9 49.3 United States : 30 46.7 : : no information available Source: Eurostat, 2002
It should be kept in mind that the figures above mainly cover information from industrialised countries. Table 3 below gives figures on the number of computers per thousand inhabitants and the number of Internet hosts per 100,000 inhabitants in different regions of the World.
Table 3. Number of computers per thousand inhabitants and number of Internet hosts per 100,000 inhabitants in different regions of the World (1997)
Region Number of computers per
thousand inhabitants Number of internet hostsper 100 000 inhabitants
More developed regions of
which: 274 3411
Northern America 388 7106
Asia / Oceania 223 1357
Europe 204 1336
Countries in transition 35 116
Less developed regions of
which: 12 16
Sub-Saharan Africa 8 21
Arab States 10 5
Latin America / Caribbean 31 49
Eastern Asia / Oceania 13 18
Southern Asia 2 1
Least developed countries 1 0
World total 58 515
Source: UNESCO, 2000
As can be seen in the table there are huge variations between regions. These differences are often referred to as the "digital divide".
2.
New technology in education
Based on the statistical information given above, it can be concluded that computers and ICT are used at many workplaces and in many homes in the industrialised countries. But what is the situation in schools? According to OECDs indicators (OECD, 2002) show that for many 15-year-old, daily contact with computers is much more likely to occur in the home than at school.
There are mainly two sources available which can offer the internationally comparable information needed to answer this question; the statistics from the European Union presented in the report "Basic Indicators on the Incorporation of ICT into European Education Systems. Fact and figures" (European Union, 2001) and the findings of the SITES2 study. Results from SITES have so far been published in a
report "ICT and the Emerging Paradigm for Lifelong Learning. An IEA Educational Assessment of Infrastructure, Goals, and Practices in Twenty-six Countries", (Pelgrum & Anderson, 2001) and in "Education at a Glance" (OECD, 2001). This information mainly covers the industrialised countries. The information from the
European Union covers the 15 EU countries3 and the SITES project has covered 26
countries4, but not all information from SITES covers all the 26 countries.
Internationally comparable information about new technology and education in other parts of the world is available to a much lesser degree.
2.1. Access to computers and the internet
IEA5 conducted a large study on Computers in Education to assess the which and
how computers are being used in education in 12 different countries (Pelgrum, Jansen Reinen, & Plomb; 1993). Data was collected on two occasions, in 1989 and in 1992, making it possible to see what changes took place over time. An increasing number of schools acquired access to computers between 1989 and 1992, but a substantial number of primary and lower secondary schools in several countries still did not posses computers for instructional use in 1992. In almost all countries, the number of computers in schools increased considerably in the three years, but most equipment still consisted of quite old fashioned machines. Also, the availability of instructional tool software increased between 1989 and 1992, but shortages of software were still seen as a problem in many countries.
More recent and detailed information from Eurostat/Eurydice in table 4 gives a slightly different picture, as well as the information from the SITES study presented in table 5 and from the PISA6 study presented in table 6.
Based on the figures in tables 4, 5 and 6, three conclusions can be drawn: 1) There are big differences between the schools systems in the European countries concerning the availability of computers and access to the Internet. 2) In some countries there are considerable differences between the number of computers available and the number of computers available with an Internet connection. 3) In almost all countries the availability of computers is higher in secondary education than in primary education.
3 Austria, Belgium, Denmark, Finland, France, Germany, Greece, Ireland, Italy, Luxembourg,
Netherlands, Portugal, Spain, Sweden and United Kingdom
4 Belgium (Fr.), Bulgaria, Canada, China (Hong Kong), China (Taiwan), Cyprus, Czech
Republic, Denmark, Finland, France, Hungary, Iceland, Israel, Italy, Japan, Latvia, Lithuania, Luxembourg, New Zealand, Norway, Russian Federation, Singapore, Slovak Republic, Slovenia, South Africa and Thailand.
5 IEA - International Association for the Evaluation of Educational Achievement 6 PISA - Programme for International Student Assessment
Table 4. Number of pupils per computer and number of pupils per computer with an Internet connection
Country Number of pupils per computer Number of pupils per computer with an internet connection
primary secondary primary secondary
Austria 8.9 8.5 17.0 10.5 Belgium 11.0 8.0 32.5 14.2 Denmark 4.2 1.5 6.0 2.0 Germany 19.2 13.7 52.3 22.0 Greece 29.4 15.2 80.6 22.0 Finland 7.5 6.8 11.9 7.5 France 14.1 9.4 43.9 21.4 Ireland 11.6 8.3 30.1 13.1 Italy 20.8 8.9 55.1 18.9 Luxembourg 2.0 6.3 5.1 6.7 Netherlands 8.3 9.1 43.2 15.4 Portugal 17.0 16.4 36.3 36.9 Spain 11.2 12.4 30.0 25.3 Sweden 9.7 4.1 13.4 4.8 United Kingdom 11.8 6.4 23.5 8.9
Source: European Commission/Eurydice (2001)
Table 5. Ratio of total number of students to total number of computers available to students (1998 - 1999)
Country Primary education Lower secondary
education Upper secondaryeducation
Belgium (Fr.) m 29,7 32.2 Czech Republic m 43.7 17.4 Denmark m 11.7 m Finland 16.3 13.5 m Hungary m 35.6 m Iceland 20.5 18.8 17.0 Italy 157.7 30.1 24.4 Luxembourg m 15.6 16.3 Netherlands 27.0 19.5 m Norway 22.9 13.8 5.8 m = missing data
Source: International Association for the Evaluation of Educational Achievement (IEA)/SITES, quoted from OECD: Education at a glance. OECD Indicators 2001.
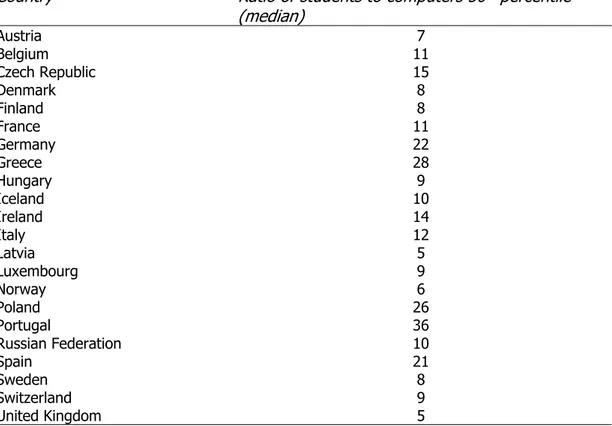
Table 6. Ratio of students to computers (2000)
Country Ratio of students to computers 50th percentile
(median) Austria 7 Belgium 11 Czech Republic 15 Denmark 8 Finland 8 France 11 Germany 22 Greece 28 Hungary 9 Iceland 10 Ireland 14 Italy 12 Latvia 5 Luxembourg 9 Norway 6 Poland 26 Portugal 36 Russian Federation 10 Spain 21 Sweden 8 Switzerland 9 United Kingdom 5
Source: OECD PISA database, 2001, quoted from OECD: Education at a glance. OECD Indicators 2002.
An interesting question, which is reflected in tables 7 and 8, is the extent to which computers in schools are used. Table 6 shows the percentage of teachers in primary education who had used computers and/or the Internet in the classroom in 2001 With the exception of Greece, Luxembourg, Portugal and Spain, a majority of the teachers in primary education had used computers in the classroom sometime during year 2001. More than 50% of the primary teachers had used the Internet in the classroom in Denmark, Finland, Ireland, Sweden and United Kingdom.
Table 7. Percentage of teachers using computers and/or Internet in the classroom. Primary education. 2001
Country Teachers using computers (%) Teachers using internet (%)
Austria 59 23 Belgium 86 34 Denmark 88 69 Germany 37 11 Greece 12 4 Finland 95 78 France 76 27 Ireland 95 80 Italy 65 26 Luxembourg 27 27 Netherlands 96 34 Portugal 39 18 Spain 46 19 Sweden 80 54 United Kingdom 100 56
Source: European Commission/Eurydice (2001)
Table 8 shows how many hours per week teachers in primary education who had used computers in the classroom in 2001 actually claimed that they had used the computers.
Table 8. Average periods during which primary schoolteachers used in the classroom, in hours per week in, 2001
Country Average periods during which primary schoolteachers, who
state that they use computers with their pupils, used computers (with or without internet connections) in the classroom, in hours per week in, 2001
Austria 2.2 Belgium 3.7 Denmark 3.1 Germany 2.9 Greece 4.3 Finland 3.9 France 3.4 Ireland 6.8 Italy 3.1 Luxembourg 4.1 Netherlands 7.5 Portugal 2.8 Spain 3.1 Sweden 5.8 United Kingdom 7.9
Source: European Commission/Eurydice (2001)
On average those primary teachers within the EU who used computers with their pupils did so for five hours a week. There are significant differences between the countries. In the UK, those teachers who used computers did so for about 8 hours a week and in Austria for about 2 hours. It should be kept in mind that, in the UK, almost all primary teachers used computers in the classroom, while in Austria about
40% of the primary teachers did not use computers at all in the classroom. In Greece, those 12% of the primary teachers who used computers used them on average 4.3 hours a week. The remaining 88% of Greek primary teachers did not use computers at all.
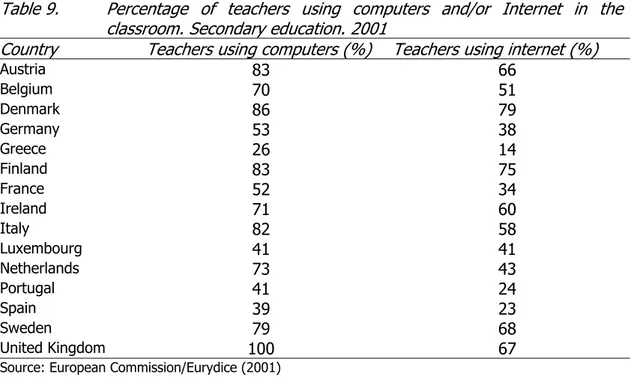
Table 9 shows the percentage of teachers in secondary education who had used computers and/or the Internet in the classroom in 2001.
Table 9. Percentage of teachers using computers and/or Internet in the classroom. Secondary education. 2001
Country Teachers using computers (%) Teachers using internet (%)
Austria 83 66 Belgium 70 51 Denmark 86 79 Germany 53 38 Greece 26 14 Finland 83 75 France 52 34 Ireland 71 60 Italy 82 58 Luxembourg 41 41 Netherlands 73 43 Portugal 41 24 Spain 39 23 Sweden 79 68 United Kingdom 100 67
Source: European Commission/Eurydice (2001)
With the exception of Greece, Luxembourg, Portugal and Spain, a majority of the teachers in secondary education had used computers in the classroom sometime during 2001. More than 50% of the secondary teachers used the Internet in the classroom in Austria, Belgium, Denmark, Finland, Ireland, Italy, Sweden and United Kingdom. It should be added that teachers of computer science were included in the figures used to calculate the percentages indicated in table 8. It can be noted that the use of computers in secondary education seems to be less frequent than in primary education. In total in the EU, 71% of the primary teachers used computers in the classroom on some occasion, while the corresponding figure for secondary education was 60%.
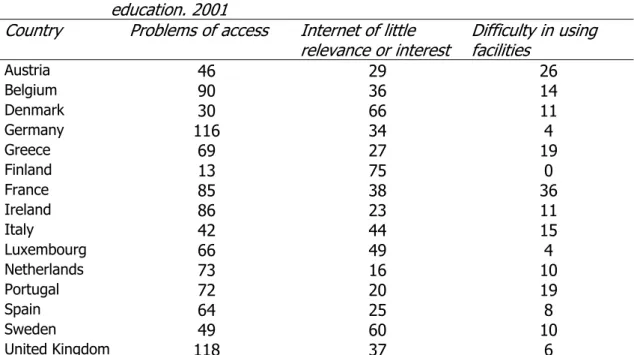
Table 10 shows the reasons given by teachers in secondary education why they have not used computers and/or the Internet in the classroom in 2001.
Table 10. Teachers' reasons for not using the Internet with pupils. Secondary education. 2001
Country Problems of access Internet of little
relevance or interest Difficulty in usingfacilities
Austria 46 29 26 Belgium 90 36 14 Denmark 30 66 11 Germany 116 34 4 Greece 69 27 19 Finland 13 75 0 France 85 38 36 Ireland 86 23 11 Italy 42 44 15 Luxembourg 66 49 4 Netherlands 73 16 10 Portugal 72 20 19 Spain 64 25 8 Sweden 49 60 10 United Kingdom 118 37 6
The percentages shown are sometimes over 100, because the teachers were able to give several reasons for not using internet.
Source: European Commission/ Eurydice (2001)
With the exception of Denmark, Finland, Italy and Sweden, the most common reason for teachers not using the Internet with the pupils is problems of access. When the teachers have indicated that they have problems of access to the Internet, the reasons for this may be that the classrooms do not have Internet connection facilities or that the schools do not have computers or Internet connections. It should be noted that those countries, in which a fairly high percentage of the teachers said that they did not use the Internet with pupils because it was of little relevance or interest, were in most cases countries with comparatively good access to computers and Internet. Obviously, when access to computers and the Internet is at a high level, there is still a considerable number of teachers who deliberately choose not to use these tools. Reasons given for regarding the Internet as of little relevance or interest are that the teachers do not find it helpful for work in their subjects or that the information on the net is not in the language of the country concerned. A comparatively small percentage of teachers claim the Internet is not used because of difficulties using it. Such difficulties could be either that the teachers do not know how to use it or that not enough students have sufficient skills to use it. The only country where this reason is given by more than a third of the teachers is France. Data from SITES (Pelgrum & Anderson, 2001) indicates that a fairly high percentage of the schools who have computers in the countries covered by the study have computers which are not used. The most common reason why the computers are not used seems to be that they are outdated. Lack of knowledge of how to use the computers among teachers and students seems to be a minor reason for not using computers. Data from SITES also indicates that, in most of the countries covered by the study, more than 50% of the primary school pupils had access to the Internet. In most of the countries, there seem to be plans in place aimed at ensuring that almost all of the schools have Internet access before 2001. The picture concerning lower secondary education is more diverse. Countries like Iceland already have 100% of the schools linked to the Internet while in other countries such as the Czech Republic, 33% of the lower secondary school students are in schools linked to the
Internet. In many countries, plans exist to see that almost all of the schools will have access to the Internet before the end of 2001. The Czech Republic and Hungary will still have a large number of students in lower secondary schools without Internet access after 2001. The picture for the upper secondary schools is basically the same as for the lower secondary schools.
When the availability of different software in schools was examined in the SITES study, it was found that, of the softwares covered in the study, Internet browsers seemed to be the most common in several countries and educational games the least common. Countries with a fairly good access to computers also seem to be the countries that overall had better access to different types of software.
2.2. How are computers used in education?
The next question of importance is to examine how computers are used in schools. The IEA study on Computers in Education in 1992 (Pelgrum, Jansen Reinen, & Plomb; 1993) tried to examine how computers had been used in education in 12 different countries. The most popular use of computers at that time in schools was for teaching about computers and applications and how to handle them. Only a minority of the students used computers regularly in subjects like Mathematics, Science and Mother Tongue. Results from TIMSS7 (Beaton et al.; 1996) suggested
that the weaker students used computers in school to a larger extent then the “better” students, at least in Science and Mathematics.
A group of researchers (Harasim, Hiltz, Teles, & Turoff; 1995) asked teachers who had used the Internet as a part of the learning process what changes they had observed. These teachers had observed the following changes;
- the role of the teacher changed to that of facilitator and mentor;
- students became active participants; discussions became more detailed and deeper;
- access to information resources expanded significantly; - learners became more independent;
- access to teachers became equal and direct;
- interactions among teachers were increased significantly; - education became learner centred; learning became self-paced;
- learning opportunities for all students became more equal; learner-learner group interactions were significantly increased;
- teaching and learning increased;
- the teacher-learner hierarchy broke down: teachers became learners, and learners became teachers.
Based on studies in the field, COMMITT8 (Plomb, Brummelhuis, & Rapmund; 1996)
identified three stages that teachers pass through on their way to becoming experienced technology users;
1) The teachers use computers to support traditional methods of teaching, such as drill-and-practice, text orientation, whole group lectures and seatwork.
7 TIMSS - The Trends in International Mathematics and Science Study
8 An advisory Committee for the Dutch Ministry of Education, Culture and Science (COMMITT
2) The teachers gain confidence and use technology as part of more innovative instruction, including team teaching, interdisciplinary project-based instruction, and individually paced instruction.
3) The teachers enter an inventive stage in which they experiment and change, using technology to support active, creative and collaborative learning.
The results from the SITES study (Pelgrum & Anderson, 2001) seem to indicate that the student : computer ratio is the factor which has the strongest influence on the development of new pedagogical practices in schools.
Table 11 shows the extent to which the principals involved in the PISA study believed that learning was hindered by a lack of computers in their schools.
In the OECD countries, more than 37 % of the students of 15 years-old were enrolled in schools where principals reported that learning was hindered to some extent or a lot by the lack of computers for education.
Table 11. The extent to which learning is hindered by a lack of computers for instruction (2000)
Country Not at all
(%) Very little (%) To someextent (%) A lot(%)
Austria 30 32 23 15 Belgium 49 32 15 3 Czech Republic 37 25 28 10 Denmark 32 40 21 6 Finland 16 41 35 7 France 39 33 23 5 Germany 20 30 35 15 Greece 15 17 40 28 Hungary 69 18 9 4 Iceland 26 29 41 4 Ireland 34 24 30 12 Italy 42 26 26 6 Latvia 25 35 24 16 Luxembourg 24 53 23 n Norway 12 28 52 9 Poland 33 29 27 12 Portugal 27 35 31 8 Russian Federation 11 3 31 55 Spain 43 27 23 7 Sweden 21 29 40 11 Switzerland 40 37 19 4 United Kingdom 35 33 24 7
n =magnitude is either negligible or zero
Source: OECD PISA database, 2001, quoted from OECD: Education at a glance. OECD Indicators 2002.
2.3. Teachers' knowledge about computers
Another important question is what knowledge and skills teachers have in using computers and, linked to this, the extent to which they have received training and had opportunities to get training.
Table 12 shows the percentage of students in schools whose principals have indicated that the school had adopted policy goals to train all teachers to use ICT and the percentage reflecting these goals were almost completely or fully realised.
Table 12. Goals and realisation of goals for training teachers in ICT (1998 - 1999) Primary
education Lower secondaryeducation Upper secondaryeducation Country Goals Realisatio n Goals Realisatio n Goals Realisatio n Belgium (Fr.) m m 81 10 78 11 Czech Republic m m 83 12 84 17 Denmark m m 85 19 m m Finland 97 32 98 31 m m Hungary m m 97 7 m m Iceland 80 10 78 8 79 7 Italy 86 23 90 14 91 17 Luxembourg m m 71 5 71 5 Norway 95 20 97 24 97 24 m = missing data
Source: International Association for the Evaluation of Educational Achievement (IEA)/SITES, quoted from OECD: Education at a glance. OECD Indicators 2001.
As can be seen in the table, most students in those countries for which data exists seem to be in schools where goals have been set to train teachers in ICT. It can also be noted that a much lower percentage of students are in schools where these goals have been realised.
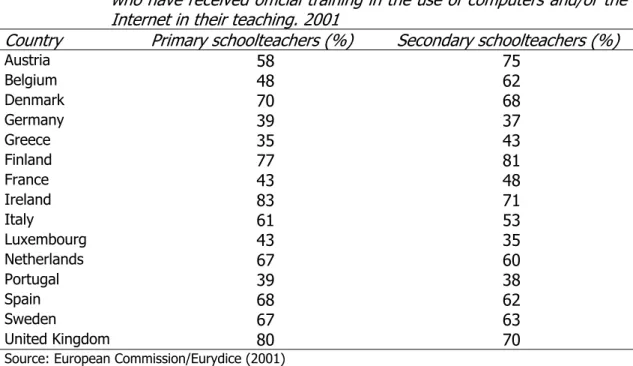
Table 13 shows the percentage of primary schoolteachers and secondary schoolteachers who had received official training in 2001 in the use of computers and/or the Internet in their teaching.
Table 13. Percentage of primary schoolteachers and secondary schoolteachers who have received official training in the use of computers and/or the Internet in their teaching. 2001
Country Primary schoolteachers (%) Secondary schoolteachers (%)
Austria 58 75 Belgium 48 62 Denmark 70 68 Germany 39 37 Greece 35 43 Finland 77 81 France 43 48 Ireland 83 71 Italy 61 53 Luxembourg 43 35 Netherlands 67 60 Portugal 39 38 Spain 68 62 Sweden 67 63 United Kingdom 80 70
On average 52% of the primary teachers in the EU have received training and 50% of the secondary teachers. The figures given by the European Commission/Eurydice are generally higher than the figures from the SITES study. One reason for this can of course be that the EU figures are more recent than the SITES figures. If that is the explanation, it can be assumed that a large number of teachers in the EU countries actually have received ICT training during the last 2 - 3 years.
Table 14 shows the percentage of teachers in the EU who have received official training in the use of computers and/or Internet, broken down by age, gender and, in the case of secondary teachers, in which subject they teach.
The pattern seems to be more or less the same, irrespective of the age of the teacher and the gender of the teacher. Also, in the case of subjects, there do not seem to be any big differences between different groups of subject teacher in secondary education.
Table 14. Percentage of primary teachers and secondary teachers in the EU who have received official training in the use of computers and/or Internet
Primary teachers who have been officially trained in the use of
Secondary teachers who have been officially trained in the use of
computers internet computers internet
20 - 29 years old 62 46 50 39 30 - 39 57 40 46 35 40 - 49 60 40 49 33 50 and over 62 37 47 30 Men 62 44 49 34 Women 60 39 47 32 Sciences - - 49 34 Social sciences - - 43 31 Humanities - - 44 27 Languages - - 52 37 Professional/technical courses - - 46 27 Computing - - 54 40 Others - - 44 31
Source: European Commission/Eurydice (2001)
According to SITES (Pelgrum & Anderson, 2001), general introductory courses seem to be the type of courses most often available and most of these courses are available as "in-house" courses. Other types of courses seem to be available to a lesser extent, but more frequently as external courses. Training on software seems to be less common than training on hardware. The most frequent software courses are introductory course for applications / standard tools and these courses seem to be more often in-house than external. It is less common for teachers to have participated in other types of courses and, when they have participated in such courses, they have more often been external courses than in-house training. Most of the courses available for teachers in the field of ICT training on the Internet and multimedia seem to be introductory courses. In countries where the use of computers in schools tends to be more common, these courses are in-house, while in other countries they are available externally. More advanced courses in this field are
less common, and more often offered externally than in-house. Pelgrum and Anderson (2001) conclude, based on their data, that "the most prevalent arrangements involved informal contacts, computer coordinators, courses run by external agencies and in-school courses" (p. 165).
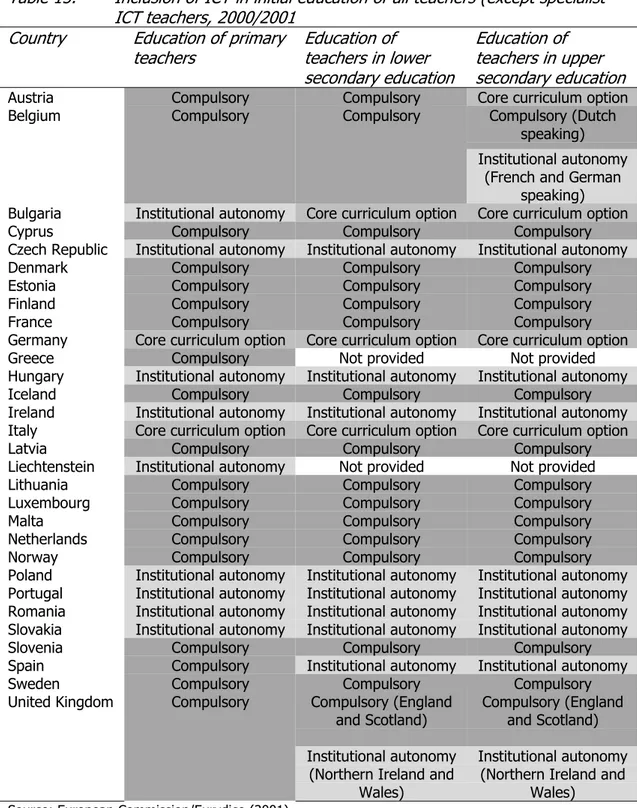
It is also of great interest not only to know what training the teachers working in schools have received, but also the extent to see to which ICT is included in the education of future teachers. Table 15 shows to what extent ICT is made a compulsory element in teacher education, a core curriculum option or if there is institutional autonomy. "Core curriculum option" refers to one of a range of subjects offered by a teacher education institution, from which the teacher students have to select a limited number in order to cover part of their compulsory minimum curriculum. "Institutional autonomy" means that teacher education institutions are free to decide whether training in ICT is compulsory or not.
Table 15. Inclusion of ICT in initial education of all teachers (except specialist ICT teachers, 2000/2001
Country Education of primary
teachers Education ofteachers in lower secondary education
Education of teachers in upper secondary education
Austria Compulsory Compulsory Core curriculum option
Compulsory (Dutch speaking)
Belgium Compulsory Compulsory
Institutional autonomy (French and German
speaking) Bulgaria Institutional autonomy Core curriculum option Core curriculum option
Cyprus Compulsory Compulsory Compulsory
Czech Republic Institutional autonomy Institutional autonomy Institutional autonomy
Denmark Compulsory Compulsory Compulsory
Estonia Compulsory Compulsory Compulsory
Finland Compulsory Compulsory Compulsory
France Compulsory Compulsory Compulsory
Germany Core curriculum option Core curriculum option Core curriculum option
Greece Compulsory Not provided Not provided
Hungary Institutional autonomy Institutional autonomy Institutional autonomy
Iceland Compulsory Compulsory Compulsory
Ireland Institutional autonomy Institutional autonomy Institutional autonomy Italy Core curriculum option Core curriculum option Core curriculum option
Latvia Compulsory Compulsory Compulsory
Liechtenstein Institutional autonomy Not provided Not provided
Lithuania Compulsory Compulsory Compulsory
Luxembourg Compulsory Compulsory Compulsory
Malta Compulsory Compulsory Compulsory
Netherlands Compulsory Compulsory Compulsory
Norway Compulsory Compulsory Compulsory
Poland Institutional autonomy Institutional autonomy Institutional autonomy Portugal Institutional autonomy Institutional autonomy Institutional autonomy Romania Institutional autonomy Institutional autonomy Institutional autonomy Slovakia Institutional autonomy Institutional autonomy Institutional autonomy
Slovenia Compulsory Compulsory Compulsory
Spain Compulsory Institutional autonomy Institutional autonomy
Sweden Compulsory Compulsory Compulsory
Compulsory (England
and Scotland) Compulsory (Englandand Scotland)
United Kingdom Compulsory
Institutional autonomy (Northern Ireland and
Wales)
Institutional autonomy (Northern Ireland and
Wales) Source: European Commission/Eurydice (2001)
It can be noted that, in most countries, ICT training is included as a compulsory subject in all types of teacher education. In the countries where the teacher education institutions have autonomy, ICT training may be included, but not always.
2.4. New technologies in the curriculum
Another area to examine is the extent to which ICT has been included as a part of the teaching offered in schools. All the EU countries and the candidate countries
have official policies which encourage the use of information and communication technologies in primary and secondary education (European Commission/Eurydice, 2001). Table 16 shows whether ICT is included in the curriculum or not and the approach to ICT in the curriculum.
Table 16. Inclusion of ICT and approaches to ICT in the curriculum
Country Primary education Secondary education
Austria Used as a tool for other subjects Included in the curriculum Belgium Used as a tool for other subjects Included in the curriculum
Bulgaria Separate subject Included in the curriculum
Cyprus Not included in the curriculum Included in the curriculum
Czech
Republic Not included in the curriculum Included in the curriculum Denmark Used as a tool for other subjects Included in the curriculum Estonia Separate subject and used as a tool for other
subjects Included in the curriculum
Finland Used as a tool for other subjects Included in the curriculum France Used as a tool for other subjects Included in the curriculum Germany Used as a tool for other subjects Included in the curriculum
Greece Not included in the curriculum Included in the curriculum
Hungary Separate subject Included in the curriculum
Iceland Separate subject and used as a tool for other
subjects Included in the curriculum
Ireland Used as a tool for other subjects Included in the curriculum
Italy Not included in the curriculum Not included in the
curriculum
Latvia Not included in the curriculum Included in the curriculum
Liechtenstein Used as a tool for other subjects Included in the curriculum Lithuania Not included in the curriculum Included in the curriculum Luxembourg Used as a tool for other subjects Included in the curriculum Malta Used as a tool for other subjects Included in the curriculum Netherlands Separate subject and used as a tool for other
subjects Included in the curriculum
Norway Used as a tool for other subjects Included in the curriculum Poland Separate subject and used as a tool for other
subjects Included in the curriculum
Portugal Used as a tool for other subjects Included in the curriculum
Romania Separate subject Included in the curriculum
Slovakia Not included in the curriculum Included in the curriculum Slovenia Separate subject and used as a tool for other
subjects Included in the curriculum
Spain Used as a tool for other subjects Included in the curriculum Sweden Used as a tool for other subjects Included in the curriculum United
Kingdom Separate subject and used as a tool for othersubjects Included in the curriculum Source: European Commission/Eurydice (2001)
For primary education the countries have been categorised in four groups; those which have not included ICT in the curriculum, those where ICT is used as tool for other subjects, those where ICT is a separate subject and those where ICT is both a separate subject and used as a tool in other subjects. Out of the 30 countries covered in the table, there are seven where ICT is not included in the curriculum for primary education.
For secondary education there were only two categories, those which had included ICT in the curriculum and those which had not. Only one country had not included ICT in its curriculum.
3.
Will the new technologies affect education?
Section 2 tried to give an overview of the present situation, but an even more important question is how information and communications technologies will affect schools and the teaching profession in the future. As was noted above, all the EU countries and the candidate countries have official policies to encourage the use of information and communication technologies in primary and secondary education (European Commission/Eurydice, 2001). In the Presidency Conclusions of the Lisbon European Council, the Council called on "the Member States to ensure that all schools in the Union have access to the Internet and multimedia resources by the end of 2001, and that all the teachers are skilled in the use of the Internet and multimedia resources by the of 2002;" (Lisbon European Council: Presidency Conclusions, Paragraph 11).
Obviously there is a strong will among most governments to increase the use of ICT in education. The interesting question is what changes can we expect to come out of this wish? During the last 100 years, we have witnessed enormous changes in society. Some of these changes have been reflected in the day-to-day life in schools, but it is probably correct to say that they have not changed the basic structure of education. During recent years, we have experienced what is often described as an increased speed of change. Will these changes be incorporated and adapted to the present structures within the education system or will they lead to changes in the whole structure, reshaping education in a way which has not been seen earlier? Some observers have predicted that the new technologies will “revolutionise” education. On the other hand, it can be noted that predictions of radical changes in education have been made earlier and the actual change has seldom been as radical as predicted.
In the report “Teaching and learning for the future” (Plomb, Brummelhuis, & Rapmund; 1996) COMMITT has tried to predict in what way computers may change the learning process in schools. They identified two approaches to learning in schools; teacher oriented and student oriented learning. COMMITT assumes that information and communication technology is an adequate medium to support the shift towards student oriented ways of learning. Few people seem to believe today that a broader introduction of new technologies will lead to the disappearance of the teacher, but that the role of the teacher will change.
3.1. Arguments for and against changes
Often, when predictions about future developments are discussed, there is a tendency to assume that these changes are unavoidable. Obviously no changes are unavoidable, there are always a window of opportunity; but in order to use that opportunity there is a need to know in which direction you would like to change things.
Basically, in the case of ICT in education, there could be arguments for and against the use of ICT. A reason for being sceptical towards the use of ICT in schools, which has been expressed by teachers, is that students need training to read, write and count in the traditional way. If schools are not providing this training the students will never learn it. The use of computers is something which the students can learn at home.
An argument for the use of ICT in education is that the use of computers is becoming a more and more integrated part of everyday life. Much of the practical application of knowledge is linked to the use of ICT. In the same way that schools have a task to provide students with knowledge about other tools which can be used to communicate and get information, there is a responsibility to help the students to learn to use the computer as a tool in a good, efficient and responsible way.
3.2. The digital divide
There is also another important dimension to this. The digital divide was mentioned above to describe the difference between the industrialised countries and the developing countries in respect of computers. A similar digital divide also exists within many countries. Even if access to computers and Internet has increased rapidly in recent years, there are still in many countries large groups of families who do not have access to computers. It is likely that this group will get smaller and smaller, but it cannot be ignored that in many societies there will always be groups without computers. Even in a society where almost everyone has computers, there will be differences between those who have access to the most modern computers and those who will still use models which are not up-to-date with the latest technical development. In the same way that all people do not have the latest models of cars, people will have different models of computers. Already today, computer literacy is a prerequisite for many jobs and those who have not had the possibility to learn to use the most up-to-date computers and the newest programmes are disfavoured. This may be even more evident in the future.
In this context schools may have an important role to play in bridging the digital gap between homes. If schools provide access to the most modern computers and the use of the most up-to-date programmes, this creates a better opportunity for children from disadvantaged homes to obtain the same skills and knowledge as those from more wealthy homes.
3.3. Education and technological change
There is often a belief that education cannot change much and that present structures will remain more or less as they are. Many other sectors of society have changed radically over the years. Over the last 100 years farming has changed from being very labour intensive to a situation where a much smaller number of people are needed to produce the same amount of food as was produced earlier. Banking has changed in the last twenty years to become much less labour intensive than it used to be and highly automatised. The question is whether education is likely to be confronted with similar changes or if the nature of education is so different from many other sectors in society that there will be no important changes.
In the past, many types of new technologies have not been fully integrated into the everyday life of schools. Both in the case of radio and television, many visions existed about how these media could change education. In most cases the impact of these media on education was rather limited. Some people would argue that the same will be the case for computers. These persons would argue that the vision of what computers can do in education is exaggerated.
Another issue is the ownership of the tools used in schools. There is no doubt that teachers have had a strong ownership of the written word, as it has appeared in books and on paper. It is also clear that teachers have, to a much lesser degree, had an ownership of other media used in schools. The question in the case of ICT is who will take the lead in developing the use of new technologies in education. Will the production of hardware and software for education be controlled by the big computer companies, the publishing houses or the teachers?
4.
Three areas for changes
When the future impact of ICT in education is discussed it may be helpful to define three areas in which change can be expected in one way or another; the delivery of education, the methodology used in teaching and the content of education. Delivery is to be understood as the whole system in which education is offered, methodology as the different methods and approaches used for teaching and content what to teach.
4.1. Delivery
ICT opens up a possibility for structuring education in a way which is not synchronous. The students and the teacher do not need to be present at the same time in the same room. Such education has traditionally been referred to as distance learning and often nowadays as “virtual schools”.
Distance learning has been used in many countries where distances have been an obstacle to providing all children and young persons with good education. Often radio and television in combination with letter correspondence have been the method for doing this. With ICT, this type of education can be radically improved and is suddenly not only an option for those far away from a school, but even an alternative to traditional schools. So far has this development has been strongest in the area of higher education, where institutions such as the British Open University and the American Phoenix University have attracted large groups of students. There are fewer examples of distance learning in secondary and primary education.
Distance learning has often been presented as an opportunity for non-traditional students to get an education. The question for the future is whether distance learning will remain as a complement to traditional face-to-face education or if it will be the basis for a development of radically new forms for teaching and learning. There have been many discussions about the growing “network society”. Will this development also include a trend towards “network schooling”? The growing interest in so called “home schooling” should be seen in this context. Home schooling is
schooling organised in the home of the child by her/his parents. Parents can of course use ICT to support each other in a network of “home schools”.
Another aspect in this context is the commercial interests in education and ICT. ICT opens up possibilities for companies to sell and market education in new ways. Such initiatives could be complementary to traditional education, but it could also be in competition with the institutions providing public education.
4.2. Methodology
Even if the impact of ICT will not radically change the whole system of delivery of education, there is scope for changes in the methodology used by teachers in schools. The COMMITT study (Plomb, Brummelhuis, & Rapmund; 1996) identified three stages that teachers pass through on their way to becoming experienced technology users. In the first step, the teachers used computers to support traditional methods of teaching, such as drill-and-practice, text orientation and whole group lectures. It is obvious that word processing programmes can help the teacher to produce texts in a much more professional way than earlier. It is also obvious that PowerPoint presentations can be a way of making traditional lectures more interesting.
The next step should be to use technology as part of more innovative instruction, including, team teaching, interdisciplinary project based instruction, and individually paced instruction. Examples of this can be found in some schools. The results from the SITES study (Pelgrum & Anderson, 2001) seem to indicate that the factor of greatest importance in stimulating such a development is to lower the student : computer ratio.
The third step is characterised by the teachers entering into an inventive stage in which they experiment and change, using technology to support active, creative and collaborative learning. Obviously, this may be what is happening today in classrooms well equipped with Internet linked computers and with teachers with good computer knowledge. The full potential of ICT may not have been fully realised yet and there is a lot of new-thinking which needs to be done to capitalise these opportunities.
It is also possible that the results of new methodological approaches to teaching may result in the development of different types of "blended models" where teaching in school is combined with longer or shorter periods of distance learning.
It should be kept in mind in this context that ICT may not only change what is happening in the classroom, but also what is happening in the school as a whole and the contacts between teachers, parents and students. In schools with classes with their own homepages, parents do not need to figure out their children's homework, they will just click into the homepage of the class and get all the relevant information they need.
4.3. Content
In this context it is relevant to distinguish between ICT as an object, as an aspect and as a medium. ICT as object means teaching and learning about technical functions of ICT. ICT as aspect refers to ICT as an integrated component in another subject. ICT as medium refers to ICT used as a tool or an aid in teaching and learning (Plomp & van den Akker, 1995).
ICT is not only a tool which can be used by schools, it is also a tool which students will have to use their whole life, in their professional lives and in their private lives. This raises the question of what do you young people need to learn in order to be able to work and live in the "information society". An obvious answer is that they need to learn how to improve their learning. In the same way that this answer is obvious it is also clear that the knowledge about how you “learn to learn” has to be improved. An element in this is probably the ability to seek, find, select and use information. When the amount of information is increasing, the skill is not to find just any information, but to find the right information. In order to do that, the ability to establish an overview of large amounts of information and to evaluate information critically becomes crucial. The important question is what type of skills and knowledge young people need to obtain in schools in order to do this.
The things mentioned above are mainly intellectual skills, but to which extent other skills are needed could also be discussed. In spite of many discussions about the future of reading, it can be noticed that a large part of the activities a person is involved in when sitting in front of a computer screen is actually reading. Good reading skills seem to be crucial skills also for the future, but will the reading habits be the same? Is reading in front of a computer screen different from the reading of a text on a paper? Earlier, schools spent much time on teaching the pupils how to write well. Today, with the use of computers it seems to be of equal importance to be able to write well and fast on a keyboard. Perhaps keyboard training is as essential as the training to use a pen?
5.
Questions for the future
The development of ICT raises several important questions:
• What will the future schools be like and what would we like them to be?
• What will be the role of the teacher and what role would we like teachers to have in future?
• How will the development of ICT in education affect the role of commercial interests in education?
• How can the digital divide be overcome, both at an international level and at a national level?
These questions, in combination with the discussion above about changes in the delivery of education, methodology and content, may be of crucial importance for the future of the education systems and the teachers. From that perspective, is it necessary for teacher unions to try to look into the future. Teacher unions need to find answers to a number of strategically important questions.
6.
Summary
Computers and ICT have become features of daily life in society, at work places and in the homes in most industrialised countries.
Computers and ICT are increasingly used in schools, but large number of schools still have no access or limited access to new technologies. A growing number of teachers frequently use computers and ICT in their classrooms, but in some countries there are also large groups of teachers who do not use computers at all. An increasing number of teachers have received some training in the use of computers and ICT, but still about half of the teachers in the EU countries have so far received no training. Training in the use of computers and ICT seems to be included in the pre-service education of teachers in most countries.
Governments have expressed a strong wish to increase the use of ICT in schools. It seems reasonably to assume that the changes we have seen in schools in respect of new technologies are only the beginning of what may be radical changes. Changes can take place in the general way in which education is delivered, in the practice in the classrooms and in the content of education.
The crucial question for the future is what changes can we expect to see and what changes we wish to see. In this context it is important for teacher unions to think strategically about these questions.
7.
References
- Beaton, A. E., Mulis, I. V.S., Martin, M. O., Gonzales E. J., Kelly, D. L., Smith, T.A (1996) Mathematics Achievement in the Middle School Years. The IEA’s Third International Mathematics and Science Study. Boston: TIMSS International Study Center, Boston College Chestnut Hill.
- Beaton, A. E., Martin, M. O., Mulis, I. V.S., Gonzales E. J., Smith, T.A, Kelly, D. L (1996): Science Achievement in the Middle School Years. The IEA’s Third International Mathematics and Science Study. Boston: TIMSS International Study Center, Boston College Chestnut Hill.
- Plomb, Tj., ten Brummelhuis, A., & Rapmund, R. (Eds.) (1996) Teaching and learning for the future. Enschede: Secretariat COMMITT, University of Twente
- European Commission/Eurydice (2001) Basic Indicators on the Incorporation of ICT into European Education Systems. Facts and figures. 2000/2001 Annual Report. Brussels: European Commission/Eurydice.
- Euroustat (2002) website: http://europa.eu.int/comm/eurostat/ 020905
- Harasim, L., Hiltz, S.R., Teles, L., & Turoff, M. (1995) Learning networks: a field guide to teaching and learning online. MIT Press
- Lisbon European Council: (2000) Presidency Conclusions (www.document) http://ue.eu.int/en/Info/eurocouncil/index.htm.
- OECD (2001) Education at a glance. OECD indicators 2001. Paris: OECD - OECD (2002) Education at a glance. OECD indicators 2002. Paris: OECD
- Pelgrum, W.J, & Anderson, R. E. (2001) ICT and the Emerging Paradigm for Lifelong Learning. An IEA Educational Assessment of Infrastructure, Goals, and Practices in Twenty-six Countries. Second Edition. Amsterdam: IEA (The International Association for the Evaluation of Educational Achievements), University of Twente
- Pelgrum, W.J., Jansen Reinen, I.A.M., & Plomb, Tj. (Eds.) (1993) Schools, Teachers, Students and Computers: a Cross-National Perspective. Amsterdam: IEA (The International Association for the Evaluation of Educational Achievements)
- Plomp, Tj. & van den Akker, J. (1995) In-service Training and Information Technology from a Curriculum Innovation Perspective. In Collis, B., Nikolova, I., & Martcheva, K. (Eds.) Information technologies in teacher education: Issues and experiences for countries in transition. Paris: Unesco Publishing
Acronyms
COMMITT Committee on MultiMedia In Teacher Training
ICT Information and Communication Technology
IEA International Association for the Evaluation of Educational Achievement
PISA Programme for International Student Assessment
SITES Second Information Technology in Education Study
TIMSS The Trends in International Mathematics and Science Study, formerly known as the Third International Mathematics and Science Study 5 bd du Roi Albert II B-1210 Brussels, Belgium Tel: +32 2 224 0611 Fax: +32 2 224 0606 headoffice@ei-ie.org www.ei-ie.org