Design of Channel Measurement Guidelines for
Characterization of Wireless Industrial Environments
Svetlana Girs
†, Marcus Bergblomma
†, Elisabeth Uhlemann
†,‡, Barbara Štimac
†,£, and Mats Björkman
† †Mälardalen University, Västerås, Sweden‡Halmstad University, Halmstad, Sweden £University of Zagreb, Zagreb, Croatia
svetlana.girs@mdh.se, marcus.bergblomma@mdh.se, elisabeth.uhlemann@ieee.org, barbara.stimac2@gmail.com, and mats.bjorkman@mdh.se
Abstract— Providing reliable and timely communication in
wireless industrial systems requires careful design of error control schemes able to tackle the bit error patterns typically occurring in these environments. As most error control schemes target some specific characteristics of a wireless channel, the selection of channel model is crucial for proper performance assessment. There are a number of widely used channel models, but the question of the most appropriate choice of model for industrial environments still remains largely open. Not many indoor measurement campaigns have focused on industrial environments with their own specific characteristics. In this paper we present a set of measurement guidelines aiming to characterize industrial environments such that suitable channel models can be selected to properly evaluate error control schemes targeting reliable and timely wireless communications in industrial environments.
I. INTRODUCTION
In wireless industrial networks, providing reliable and timely communication is crucial. Wireless channels, affected by interference, pathloss, shadowing and fading, imply a significant challenge to fulfill the requirements on real-time and reliability. Most current research is therefore focused on error control schemes that can tackle bit errors resulting from effects of these phenomena. The problem is that the majority of these schemes are developed targeting a particular type of wireless channel phenomena and thus, knowledge of the channel characteristics is crucial for network design and development of new error control algorithms. Different mathematical models are traditionally used to describe these wireless phenomena. The question is how to choose an appropriate model for wireless industrial environments. Although measurements for indoor wireless channels have been presented in various publications, these typically focus on office environments, e.g. [1], [2] or consider frequency bands different to 2.4 GHz, e.g. [3]. Quite contrary to office environments, industrial settings are typically characterized by the presence of highly reflective items and disturbances from electromagnetic machinery. In addition, most of the chipsets used for industrial wireless networks work in the ISM frequency band of 2.4 GHz.
We argue that further measurement campaigns are needed to model wireless industrial environments. Especially when considering recent proposals to use error control schemes
based on relaying and space diversity to increase reliability in wireless industrial networks. In this paper we therefore propose a set of measurement guidelines aiming to characterize and evaluate wireless industrial environments such that we are able to find good channel models that can be used in the design of suitable error control schemes to enable timely communications with high reliability. Special focus is given to factors that affect design and performance of relaying schemes.
II. MODELING WIRELESS INDUSTRIAL CHANNEL
Although it was shown in [4] that the effects of industrial disturbances such as transport mopeds, 4-wheel motorcycles and repair work where welding or similar processes are carried out, do not reach the 2.4 GHz frequency band, several other factors such as thermal noise, pathloss, multipath interference and shadowing, affect the received signal. Thermal noise, caused by electron movement, is present in all electronic devices and can be modeled as additive white Gaussian noise (AWGN). Pathloss is attenuation in signal strength that depends on the environment and the distance between the source and the destination. Further, in most wireless channels, different objects, like walls, are located close to, or even in-between the source and the destination, causing the transmitted waveforms to be subject to reflections, scattering and diffraction, and as a result, multiple copies of the same packet reach the receiver. Since the different copies have travelled through different paths, they may arrive at the destination with different attenuation, phase and delay. Interference between these copies can therefore be constructive or destructive and the signal is said to experience fading. Multipath fading is sometimes referred to as small-scale fading. In case of destructive interference, the channel is often said to be in a deep fade. Such deep fades also occur due to shadowing, i.e. when something blocks the direct line-of-sight (LOS) path between the source and the destination. Shadowing is also known as large-scale fading. Thus, to model a wireless industrial channel, at least the distance-dependent pathloss as well as the large- and small-scale fading should be factored out. For a given frequency, the received power at a certain distance, d, can then be modeled as
( )
0 10 0 10 log , r d P d P X Y d σ γ = − + + (1)where P0 is the power at the reference distance d0, γ is the
fading contributions respectively [5]. The value of the pathloss exponent, γ, indicates how fast the signal power reduces with distance and depends on the propagation environment, e.g., it is usually within the range of 2-4 for indoor environments and typically more than 4 outdoors. Many authors have estimated the pathloss exponent in diverse environments, e.g. in [6] it was found that in different electric power environments, the pathloss exponent varies from 1.45 to 2.42 for LOS measurements and from 2.38 to 3.51 for measurements without a LOS component. Similar distributions of estimated values were found in [7] for industrial environments and different frequency bends, while in [8] an exact number of 3.086 was obtained as a reference value for propagation pulses inside buildings. Large-scale fading is usually assumed (and experimentally found in, e.g. [7]) to follow a log-normal distribution. For small-scale fading Rayleigh, Rician [8, 9] and Nakagami [10] fading models typically fit the best. The Rayleigh distribution represents the case where there is no direct LOS path available and thus all communication takes place using multiple non-LOS paths. With Rician fading, the signal travels through a LOS path, of varying strength, as well as multiple non-LOS paths.
Since in industrial environments there are often many moving objects, e.g. if a production line is present in the area of interest, things can move in and out of the LOS between the transmitter and the receiver, and thus, the channel parameters can change suddenly and remain stable for a short or long period of time. Temporal properties of industrial propagation channels were investigated in [7] and [11]. In [7] temporal fading, measured during 5 min intervals in different types of industrial environments, was found to correspond to a Rician distribution. Also, the 24 h long measurements from [11] with 5 min averages showed minimal variations of the channel.
III. MEASUREMENT SETUP
As can be concluded from surveying related work, many measurement campaigns were conducted by several different research groups, but much work still remains, especially when considering using diversity to increase reliability in wireless industrial networks. The main goal of the current measurement campaign is to estimate and assess the parameters in the expression in (1) to obtain a good model, approximating industrial environments, that is suitable for design of effective error control schemes. The unknown parameters in the formula include: the pathloss exponent, γ, and the parameters
Xσ and Y representing the large- and small-scale fading
contributions respectively. In addition, we want to know how fast the considered wireless channels change their characteristics. In particular, we would like to determine if the characteristics change during the time needed to send one packet, such that different parts of a transmitted packet are affected differently, or if the channel is stable during the transmission of one packet or even for a longer time, possibly a retransmission of the same packet. Moreover, it is interesting to know what factors affects the communication quality the most: how strong is the dependence on the distance between source and destination; if the presence of even a weak LOS path is crucial; if the channels are symmetric; and if they change their characteristics on different frequencies typically
used in the frequency hopping scheme of IEEE 802.15.4. In addition, as there are several competing communication standards for industrial applications in the 2.4 GHz band, we would like to determine which wireless standards lead to lower packet error rates and if we can tweak their parameters given knowledge of the wireless channel characteristics.
We therefore propose to measure the power delay profile (PDP) using a network analyzer, time domain variations using a signal generator and a spectrum analyzer and finally to estimate packet error rates (PER) using both software defined radio (SDR) and real chipsets. However, coexistence (e.g. [12]) and cross-channel interference issues (e.g. [13]) are out of the scope of this paper. Although these issues are of the essence for indoor office communications, they are less crucial for industrial environments, as usually all the present networks are under strict control and there are no foreign networks close by.
A. Power Delay Profile Measurements
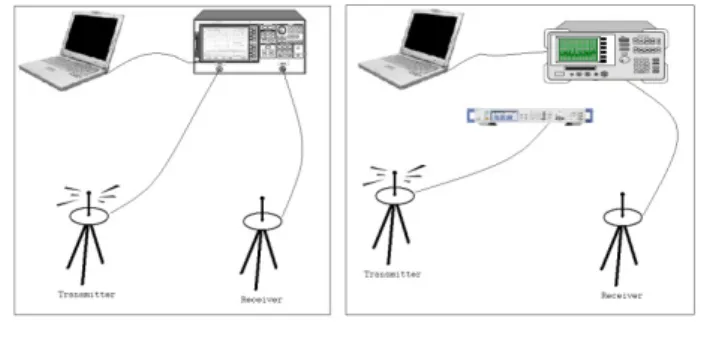
To achieve the first goal of determining the parameters of equation (1), measurements targeting PDP were chosen. The PDP gives the intensity of a signal received through a multipath channel as a function of time delay. For each pair of source and destination node locations, the source sends a pulse, and the impulse response is recorded on the receiving side. However, instead of finding the profile of a single pulse in the time domain, wideband coherent frequency response measurements can be performed. The collected sampled frequency responses are later converted to the time domain using the inverse Fourier transform. The measurements guidelines thus include using e.g., a Rhode & Schwarz (R&S) vector network analyzer ZVB 8 connected to two omnidirectional antennas placed on the top of 1.4 m height tripods (Fig. 1). The collected data is sent to a computer containing a LabVIEW program. The measured frequency range is 2350 to 2850 MHz which implies a delay resolution of 2 ns. The spectrum is divided into 2001 frequency points, i.e. 250 kHz between the frequency samples and thus, corresponding to a maximum measurable time domain delay window of 4 µs.
Fig. 1. Measurement setup for PDP (left) and time domain measurements (right)
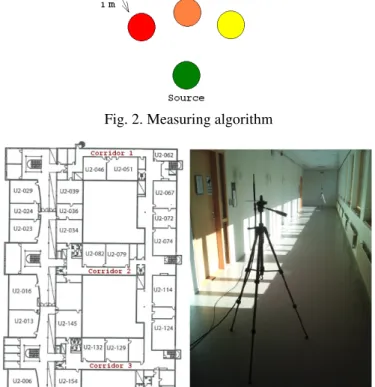
To see the effect of the presence of a LOS path, the measured environment is first divided into three types of areas: an area with clear LOS, one with a partly blocked LOS and finally one with no LOS. For each area type, the measurements should be repeated at least three times, i.e. the measurements are to be conducted in three different locations
belonging to an area of the same type (Fig. 2). The measurements can either be done at specific interesting locations or along a straight line. When measuring along a straight line, the measurements should consider different specific antenna separations, e.g. the receiving antenna should be moved with 1 m increments (which corresponds to 10λ given the selection of the 2.4 GHz band). Also, a few frequency response estimates (which later can be used for finding the best-fit small-scale fading distribution) should be collected, i.e. by measurements with 3 cm spatial antenna displacements, which correspond to λ/4 at 2.4 GHz, for each antenna position. At each measurement point, at least 100 profiles should be collected.
Fig. 2. Measuring algorithm
Fig. 3. Test environment
Initial results: To access the quality of our guidelines, a
first set of measurements of the PDP was performed in an office environment1 in three similar style corridors in the
1 Note that the initial measurements were conducted in the university office
environment for reasons of simplicity only, i.e., before asking permission to enter a real, operational factory, belonging to an industrial collaboration partner, the measurement setup needs to be thoroughly tested. A measurement date is to be scheduled in the near future.
second floor of U-building of Mälardalen University in Västerås, Sweden (Fig. 3). The corridors are 2.56 m wide and 2.7 m high; the lengths are 26.84, 24.16, and 37.84 m for corridors 1, 2 and 3 respectively. All the corridors have windows and doors, which were all closed during the experiments. Measurements were conducted during working hours, but no people or moving objects were present during any of the transmissions. In each corridor, the position of the source was fixed, close to one end, and 19 PDPs with 3 cm displacements were collected for each antenna separation.
Fig. 4 shows the PDP for 10 discrete receiver locations measured in the first corridor, each location with 10 m distance between the antennas. Each PDP picture shown in Fig. 4 represents the results averaged over 100 different measurements performed at each antenna location. The first high peak in each PDP corresponds to the signal coming from the direct LOS path. Secondary strong peaks can be explained by the presence of multiple paths, caused by reflections from the floor, the ceiling and the walls. It can be seen from the figure that all the collected PDPs have the same shape and do not significantly change with respect to a quarter of a wavelength. These results can be explained by the fact that the measurements took place in a corridor with a clear LOS path. In real industrial environments the PDP received when moving the antenna λ/4 increments is expected to look different due to more possible paths being available.
Fig. 4. Example of measured profiles at 10 discrete receiver locations (corr. 1; 10 m)
B. Time Measurements
To determine how stable the wireless channels are over time, a set of measurements using a signal generator and a spectrum analyzer is proposed. In the setup shown in Fig. 1 (right), a continuous signal with 2480 MHz frequency is transmitted from the R&S signal generator SMA100A to the R&S FSP spectrum analyzer and from the spectrum analyzer, the data is transferred to the computer. Measurements are divided into long- and short-term, in terms of the time needed to transmit one industrial packet.
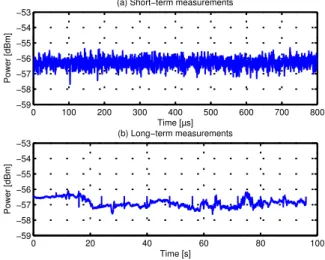
Initial results: Fig. 5(a) shows the result from short-term
measurements, i.e., over 800 µs, which is the time needed to transmit a small IEEE 802.15.4 packet, with 8001 sweep
points for the first corridor. As can be seen from the figure, the investigated wireless channel is stable during the measured time and thus, the assumption that the channel stays constant during the transmission of one packet (block fading) can be used for the considered office environment. The results from the long-term measurements, Fig. 5(b), show that the channel is stable also during this longer measure time and thus, the assumption that a wireless channel stays constant during the whole superframe, or at least during the time needed for one direct transmission followed by several retransmissions is reasonable. 0 100 200 300 400 500 600 700 800 −59 −58 −57 −56 −55 −54 −53
(a) Short−term measurements
Time [µs] Power [dBm] 0 20 40 60 80 100 −59 −58 −57 −56 −55 −54 −53 (b) Long−term measurements Time [s] Power [dBm]
Fig. 5. Time domain measurements: (a) short-term, corr. 1; (b) long-term, corr. 2
C. SDR and POMPOM measurements
The last set of measurements is to be conducted using both real devices from different standards as well as SDR. SDR is a radio system where most of the functionalities of a wireless chipset are implemented by means of software. The fact that the required hardware resources are minimised and that most of the important functions, e.g. transmit power, bandwidth, coding, cryptography, and modulation, are controlled via programmable processors, makes SDRs more adaptive by allowing easy, quick and cost-effective changes of most involved parameters. In the measurements guidelines described in this paper, two Universal Software Radio Peripherals (USRP) from Ettus research N210 SDRs, equipped with an FPGA and based on 32-bit RISC microprocessor, will be used. They are connected to a computer via Gigabit Ethernet interface, allowing up to 50 MHz of simultaneous transmissions in and out of the radio. Each of the USRPs uses a RFX2400 transceiver daughterboard, capable of transmitting in the 2.3 – 2.9 GHz frequency band, therefore being suitable for measurements in the 2.4 GHz ISM band. The system allows changing transfer rate, packet length, filtering, coding, and modulation techniques. Using different combinations of the parameters, it is possible to imitate several different standards based on IEEE 802.15.4, and to compare their performance in various communication environments.
SRD measurements allow us to get the received signal strength indicator (RSSI) as a function of time (with fixed frequency and location). The RSSI values can be collected per bit or per packet. From the measured RSSI values, the bit and packet error rates (BER and PER) as functions of time can be estimated. The same measurements can be conducted for all standards interesting for industrial application. In addition, the measurements conducted with SDR will be compared to measurements conducted with real devices, using the POMPOM unit, a programmable testbed with interchangeable radio modules, developed in [14]. The platform is able to perform long-term measurements as well as capturing high resolution periodic measurements. In the proposed measurement guidelines, the POMPOM testbed will primarily be used to compare the performance of IEEE 802.15.4 based standards such as ZigBee and WirelessHART, as well as different versions of Bluetooth for various investigated wireless industrial environments.
IV. DISCUSSIONS AND EXPECTED RESULTS
The main goal of the proposed measurement campaign is to establish suitable values for the parameters in equation (1), which is needed to obtain models for the effective design of error control schemes. We also aim to determine how stable the channels are over time and frequency, together with which factors that affect the communication most.
Measuring the power delay profile not only lets us estimate the fading and pathloss characteristics of the channel, i.e., assessing equation (1), but also shows the dependency of the received impulse response with respect to the type of wireless environment encountered as well as the transmitter/receiver positions [8], [15]. Moreover, from the measured impulse responses, root-mean-square delay spread and coherence bandwidth can be estimated. Multiple power delay profiles measured for the same antenna positions can be compared to see how the channel changes over time. Conclusions can be drawn visually, by looking at the shape of the received profiles (e.g. the figures from the office corridors showed that the channels are stable during the time interval of our PDP measurements) and used to estimate the time-domain fading. These results can then be compared to the time domain measurements, which will give the continuous picture of the channel. Analyzing the results from measurements performed with SDR and POMPOM, packet and bit error rates as functions of distance also can be estimated. Thus, the pathloss, as estimated using PDP, POMPOM and SDR measurements respectively can be compared. Moreover, measuring RSSI at the same positions where PDP measurements are made will allow us to compare the results for different groups of measuring techniques. PDP measurements can be performed regardless of wireless standard, as only the frequency band is given. In contrast, with POMPOM and SRD measurements, parameters such as modulation type, data rate and packet size are also influential. Thus, drawing conclusions from these two groups of measuring techniques, we are able to make an even more general characterization of the studied environments.
V. CONCLUSIONS
We have highlighted the necessity of more targeted channel measurement campaigns in real industrial settings and we propose a set of measurement guidelines suitable to evaluate specific factors in the wireless environment that affect the design of e.g., industrial relay networks. Test results from initial measurements in a university building are shown to illustrate the benefits of the chosen guidelines and techniques. The proposed setup includes measurements that are independent of the specific wireless communication standard, i.e. using spectrum and network analyzers, as well as measurements using real or software imitations of IEEE 802.15.4 based devices. A thorough comparison of the results received by the different measurement techniques will lead to a clearer general picture of the characterized wireless environments. In the near future, measurements are planned to take place on the territory of real industrial settings, e.g. an ABB factory building and Mälarenergi’s power production plant in Västerås, Sweden.
REFERENCES
[1] G. J. M. Janssen, P. A. Stigter, and R. Prasad, “Wideband Indoor Channel Measurements and BER Analysis of Frequency Selective Multipath Channels at 2.4, 4.75, and 11.5 GHz,” IEEE Trans. on Communic., vol. 44, no. 10, pp. 1272-1288, 1996.
[2] S. Wyne, A. P. Singh, F. Tufvesson et al., “A Statistical Model for Indoor Office Wireless Sensor Channels,”
IEEE Trans. on Wireless Communic., vol. 8, no. 8, pp.
4154-4164, 2009.
[3] R. Ganesh, and K. Pahlavan, “On the modeling of fading multipath indoor radio channels,” Proc. IEEE Globecom, Dallas, TX, Nov. 1989, pp. 1346-1349.
[4] C. Ängskog, K. Karlsson, C. F. Coll et al., “Sources of disturbances on wireless communication in industrial and factory environments,” Proc. Asia-Pacific Symp. on
Electromag. Compatib., Bejing, China, April 2010, pp.
281-284.
[5] C. F. Mecklenbräuker, A. F. Molish, J. Karedar et al., “Vehicular Channel Characterization and its Implications for Wireless Systems Design and Perfomance,” Proc. of
The IEEE vol. 99, no. 7, pp. 1189-1212, 2011.
[6] V. C. Gungor, B. Lu, and G. P. Hancke, “Opportunities and Challenges of Wireless Sensor Networks in Smart Grid,” IEEE Trans. Ind. Electr., vol. 57, no. 10, pp. 3557-3564, 2010.
[7] E. Tanghe, W. Joseph, L. Verloock et al., “The Industrial Indoor Channel: Large-Scale and Temporal Fading at 900, 2400, and 5200 MHz,” IEEE Trans. on Wireless
Communic., vol. 7, no. 7, pp. 2740-2751, 2008.
[8] S.-C. Kim, H. L. Bertoni, and M. Stern, “Pulse Propagation Characteristics at 2.4 GHz Inside Buildings,” IEEE Trans. Vehicular Tech., vol. 45, no. 3, pp. 579-592, 1996.
[9] F. Darbari, I. A. Glover, and R. W. Stewart, “Channel and interference analysis for wireless sensor networks,”
Proc. IEEE Int. Conf. on Communic., Glasgow, UK, June
2007, pp. 3289-3294.
[10] D. Sexton, M. Mahony, Lapinski, M., and J. Werb, “Radio channel quality in industrial wireless sensor networks,” Proc. Sensors for Ind. Conf., Houston, TX, Feb. 2005, pp. 88–94.
[11] L. Tang, K. Wang, Y. Huang et al., “Channel Characterization and Link Quality Assessment of IEEE 802.15.4-Compliant Radio for Factory Environments,”
IEEE Trans. on Ind. Inf., vol. 3, no. 2, pp. 99-110, 2007.
[12] A. Sikora, and V. F. Groza, “Coexistence of IEEE802.15.4 with other systems in the 2.4 GHz-ISM-band,” Proc. IMTC 2005 - Instrum. and Meas. Techn.
Conf., Ottawa, Canada, 2005, pp. 1786-1791.
[13] L. Lo Bello, and E. Toscano, “Coexistence Issues of Multiple Co-Located IEEE 802.15.4/ZigBee Networks Running on Adjacent Radio Channels in Industrial Environments,” IEEE Trans. on Ind. Inf., vol. 5, no. 2, pp. 157-167, 2009.
[14] M. Ekström, “Towards Predictable and Reliable Wireless Communication in Harsh Environments,” PhD Thesis, School of Innovation, Design, and Engineering, Mälardalen University, Västerås, Sweden, 2013.
[15] J. F. Coll, “RF Channel Characterization in Industrial, Hospital and Home Environments,” Communication Systems, KTH, Stockholm, Sweden, 2012.