EXPOSURE WORK COMMUTING: CASE STUDY AMONG
COMMUTING ACCIDENT IN KLANG VALLEY, MALAYSIA
Nurulhuda JAMALUDDIN, HO Jen Sim, Akmalia SHABADIN,
Nusayba MJ and Wahida AB
Road Safety Engineering and Environment Research Centre,
Malaysian Institute of Road Safety Research,43000 Kajang, Selangor, Malaysia Fax: +603-87342160
Email: nurulhuda@miros.gov.my
ABSTRACT
Background Traffic accidents caused the most accidental deaths at work in Malaysia. Commuting accident increased by 9.29% in 2009 compare to 2008. The Social Security Organisation (SOCSO) reported that the number of deaths due to commuting accident was 760, which is nearly two times more than deaths caused by accidents that happened at the workplace (471 deaths).
Objectives The aim of this study are to analyse the socio-demographics and socio-economics background of the victim, and to analyse the exposure of drivers involved in traffic accidents during their commute to and from the workplace.
Methods The study was based on compensation claims to SOCSO where data were extracted from the ‘Form 21’ provided by SOCSO. Accident victims in Klang Valley were required to fill up the form for their insurance claim. Sample size for this research was 377 based on 2009 and 2010 claims. Respondents were selected through systematic random sampling method from a list of SOCSO claimants.
Results In the total sample, the majority of traffic accidents (83%) involved males. The majority of respondents (92.2%) also rode on motorcycles. The male drivers have an average driving experience of about 10.7 years and for females about 8.6 years. The estimation of the travelled distance for the sample from home to the workplace is 0.65 to 131 km. Mean accident occurrence time was 23 minutes whilst mean distance was 11.6 km.
Contribution to the field Authorities and Social Security Organization (SOCSO) should be concerned about problems of traffic accidents and the safety of the workers. A study of the cause of road traffic accidents is important so that the appropriate intervention strategies can be implemented at the root cause level.
1 INTRODUCTION
Traffic accident injury has become a major issue in public health problem. World Health Organization 2004 reported in low-income and middle income countries, about 85% of deaths and 90% of the annual disability- adjusted life years (DALYs) lost because of road traffic injury. In 2009, WHO reported 139,156 deaths in Western Pacific Region and Malaysia have contributed more than 6,000 deaths.
The study of all work related fatalities was established in worldwide. In Australia, the study of all work-related deaths that occurred between 1989 and recent year more comprehensive data on the road deaths related to work were collected (Mitchell, 2004).
In United Kingdom, the annual losses due to worker killed or injured on road is Pound Sterling 3.5 billion. Clarke (2005) reported the drivers who drive on business purpose are at average risk of accident involvement relative to the general driving population. Chapman (2000) found that the business mileage criteria show important differences in self-reported driving behaviours, accident frequency and in the types of accident reported.
Mileage is one of indicator of exposure. It is considered as a relevant exposure measure. Exposure data are used to evaluate the road safety intervention and to determine the road safety level in the entire country. Exposure also has been used to explain that certain group of users are exposed to a higher risk of accidents.
Thus, the present study sought to analyse the socio-demographics and socio-economics background of the victim, and to analyse the exposure of drivers involved in traffic accidents during their commute to and from the workplace.
1.1 Commuting accident in Malaysia
Social Security Organisation (SOCSO) was established as a Government Department to enforce the Employee Social Security Act 1969. SOCSO administers the Employment Injury Insurance Scheme which is protection for employees against industrial accident including occupational diseases and accidents while travelling for work related purpose.
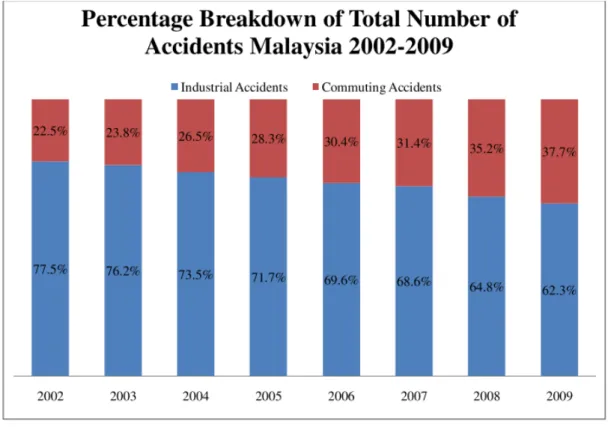
Figure 1: Percentage of total number of accident 2002- 2009
(Source: Report of Industrial and Commuting Accident 2009)
SOCSO in 2009 reported that 20,810 of its contributors had been involved in accidents whilst commuting to work. The commuting accidents which occurred during 6: 01 to 8:00 am and 6:01 to 8:00 pm refer to all the accidents occurring while travelling from/to place of work, during authorized rest time or any period related work. Figure 1 show the percentage of commuting accident from 2002 to 2009 increases as opposed to the industrial accidents. From the data, it was reported that the commuting accidents increased by 9.29% compared to 2008. In terms of number of deaths, the commuting accidents increased by 760, nearly two times of deaths due to industrial accidents (471 deaths). The results also noted that 60% of total deaths reported by the SOCSO were motorcyclists.
2 METHODS
2.1 Data from the SOCSO
This study is based on data from the SOCSO claimants of 2009 and 2010 in Klang Valley. 470 respondents who survived traffic accident were selected through systematic random sampling method form list of SOCSO claimant. There were 93 traffic accidents whist the person was at work and 377 traffic accidents occurring as the person was on the way to or from work. In this article, only commuting accident were examined.
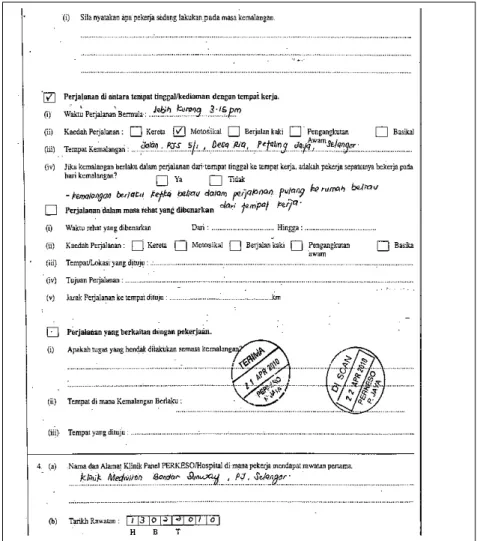
The source of data was primarily based from the accident claimer of Form 21(accident report) used by SOCSO for all accident claimers throughout the country. Obtained from the total of 35 variables available in Form 21, were information of employer, information of the
respondent and the information of the accident history. Due to ethical consideration, all information would remain confidential. Figure 2 shows the example of Form 21, available in Bahasa Melayu, the national language in Malaysia.
Variables such as age, gender, contact number, race, occupation, driving experience, travel purpose, date of accident, time start journey, time of accident, mode of transport, origin address, destination address and accident location can be determined from Form 21.
The data were extracted and transferred to the SPSS for analysis purpose. A brief analysis of the exposures such as crash/ 100,000 kilometres travelled, risk by demographic characteristics and other descriptive analysis can also be derived from the data.
2.2 Data Analysis
The estimation length of the kilometre travelled, determined by the origin address, accident location and destination address collected from From 21, is obtained by the use of Google Map application. Through this, the kilometre travel for each of respondent can be estimated. Similarly, the period of the journey to where the accident occurs is obtained by subtracting the time of accident from the time of departure.
3 RESULTS
3.1 Description of the samples.
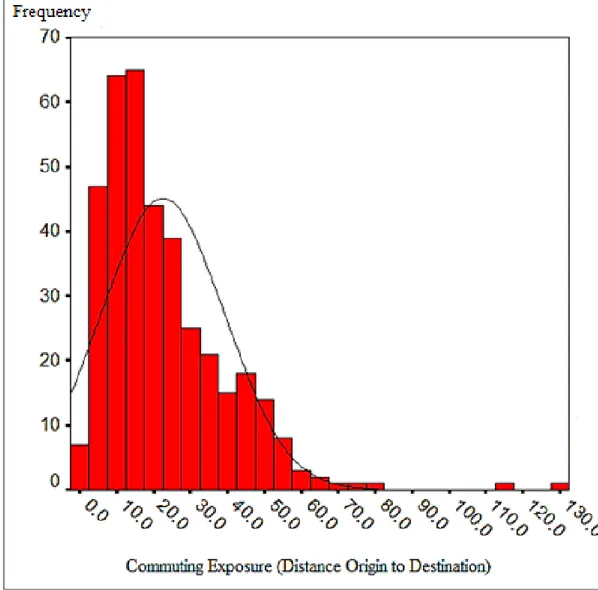
The majority of the samples were males (83%). The age of samples ranged from 19 years old to 77 years old. Samples reported a mean of 10.5 years of driving experience where males had significantly more time as a licensed driver (mean of 10.7 years) than females (mean of 8.6 years). Most of the sample travel 10 to 20 km from origin to destination. Figure 2 show the frequency of the sample by the commuting exposure.
Motorcycle was the main type of vehicles involved in accident (92.2%) followed by motorcar (5%) and other (public transport and walking 2.7%). Most of the samples work in manufacturing sector (35.5%), trading sector (12.5%) and civil services (11.7%).
3.2 Mean actual distance travelled
Sample refers to the victim in a traffic accident. The estimated travelled distance for the sample from home to the workplace is 0.65 to 131 km. Mean accident occurrence time was 23 minutes whilst mean distance was 11.6 km.
Several studies (Salminen, 2000; Gera and Kuhn, 1981) have noted that there are relationships between travel distance, occupation and traffic accident during commuting. Evidences have shown that blue – collar group tend to use motorcycle to travel to work, often becoming the victim of traffic accidents. In acknowledging the increasing pressure due to increasing cost of living standard, there is also a growing trend of white – collar groups switching to motorcycle as a mode of transport.
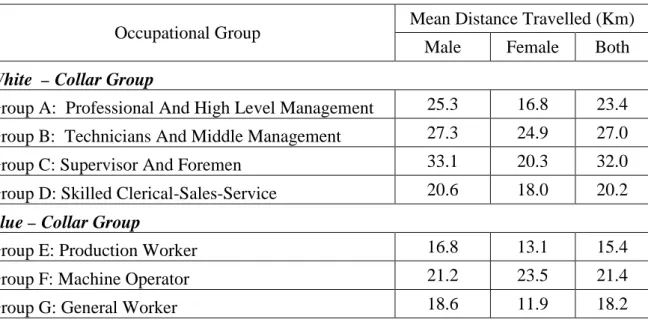
In this study, the respondents were classified into seven (7) groups (A to G) according to their occupation, under two main categories. The mean of actual distance travelled to work trips are given discretely by gender and occupation group in Table 1. In general, it was found that white collar group travelled farther as compared the blue-collar status group. Among the male respondents, the longest distance travelled distance travelled is by Group C, followed by Group A and Group B, while relatively short distance were travelled by the four lowest status group (D,E,F and G). As for their female counterpart, professional group made an average of 16.8 km to their workplace.
Table 1: Mean Distance Travelled at the home to work by occupational group and gender
Occupational Group Mean Distance Travelled (Km) Male Female Both White – Collar Group
Group A: Professional And High Level Management 25.3 16.8 23.4 Group B: Technicians And Middle Management 27.3 24.9 27.0
Group C: Supervisor And Foremen 33.1 20.3 32.0
Group D: Skilled Clerical-Sales-Service 20.6 18.0 20.2 Blue – Collar Group
Group E: Production Worker 16.8 13.1 15.4
Group F: Machine Operator 21.2 23.5 21.4
Group G: General Worker 18.6 11.9 18.2
3.3 Crash rate estimates
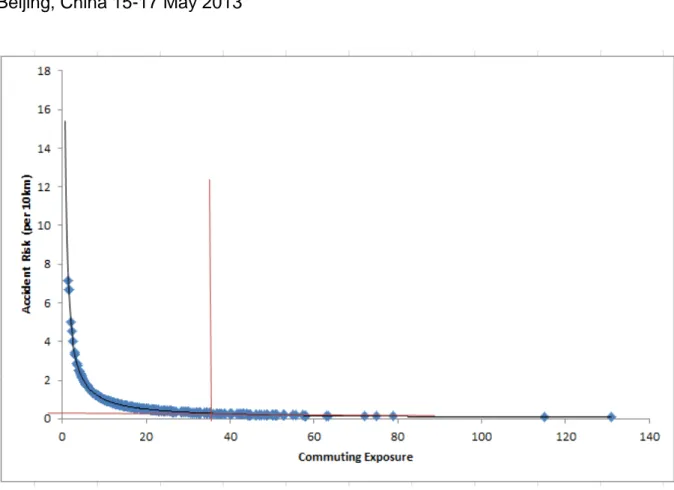
The accident risk was calculated by dividing the number of crashes by the distance travelled. The relationship between exposure travel and accident risk is shown in Figure 3. The data in this graph represent the accident risk (per 10km) for groups of worker with commuting exposure in 20km intervals. Figure 3 describes that worker who commute fewer kilometres have higher risks of crash involvement on kilometre basis. However, the risks are being saturated at 38km, which is mean at the risk at above 38km will same.
Figure 3: Accident risk by commuting exposure (based on distance home to/from workplace)
3.4 3.4 Actual Distance versus Accident Distance
Table 2: Multiple Regression Analysis
Unstandardized Coefficients t Sig. B Std. Error (Constant) -5.453 5.721 -0.953 0.341 Age 0.152 0.076 2.005 0.046* Driving/Riding Experience -0.060 0.088 -0.683 0.495 Actual Distance 0.460 0.034 13.705 0.000* Gender 1.822 1.306 1.395 0.164
Type of Vehicle: Motorcycle -4.051 5.378 -0.753 0.452 Type of Vehicle: Motorcar -0.309 5.834 -0.053 0.958
Occupational Status 0.911 0.981 0.929 0.354
Travel objective 2.092 0.946 2.211 0.028*
Time of Accident 0.323 0.998 0.324 0.746
Speed 0.106 0.016 6.650 0.000*
*Dependent Variable: Distance Origin to Accident Location *Significant at 0.05 level
A multiple regression analysis was performed to examine the relationship of actual travel distance (from origin to work/home) and accident distance. Ten explanatory variables as shown in Table 2 were tested for their contributing effects on the accident location. The intention is to understand if the distance of accident from origin is affected by total distance from home, age, type of vehicles, and time of accident as well as travel speed.
The results of the analysis suggest a relatively strong relationship as explained by the model R2=0.636 with four significant explanatory predictors. The model is as follows:
DistA= 0.152 Age + 0.460 Dist + 2.092 travel objective + 0.106 Speed Where;
DistA the accident distance travelled; Dist the actual distance travelled; Age age of the workers;
travel objective the purpose of the travelled; Speed average speed during the journey.
The accident location is strongly related to the travel objective reflecting that the trip heading to work is risker compared to the after work trip. Age group, distance between origin and destination and travel speed appeared to be significant in the model suggest that there are substantial effects from the surrounding environment on the accident travel risk. It was evident that motorists (especially young motorists) are prompted to travel at higher speeds when the travel distance is longer. Surprisingly, the type of vehicles (motorcycle and motorcar) did not display any significant effect on the accident location. This may be attributed to the imbalance sample of motorcar and motorcycle in the analysis. Similarly, the occupational status did not appear to be significant. The effect may be compounded by the actual travel distance as it was found that the travel distance is related to the occupational status (as explained above).
4 DISCUSSION
The sample size for this study was based on the sample through SOCSO data, thus it was not perfectly reflected the real scenario. Male and motorists dominated the sample size and fewer representatives from the high risk accident group which is between 15 – 25 years old were acquired. Nevertheless, these results are still deemed important as it provides insights into the causal factors of work commuting injury. More extensive study will be carried out to include further explanatory factors with a larger pool of respondents.
The results provide evidences that worth exploring further:
- Female tends to travel shorter compared to their male counterpart. The gender composition in the workforce is an important factor in contributing accident location. - Occupational status was found to have effect on the distance travel. This is a useful
insight as the lower occupational status group tend to live in mixed-development areas where the living standard is lower. In Malaysia the industrial area are usually build around the suburban area. From this fact, the exposures of the lower occupational status led them to live nearby to their workplace. This indirectly decreases their exposure but increases their risk of accident due to influence of the environment and mode choice. Car insurance article in US (2011), reported the car insurance rates
depends on home address due to that most accident occur closer to homes due to the risk being higher than the long distance journey. Spatial distribution of employment opportunity and residential hereby should be planned properly in the future.
- Factors such as age group, travel objective, travel distance and speed were found to positively affect the accident location. In this regards, there are other concerns such as road environment, type of road travelled and traffic condition that may influence the risk of accident.
5 CONCLUSION
On the contrary, it does not imply that shorter distance travel reduce the risk of accident. In short, the results did not show any proof of the accident risk increase with the mileage/ exposure. Therefore, it is fair to say that the causal factor for commuting accident is not only due to travel distance, others such as environmental factors, motorist characteristics, as well as traffic operation conditions might also contribute to the accident occurrence. Instead, mileage exposure should serve as a base for risk comparison across the motorists’ characteristics.
REFERENCE
[1] Annual Report 2009, Social Security Organization.
[2] Chapman, P., Roberts, K. and Underwood, G. (2000). A Study of the Accidents and Behaviours of Company Car Drivers. Behavioral Researching Road Safety:
Proceedings of the 10th Seminar on Behavioural Research in Road Safety [3] Clarke, D.D, Ward, P., Bartle, C., and Truman, W., 2005. Road Safety Research
Report No.58: An In-depth Study of Work-Related Road Traffic Accidents. School of Psychology, University of Nottingham.
[4] Gera, S. and Kuhn, P., 1981. Occupation and the Journey to Work: Some further Analysis. Socio Economic Planning Science. Vol. 15, pp. 83 – 93.
[5] Mitchell, R., Driscoll, T., and Healey, S., 2004. Work related road fatalities in Australia. Accident Analysis and Prevention 36, pp. 851-860.
[6] Report Industrial and Commuting Accidents 2009, NGO Unit, Operation Division, Social Security Organization.
[7] Road Safety in Western Pacific Region- Call for Action, World Health Organization, 2009.
[8] Salminen, S., 2000. Traffic accidents during work and work commuting. International Journal of Industrial Ergonomics 26, pp. 75-85.
[9] World report on road traffic injury prevention edited by Margie P. et al., World Health Organization 2004.
