Assessing and analyzing satisfaction level of domestic gas consumers in Tehran
179
0
0
Full text
(2) Assessing and Analyzing Satisfaction Level of Domestic Gas Consumers in Tehran (A case study in Great Tehran Gas Company). Supervisors: Professor Naude Dr.Amin-Naseri Prepared by: Seyed Ali Aghamiri Tarbiat Modares University Faculty of Engineering Department Industrial Engineering Luleå University of Technology Department of Business Administration and Social Sciences Division of Industrial Marketing and E-Commerce Joint MSc PROGRAM IN MARKETING AND ELECTRONIC COMMERCE. 2007.
(3) II.
(4) Abstract The quality is counted as an important and effective factor in the success and failure of any organizations and since it as a fundamental factor can be considered as the excellent and stable competition for the organizations. Therefore, all the organizations, particularly the service organizations must attempt to increase quality of their services rapidly. Moreover, service quality issues may differ from one country to another and from one industry to another one. Therefore it is definitely essential to establish services quality scales which is relevant to the country and culture where the service is offered. The present investigate is a field study research that its objective is to measure, assess and analysis services quality and satisfaction of domestic gas consumers by establishing and applying an appropriate measurement tool in Grate Tehran Gas Company (which is the largest provincial company of National Iranian gas Company). Therefore this research is conducted in Tehran (Capital of Iran) with a 1000 volume sample size in order to identify and prioritize service quality dimensions and their gaps. After collecting the data, different statistical tests including paired t-test, Friedman test, variance analysis, structural equation model (regression model), ANOVA, KMO-Bartlet test by the SPSS and Lisrel software is applied. Research results indicate that the highest perceived gap is in reliability dimension and the lowest gap is related to assurance dimension. Also the regression model exhibit that these dimensions have significant impact on gas consumer's satisfactions. At last suggestions are offered to increase the quality of services and to promote customer satisfaction and reduce identified gaps.. III.
(5) Acknowledgement This Master thesis concludes my studies for Master of Science degree in Marketing and E-commerce at Lulea University of Technology (in Sweden) and Tarbiat Modares University (in Iran). The thesis was carried out in Great Tehran Gas Company (the largest provincial company of National Iranian Gas Company), during 2005-2006. Initially I would like to express my sincere gratitude to my supervisors, Professor Naude and Dr. Amin-Nasseri for their intelligent guidance, helpful advice and useful comments during the whole process of the thesis writing. Furthermore I would like to thank my managing director in Great Tehran Gas Company and all of my colleagues for their good suggestions and kind help and support. My gratitude also goes to the entire respondent who took their time to provide valuable information. Finally my heartfelt thank is especially for my lovely wife and dear daughter and son, because they have been good sources of motivation in my whole life and for their support through the thesis process.. Tehran, April 2007 Seyed Ali Aghamiri. IV.
(6) Table of Contents Chapter 1 1 Introduction. 1. 1.1 Research subject description. 2. 1.2 Research basic problem. 2. 1.3 The necessity to conduct this research. 3. 1.4 Fundamental objectives of the research. 5. 1.5 Research hypotheses. 5. 1.6 Research methodology. 6. 1.7 Research execution stages. 7. 1.8 Research domain. 8. 1.9 Data collection methods. 8. 1.10 Statistical population and Sample. 8. 1.11 Sampling method. 9. 1.12 Analytical method. 9. 1.13 Defining words and technical terminology. 10. 1.13.1 ServQual. 10. Chapter 2 2. Literature review. 12. 2.1 Customer. 12. 2.2 Customer/consumer satisfaction. 12. 2.2.1 Consumer satisfaction definition. 12. 2.2.2 Satisfaction formation. 13. 2.2.3 Comprehensive model of customer satisfaction. 14. 2.3 Services and service quality. 15. 2.3.1 Service quality dimensions and models. 16. 2.4 Perceived value. 19. 2.4.1 Creating value for customers. 19. 2.4.2 Consumer benefit. 20. 2.4.3 Costs. 21. 2.4.4 Value creation. 21. V.
(7) 2.4.5 Tangible sources. 22. 2.4.6 Intangible sources. 22. 2.5 Disconfirmation model. 23. 2.6 Managing service quality. 23. 2.7 Customer relationship management (CRM). 26. 2.8 Service quality models. 27. 2.8.1 Technical and functional quality model. 27. 2.8.2 Gap model of service quality. 27. 2.8.3 Attribute service quality model. 30. 2.8.4 Synthesized model of service quality. 32. 2.8.5 Performance only model. 32. 2.8.6 Ideal value model of service quality. 34. 2.8.7 Evaluated performance and normed quality model. 35. 2.8.8 IT alignment model. 35. 2.8.9 Attribute and overall affect model. 38. 2.8.10 Perceived service quality and satisfaction model. 39. 2.8.11 PCP attribute model. 39. 2.8.12 Retail service quality and perceived value model. 42. 2.8.13 Service quality, customer value and customer satisfaction model. 43. 2.8.14 Antecedent and mediator model. 43. 2.8.15 Internal service quality model. 45. 2.816 Internal service quality DEA model. 46. 2.8.17 Internet banking model. 47. 2.8.18 IT-based model. 47. 2.8.19 Model of e-service quality. 50. 2.8.20 Great Tehran Gas Company. 51. Chapter 3 3 Introduction. 56. 3.1 Research method. 56. 3.1.1 Research variables. 57. 3.1.2 Methods and resources of data collection. 57. VI.
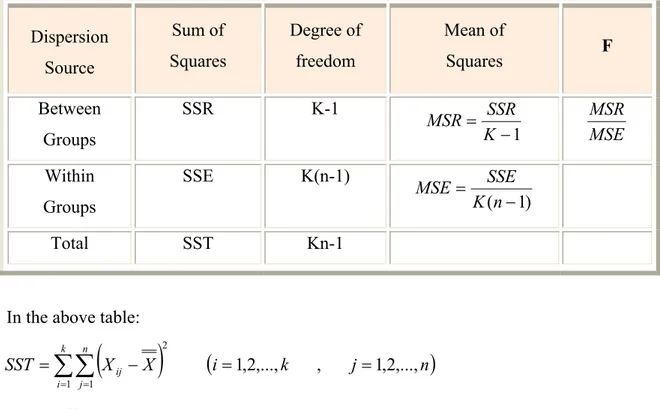
(8) 3.2 Research conceptual pattern. 58. 3.2.1 Research mathematical pattern. 59. 3.3 statistical sample and population. 60. 3.3.1 Sampling Method. 61. 3.4 Measurement Tool and Research Variables. 61. 3.4.1 Reliability and validity of Measurement Tool. 63. 3.4.2 Reliability. 63. 3.4.3 Validity. 64. 3.4.4 Factor validity of questionnaire. 64. 3.5 Execution Stages of Factor Analysis. 65. 3.5.1 Preparation of Correlation Matrix. 66. 3.5.2 Factors extraction. 66. 3.5.3 Selection and rotation of factors. 67. 3.5.4 Interpretation. 68. 3.6 Results of factor analysis. 68. 3.6.1Factor analysis of questions related to tangible factors (dimension). 68. 3.6.2Factor analysis of questions related to reliability dimension. 69. 3.6.3 Factor analysis of questions related to responsiveness dimension. 70. 3.6.4 Factor analysis of questions related to assurance. 70. 3.6.5 Factor analysis of questions related to empathy. 71. 3.7 Statistical method utilized in the research. 72. 3.7.1 Student t-test. 72. 3.7.2 Friedman variance analysis test. 74. 3.7.3 Kolmogrov-Smirnov test. 75. 3.7.4 One–Way Analysis of Variance. 76. 3.7.5 Post Hoc Comparisons. 78. 3.7.6 Structural Equation Model. 81. Chapter 4 4 Introduction. 87. 4.1 Descriptive statistics. 88. 4.1.1 Gender of the respondents. 88. VII.
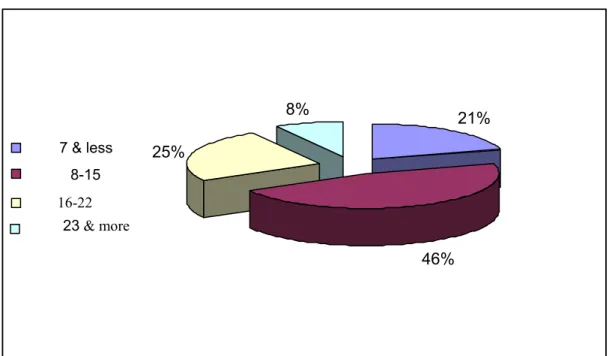
(9) 4.1.2 Age of respondents. 88. 4.1.3 Educational qualification of the respondents. 89. 4.1.4 Marital status. 90. 4.1.5 Occupational situation. 90. 4.1.6 Period of consuming the natural gas. 91. 4.2 Inferential Statistic. 91. 4.2.1 Confirmatory factorial analysis of service quality measurement tool. 91. 4.2.2 Manner to calculate factor scores extracted in the Third Chapter. 96. 4.2.3 Regression model of the effect of service quality dimension on. 96. the satisfaction 4.3. First group of hypothesis. 97. 4.4 Second group of hypotheses. 99. 4.4.1 Design of hypotheses. 100. 4.4.2 Tangible dimension of services quality. 100. 4.4.3 Reliability dimension. 102. 4.4.4 Responsiveness dimension. 103. 4.4.5 Assurance dimension. 105. 4.4.6 Empathy dimension. 106. 4.4.7 Main hypothesis test. 108. 4.5 Other questions. 109. 4.5.1 Whether five service quality dimensions possess similar importance. 109. in thepoint of domestic gas consumer's view? 4.5.2 In which of the five dimension of service quality, the gap is higher?. 110. 4.5.3 Whether the ratio of perceived service quality is similar in. 112. the different gas districts of Tehran? 4.5.4 Whether the satisfaction of consumers is similar in different gas districts of Tehran?. 115. 4.5.5 Whether the rate of services quality gap (E-P) is similar. 117. in different gas districts? 4.5.6 Whether ratio of total perceived services quality and each of. 119. the service quality dimensions have appropriate situation?. VIII.
(10) 4.5.7 Whether satisfaction level of domestic gas consumers is. 120. at the suitable level?. Chapter 5 5. Introduction. 123. 5.1 Study of the research findings, with respect to structural equations. 123. model 5.1.1 Confirmatory factor analysis of services quality measurement tool. 123. 5.1.2 Casual relations and impact of services quality dimensions on gas consumers satisfaction. 124. 5.2 Study of the research findings, with respect to the paired sample test. 124. 5.3 Study of the research findings; with respect to Friedman test. 125. 5.4 Study of the research Findings basis on the variance analysis. 126. test and Post Hoc comparisons 5.5 Study of the research findings basis on the population mean test. 126. 5.6 Suggestions. 126. 5.6.1 Offering suggestion base on the research results. 126. 5.6.2 Offering suggestions base on paired sample t-test. 127. 5.6.3 Offering suggestions base on paired sample t-test. 127. 5.6.4 Suggestions base on Fridman test. 127. 5.6.5 Suggestions basis on ANOVA test and Post Hoc compression. 128. 5.6.6 Suggestions base on the population mean test. 128. 5.7 Managerial applications. 129. 5.7.1 Expectations management of domestic gas consumers. 130. 5.7.2 Services offering management. 130. 5.8 Suggestions for future research. 131. 5.9 Managerial implications. 133. 5.10 Discussion. 135. References. 137. Appendix 1: Questionnaire. 144. Appendix 2: SPSS and LISREL Output. 149. IX.
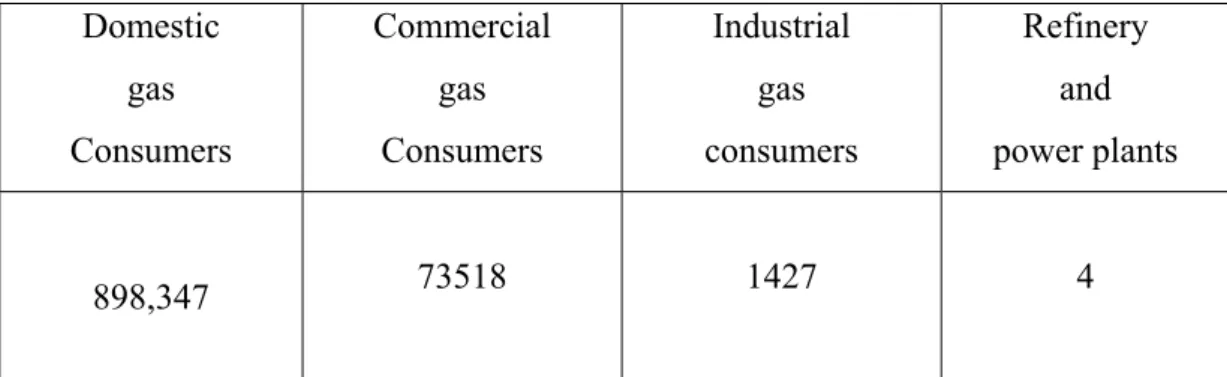
(11) List of tables Table 1: Fundamental objectives of the research. 5. Table 2: Number of different gas consumers. 52. Table 3: Sections of measurement tool (questionnaire). 62. Table 4: KMO and Bartlett’s Test. 68. Table 5: Questions communality of tangible dimension. 68. Table 6: KMO and Bartlett’s Test. 69. Table 7: Questions communality of reliability dimension. 69. Table 8: KMO and Bartlett’s Test. 70. Table 9: Questions communality of response dimension. 70. Table 10: KMO and Bartlett’s Test. 70. Table 11: Questions communality of assurance dimension. 71. Table 12: KMO and Bartlett’s Test. 71. Table 13: Questions communality of empathy dimension. 72. Table 14: Analysis of variance for comparison K. 77. Table 15: paired samples statistics for tangible dimension. 100. Table 16: Paired samples test for the tangible dimension. 101. Table 17: Twofold statistical samples for the reliability dimension. 102. Table 18: Twofold statistical samples for the reliability dimension. 103. Table 19: paired samples statistics for the responsiveness dimension. 103. Table 20: Twofold test samples for the response dimension factors. 105. Table 21: Twofold statistical samples for the assurance dimension. 105. Table 22: paired samples test for the assurance dimension. 106. Table 23: Twofold statistical samples for the empathy dimension. 106. Table 24: paired samples test for the assurance dimension. 108. Table 25: Twofold statistical samples for whole condition. 108. Table 26: paired sample tests for whole condition. 109. Table 27: Statistics test for Friedman Test. 110. Table 28: Rank mean of each of the five service quality dimensions. 110. Table 29: Part of statistical indexes of five fold service quality dimensions. 111. Table 30: Test Statistics for Friedman Test. 112. Table 31: Rank mean of service quality dimensions from the gap viewpoint. 112. X.
(12) Table 32: one-way variance analysis (ANOVA). 113. Table 33: paired Comparison of highest and lowest sq in gas districts. 114. Table 34: Paired comparison between highest and lowest sq in the gas districts. 114. Table 35: one-way variance analysis (ANOVA). 115. Table 36: Paired comparison of minimum and maximum satisfaction level. 116. of the domestic gas consumers Table 37: Paired comparison between the highest and the lowest. 117. satisfaction level of domestic gas consumers Table 38: One-way variance Analysis (ANOVA). 118. Table 39 paired samples compression. 118. Table 40: Comparison of minimum and maximum gap ratio in quality service. 119. Table 41: Services quality situation in the points of consumers view. 120. Table 42: Satisfaction level of domestic's gas consumers. 121. Table 43: paired samples test for services quality dimensions. 124. Table 44: Mean rank of five services quality dimensions. 125. Table 45: Mean rank of each of the five dimensions basis on the gap. 125. XI.
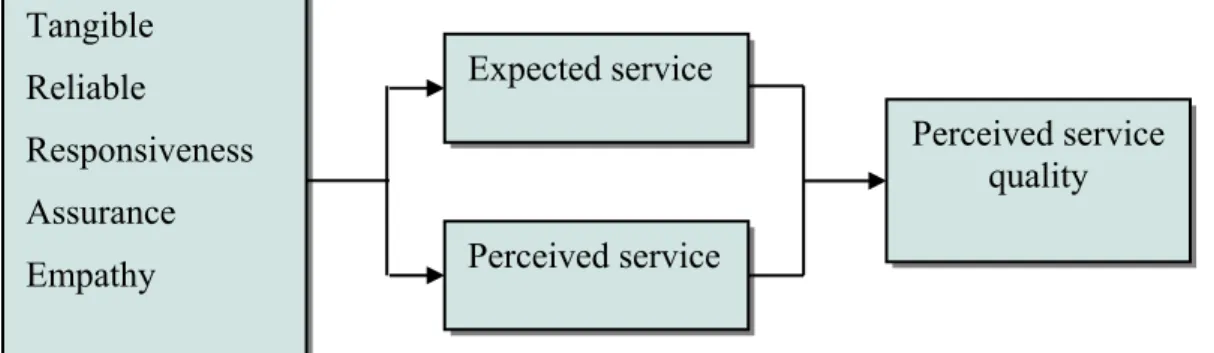
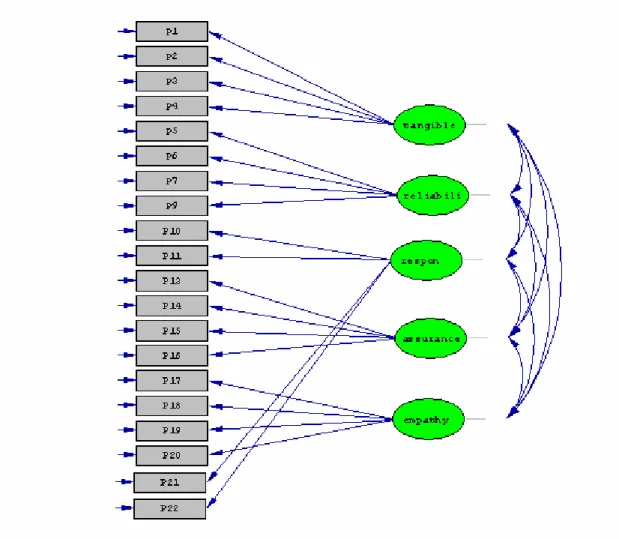
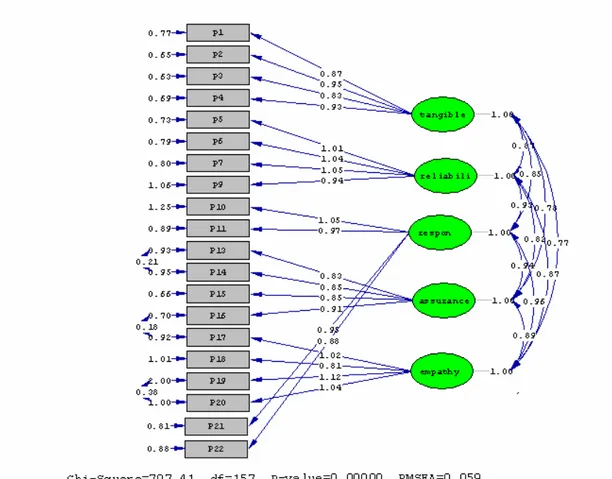
(13) List of figures Figure 1: Stages of the execution of the research. 7. \Figure 2: Satisfaction formation. 14. Figure 3: drivers of customer satisfaction and future intention. 15. Figure: 4 Value creations depend on benefit and cost positions. 20. Figure 5: Service Quality Model. 25. Figure 6: Service quality model. 27. Figure 7: Gap analysis model. 28. Figure8: Extended model of service quality. 30. Figure 9: Attribute service quality model. 31. Figure 10: synthesized model of service quality. 34. Figure 11: Value and attitude in negative disconfirmation. 36. Figure 12: IT alignment model. 37. Figure 13: Attribute based model. 38. Figure 14: Satisfaction service quality model. 40. Figure 15: PCP attribute model. 41. Figure 16: Modified model. 44. Figure 17: Model of service quality customer valve and customer. 44. satisfaction Figure 18: Antecedents and mediator model. 45. Figure 19: Internal service quality model. 46. Figure 20: Data envelope analysis service quality model. 48. Figure 21: Model of service quality in internet banking. 49. Figure 22: Information technology-based service quality model. 50. Figure 23: Conceptual model of measuring the service quality. 58. Figure24: Relations between service quality dimension and customer. 58. satisfaction. Figure 25: Respondents gender. 88. Figure 26: Respondents age. 89. Figure 27: Respondents educations. 89. Figure 28: Marital statues of respondents. 90. Figure 29: Respondents occupation. 90. Figure 30: Gas consuming duration. 91. XII.
(14) Figure 31: Services quality conceptual model. 92. Figure 32: SQ measurement model in the non-standard estimate. 93. condition Figure 33: Standard estimate of services quality measurement model. 94. Figure 34: Significant parameter of the model. 95. Figure 35: Conceptual model. 97. Figure 36: Conceptual model in the non-standard estimate condition. 98. Figure 37: Conceptual model in the standard estimation condition. 98. Figure 38: Model at the state of significant numbering. 99. Figure 39: Expectations and perceptions of domestic gas consumers. 101. Figure 40: Expectations and perceptions of gas consumers from. 102. GTGC performance on reliability dimension Figure 41: Expectations and perceptions of domestic gas consumers toward GTGC performance on responsiveness dimension. 104. Figure 42: Expectation and perception of domestic gas consumers toward GTGC performance on assurance dimension. 105. Figure 43 Expectations and perceptions of domestic gas consumers. 107. GTGC performance on empathy dimension Figure 44: Expectation and perception of domestic gas consumers. 108. toward GTGC performance Figure 45: Differences between perceptions and expectations in service quality dimensions. 111. XIII.
(15) Chapter 1 Research Generalities.
(16) 1 Introduction Despite the provincial Gas companies in Iran are governmental agencies, they are attempting to promote their positions; especially this has been emphasized by the National Iranian Gas Company that provincial gas companies must step up their efforts towards customers. It must be noticed that during the last few years, the competitions between gas companies have been intensified, whether at the national level or at the international level. Moreover, the growths at the information and knowledge of the gas consumers and accordingly their expectations and desires have encountered these companies with major challenges. Nowadays, the quality is counted as an important and effective factor in the success and failure of any organizations. Therefore, all the organizations, particularly the service organizations must attempt to raise their service quality rapidly, because the quality as a fundamental factor can be considered as the excellent and stable competition for the organizations (Bahia & Nantel, 2000). It must also kept in mind that providing high service quality is not an optional competitive advantage, which the organization accepts probably for making its own concentration, rather today, service quality is counted as the crucial factor for the survival and benefits of the organization. The previous studies show that “quality expenses” could swallow between 30 to 50 percent of the company's incomes. Indeed, the development of the service quality has been converted into the real strategy of organizations for increasing their competitive strength (Newman & Cowling, 1996). In the new global economy, business success is related to creating outstanding values in the product through quality of design and production as well as description these value to the customers effectively. Almost, there is always somebody who can supply the products on lower price in this world. In this situation, the pricing competition would mean fewer profits to the organization. Therefore, customers' retention through creating values-based quality would be an effective strategy. Indeed product quality is changing to the most important competition factor in the business world currently, and that’s why the present era is called “Quality Era” (Peeler, 1996). Attention to the service quality would accompany few advantages; first, service quality leads to the satisfaction of the customers and consequently it will increases the loyalty and market share. Second, service quality is counted as a fundamental element in the customer-oriented marketing. Consequently, from the customers' viewpoint, 1.
(17) acquiring competitive advantage through service quality is necessary to identify the quality obligations (Wang & Soha, 2000). According to Berry, service quality is a distinguishable factor and the most powerful competitive weapon, which the leadership has at most of the service organizations. Indeed, providing superior services through keeping high quality is counted as a preneed for success in service organizations (Kandampully, 1998).. 1.1 Research subject description As the natural gas distribution in different cities of Iran is exclusiveness, offered suitable services quality to customers has neglected from the actual focus point. Assessing offered service quality to the customers is a concept that has been presented by Parasuraman. This concept is the result of the comparison of customers’ expectations from the service quality with their perceptions from the service quality. In order to measure service quality, different scales have been applied and the most identified scale is SERVQUAL, which has been presented by Parasuraman et al. in 1988. Therefore, in this research, I would also use this scale, which is consisted of five dimensions: Tangibility, Reliability, Responsiveness, Assurance, and Empathy that totally include 22 items. In the SERVQUAL model, the domestic gas consumers (subscribers) are asked to initially distinguish the items with regard to their expectation from the service, based on Likert spectrum and then, they would be asked to distinguish their perceptions from the actual performance of the Great Tehran Gas Company (GTGC). If the perceived performance is lower than the person's expectations, it is the sign of quality weakness and if the performance is more than the expectation, it indicates higher service quality. Parasuraman et al. expressed that SARVQUAL as “disconfirmation” is a trusted tool to measure the service quality. Actually, in this model, we attempted to eliminate the gaps that arise from the dissatisfaction of customers.. 1.2 Research basic problem Although service sectors are counted departments which possess speedy growth in the 2.
(18) developing countries, there is less attention toward offered service quality in these countries. Indeed, due to success condition of seller market in the developing economy, studies related to service subject have been neglected (Yanggui, et al., 2003). Further, the part of this none-attention and disinterest can highlight to the fact that from the earlier time, there had been little apprehension from the distinction between service management and production organization management (Bitran & Lojo, 1993). Our country is not also an exception to this subject and as such is suitable in this case is not active at all. Here a question arises that what are the views of the domestic gas consumers in Tehran, with regard to service quality getting from the Great Tehran Gas Company (GTGC), and to what extent these services conform to their expectation.. 1.3 The necessity to conduct this research The inclination to service quality play important role in the service organizations and the companies because this is considered for the survival and profits of the organization. Nowadays, satisfaction of the customers and service quality are considered as crucial issues in majority of the service crafts (Stafford, et al. 1998). Philips et al (1993) in their research found that quality of the products and service of the strategic business units (SBU) are important factors that influence the performance of these units. They propound that superior quality creates high profit through higher prices and it's also a way for the growth of units. Further, Buzzell and Gale (1987) expressed that due to the effect of quality on perceived value from the customers, service quality not only has the capability of organization’s benefits but also it is in contact with the organization growth. Similarly, Rust et al. presented a model from the profit capability of the service quality that in this model services quality lead to increase the satisfaction, customer retention and more market share. Zithamel et al. during their research founded that leading service organizations in the US have obsession, in comparison to excellent quality. Indeed, superior quality is a key for being distinction, efficiency and productivity (Chang & Chen, 1998).. 3.
(19) Also it should be mentioned that almost 9/10 of total gas subscribers in Tehran are domestic gas consumers and gaining their satisfaction is necessary for GTGC managers. Finally, there are various reasons for offering high quality services to customers which have been mentioned below: 1. Increasing customer's expectations: In real sense, the expectations of the customers have risen, compared to the previous stage. These expectations are concerned with few factors for example, increasing information, knowledge level of the customers, advertisement of the organization, competitors performance etc. 2. Competitor's activities: Competitors, by constantly changing their services and the manner of offering them to customers, are changing the market to increase their share from the present market. This process will cause customers increased expectations. 3. Environmental Factors: These factors (political, legal, economic, social and cultural) make the organization induced to provide service with better quality. For instance, it can point to “Plan to honor the master in the administrative system”. 4. Services nature: Assessment of the service quality, with attention to services attributes would be difficult for the service receivers. Therefore, the customers, with attention to the physical surrounding signs of service, behavior and dealing of employees (that are the two fundamental factors to assess the service) would focus to the service assessment. 5. Inter-organizational factors: Organizations with their promotional activities, increase expectations and desires of the customers. As a result, when customers consult the organization, they have expectation of the promises. Therefore, the organization performance must be in a way that could response to those expectations. 6. Service quality advantages: Apart from the above materials, advantages resulting from the service quality itself are another factor that encourages the organizations to offer the superior services. One of the direct effects of offering superior services is the growth in the organization’s strength in providing services efficiently to the customers, because the organization has found that what are the desire and needs of customers. Therefore, unnecessary 4.
(20) services minimize or eliminate. Similarly, providing better services to the customers gradually cause repeat of purchasing and expansion of advertisement from words of mouth to the customers.. 1.4 Fundamental objectives of the research As has been stated earlier, the quality is counted as the important and effective factors in success and failure of the organizations. Gap is an important problem in providing services, because the customer overall assessment is the comparison between perceived and expected quality. In this research, the attempts have been made to, identify those gaps and present the suggestions to eliminate them. Table 1.1 has shown the goals of this research. Table 1: Fundamental objectives of the research 1. Awareness of domestic gas consumer's opinions about the offered services quality through GTGC. 2. Identification and prioritization of the service quality dimension from domestic gas consumers viewpoint. 3. To measure and assess satisfaction level of domestic gas consumers in the city of Tehran. 4. To compare expectations and perceptions of domestic gas consumers in the five service quality dimensions. 5. Offering solutions and suggestions to minimize the existing service gaps.. 1.5 Research hypotheses Two groups of hypotheses have been formulated during the present research: a) First group/set of hypotheses: Service quality dimensions have significant and positive effects on the satisfaction of domestic gas consumers (subscribers). •. Tangibility dimension of service quality has significant and positive effect on the subscribers’ satisfactions.. 5.
(21) •. Reliability dimension of service quality has significant and positive effect on the subscribers’ satisfactions.. •. Responsiveness dimension of service quality has significant and positive effect on the subscribers’ satisfactions.. •. Assurance dimension of service quality has significant and positive effect on the subscribers’ satisfactions.. •. Empathy dimension of service quality has significant and positive effect on the subscribers’ satisfactions.. b) Second group/set of hypotheses There is a Significant difference between the desirable and available conditions of service quality in Great Tehran Gas Company (GTGC). •. Significant difference exists between the desirable and available conditions of tangible service quality dimension in GTGC.. •. Significant difference exists between the desirable and available conditions of reliability service quality dimension in GTGC.. •. Significant difference exists between the desirable and available conditions of responsiveness service quality dimension in GTGC.. •. Significant difference exists between the desirable and available conditions of assurance service quality dimension in GTGC.. •. Significant difference exists between the desirable and available conditions of empathy service quality dimension in GTGC.. 1.6 Research methodology The aim of this research is to describe conditions and phenomena of study, in order to identify more existing conditions and assist to the decision making process. With regard to manner of the data collection, this thesis can be considered as a descriptive research. However, from the research objective viewpoint, this is an applied research that has been used to explain the connections between research variables. Moreover it should be mentioned that a local questionnaire for provincial gas companies is designed and through this way ServeQual model and its dimensions is utilized in gas industry for the first time in the world.. 6.
(22) 1.7 Research execution stages In the present study, the researcher after preparing the plan engaged to review and collect the literature on the proposed area related to service quality , which in this stage most of the articles on this topic were gathered. Then, with the designing of conceptual and arithmetic pattern of research, a questionnaire was designed for statistical sampling. In order to measure the validity as well as acquiring the sample volume, initially sixty questionnaires distributed between domestic gas consumers randomly in Districts 1 and 2 (GTGC has 10 different districts in Tehran). Finally all the questionnaires were collected and analyzed. And then after modifying the initial questionnaire the ultimate questionnaires were distributed and collected. In overall on the basis of the analysis of the collected data, results and suggestions were offered. Figure1 has showed the different stages during this research. Figure 1: Stages of the execution of the research Research proposal preparation. Literature review collection and study. Designing a conceptual research pattern. Design, distribution, and collection of the initial questionnaire. Study of reliability and validity of the questionnaire. Distribution and collection of ultimate questionnaires. Data analysis. Conclusion and suggestions. 7.
(23) 1.8 Research domain 1. Objective domain: The domain of the present research is assessing and analyzing the satisfaction level of domestic gas consumers with the use of SARVQUAL model.. 2. Research period: this research was conducted from February 2005 to February 2006.. 1.9 Data collection methods With the view that the present research is application and descriptive in nature, following methods were applied during the information collection: a) Library method: To collect the information related to previous studies as well as other research literature (secondary sources), library method was applied. In this stage, many articles related to the fields of services quality and satisfactions were collected. Most of these articles were accumulated through website, especially Emerald and Elsevier. b) Field method: The questionnaire were utilized for gathering the views of the consumers (primary sources), towards assessing the service quality.. 1.10 Statistical population and Sample Statistical population in this research is total domestic gas consumers in Tehran (898,347 subscribers). But, since the collection of total gas consumers was impossible (even if it was possible, with reference to time, expense, and other facilities, it was impossible), samples of statistical population (1000) were selected. To acquire sample size the following equation (Cochran formula) is used.. n=. N t² × pq N d² + t² pq. Where in the above formula: n : sample size N: population size. N=898347. t: the t table digit for 95% confidence. t=1.96. 8.
(24) p: probability ratio of satisfied people. p=0.5. q: probability ratio of dissatisfied people. q=0.5. d: estimated confidence interval. d=5/100. 1.11 Sampling method Sampling in this research taken place through simple stratified method and it was attempted that from each of the ten gas districts, equally about 100 samples were selected coincidentally and randomly. Also it should be mentioned that, almost there are about 90,000 domestic gas consumers in each Districts.. 1.12 Analytical method After collecting the data, different statistical tests, including paired t-test, Friedman, variance analysis, KMO-Bartlet test through the SPSS, Lisrel software is applied.. 1.13 Defining words and technical terminology Service quality: It shows the presentation of service equal or wider from the expectations of the customers. SERVQUAL: It is one of the measurement models that were presented for the first time by Parasuraman. This scale consists of five dimensions (Tangibility, Reliability, Responsiveness, Assurance and Empathy. This model studies the gaps between expectation and performance. Tangibles: This dimension points to the issues like appearance of the employee, facilities and equipments. Reliability: It means to present services to the customers without any mistake and delay. Responsiveness: This indicates that employees have tendency to help the customers and respond to their queries and give necessary guidelines to them. Assurance: It means employee with their behavior and attitude give the assurances to the customers as well as give them feeling of security and peace.. 9.
(25) Empathy: It means for example banks understand the problem and difficulties faced by customers and these problems are being solved. Further, individual attentions are given on the customers (Gronroos, 2000). SERVQUAL: The SERVQUAL scale is a 22-item instrument which measuring the expectations and perceptions of customers. This tool is designed to measure service quality, i.e. the comparison between consumers’ expectations with their perceptions of actual service delivered (Erik, K., 2006) The most important elements of the SERVQUAL instrument are (Parasuraman et al., 1990); (1) Five core dimensions of service quality that is applicable to all service industry/sectors: . Tangibles . Reliability . Responsiveness . Assurance . Empathy (2) Measurement of these dimensions over 22 items. (3) A total of 22 items focus on two questions: what an excellent service should provide (expectations) and what the service actually is providing (perceptions). (4) Scores are recorded on a seven point Likert scale. (5) Difference between expectations and perceptions scores is called a “gap”. (6) Service quality can be measured by interpreting these gaps.. 10.
(26) Chapter 2 Literature review and theory.
(27) 2 Literature review This chapter will give an overview of literature and model that are related to the research problem. In this chapter I will introduce the concepts of customer satisfaction, satisfaction formation, service quality concepts, relation between service quality and satisfaction, service quality dimensions, conceptual model of service quality and service quality model in order to shows a clear idea about the research area.. 2.1 Customer Customer satisfaction is one the most pivot issues of all organizations and companies private and governmental sector. In past the term customer was defined as "someone that purchases products and commodities from manufacturer unit or service companies. This traditional definition is not acceptable nowadays. The Slogan," our objective is to attract your satisfaction "- that is observed above doors of some services units - has defined as the basic goal of most companies and organizations. Whereas the new definition of customer is: " customer is a person who, with the value that organizations and companies create, they willing to influence his/her behavior (Hemmer, M. and Champy, J., 1993).. 2.2 Customer/consumer satisfaction Consumer satisfaction has long been recognized in marketing thought and practice as a central concept as well as an important goal of all business activities (Anderson et al., 1994, Yi 1990). Consumer satisfaction has different level of specificity in various studies. Although satisfaction with , say, a product attribute (Bettman , 1974) , a salesperson (Swan & Oliver , 1985) , and a consumption experience (Bearden and Teel ,1983; Oliver , 1980)may be useful , a more fundamental level is and should be the satisfaction with a product –commodity or services.. 2.2.1 Consumer satisfaction definition Customer satisfaction is defined in a various way by different authors. In following some definition of customer satisfaction will give us a clear idea about the customer satisfaction concept. Satisfaction is a person's feelings of pleasure or disappointment. 12.
(28) resulting from comparing a product's perceived performance (outcome) in relation to his or her expectations (Kotler 2000). Satisfaction is a function of consumer's belief that he or she was treated fairly (Hunt 1991). Customer satisfaction is a collective outcome of perception, evaluation and psycho logical reaction to the consumption experience with a product or service (Yi 1990).. 2.2.2 Satisfaction Formation The disconfirmation theory emerges as the primary foundation for satisfaction model in marketing literature( Oliver1982 ; Churchill and Surprenant 1980).Satisfaction in this theory is determined by the difference between perceived performance and cognitive standards such as expectation and desires (Liu and Khalifa 2003). Expectations are viewed as predictions made by consumers about what is likely to happen. during. impending. transaction. or. exchange. (Zethaml. and. Berry. 1988).Customer expectation can be defined as customer's pretrial beliefs about a product (Yoon , Zahedi and Mckinney 2002).perceived quality is the consumer's judgment. about. an. entity's. overall. 1988).perceived performance is defined as performance. fulfills. their. needs. ,. excellence. or. superiority. (Zeithaml. customer's perception of how product wants. and. desire. (Cadotte. et. al.. 1987).Disconfirmation is defined as consumer subjective judgment resulting from comparing their expectation and their perceptions of performance received (Mckinney et al. 2002, Spreng et al. 1996). In 1980 Oliver describe the process which satisfaction judgments are reached in the expectancy-disconfirmation framework. The following figure shows how satisfaction judgment is related to expectancy-disconfirmation approach. Buyers from expectations of the specific product or service before purchase and perceived quality level which is influenced by expectations. The figure 1 explains the arrow drown from expectations to perceived quality that indicate perceived quality may increase or decrease directly with expectation. Perceived quality may either confirm or disconfirm pre-purchase expectation. .. 13.
(29) Figure2: Satisfaction formation. Expectation. Disconfirma tion. Satisfaction. Perceived Quality. (Source: Oliver referred to in Anderson and Sullivan, 1993 P.127) The determinations of the extent to which perceived quality expectations are disconfirmed is indicated in figure 2 by arrow drown from expectation and perceived quality to disconfirmation. Satisfaction is positively affected by expectations and the perceived level of disconfirmation that is also shown by arrow in the figure 2. Disconfirmation and perceive quality have a stronger impact on the satisfaction (Oliver 1980).. 2.2.3 Comprehensive model of customer satisfaction The below model suggest that perceived service quality and perceived value impact on satisfaction which, in turn, influences future plans (figure 3).perceived service quality is viewed as consisting of two primary factors: core, the basic service" contacted " for or promise, and relational, the way in which the service is delivered (Gronroos, 1985;Morgan and Piercy, 1992). Perceived value is viewed as benefit received relative to costs (Zeithaml, 1988). Customer satisfaction is considered as the total evaluation of the service provider while future plans are the stated likelihood of returning to the service provider. The model parallels the "tripartite model" where the antecedents of satisfaction are the observed variables leading to an inferred state,. 14.
(30) satisfaction leading to observed variables and future intentions (Eagly and Chaiken, 1993). Figure 3: drivers of customer satisfaction and future intention. Core quality Switching intentions. Relational quality. Customer satisfaction. Loyalty intentions Perceived value. 2.3 Services and service quality Services are behavioral rather than physical entities, and have been described as deeds, performances or effort (Rathmell, 1966); deeds, acts or performances (Berry, 1980); activities or processes (Grönroos, 1991). As Parasuraman (1986) notes, there is a fairly widespread agreement in literature concerning the characteristics which tends to differentiate services from goods. Intangibility, inseparability of production and consumption, heterogeneity and perish ability are the four well-documented features of services acknowledged in the service marketing literature (Berry, 1980; Zeithaml et al., 1985). Because of these unique features, and the difficulties of defining and delimiting quality as it applies to intangibles, the measurement of service quality in specific service industries still remains as a challenge (Babakus and Boller, 1992). Service quality is a matter of knowing your customer, designing services to meet customer's needs, and finally managing the service production and delivery process to the customer (Jan Carlzon 2000).It sounds simple but in reality defining and measuring the quality of service is quite a complex task as it is determined by. 15.
(31) imprecise individual factors such as perceptions, expectation and experience of customer and providers (Roslina AB Wahid 2001). Service quality perceptions result from a compression of consumer's expectation with actual service performance and quality evaluations are not made solely on the outcome of a service delivered (Roslina AB Wahid 2001). Service quality has been the subject of considerable by both practitioners and researches in recent years. Definitions of service quality hold that this is the result of the comparison that customers make between their expectations about a service and their perception of the way the service has been performed (Caruana and Malta 2002; Gronroos, 1984; Parasuraman et al., 1985, 1988, 1994). Several studies have been conducted to identify traditional service quality dimensions that contribute most significantly to relevant quality assessments in the traditional service environment (e.g. Parasuraman et al., 1985, 1988; Johnston 1995; Pitt et al., 1995; Berry et al., 1985). Identification of determinants of service quality is necessary in order to be able to specify measure, control and improve customer perceived service quality (Jhonton, 1995). Parasuraman et al.'s (1985) identified ten detailed determinant of service quality through focus group studies: tangibles, reliability, responsiveness, communication, access, competence, courtesy, credibility, security, understanding/knowledge of customer. Later this ten dimensions where further purified and developed 5 dimensions- tangibles, reliability , responsiveness assurance and empathy to measure service quality, SERVQUAL (parasuraman etal., 1988).. 2.3.1 Service quality dimensions and models There are numerous models and dimensions of service quality For example, Gro¨nroos (1984) pioneered the field with model that stressed technical and functional service quality (i.e. what and how). Also, Parasuraman et al. (1985) introduced the GAP-model that focused on a number of gaps in and between the views of consumers and marketers. Both these models stressed the importance of expectation versus perception in service encounters. Another conceptual model of service quality according to a set of attributes, such as: professional judgment; behavioral aspects; and physical facilities and processes developed by Haywood-Farmer in 1988. A synthesized model consisting of three factors, such as: external influences, company. 16.
(32) image and traditional marketing activities presented by Brogowicz et al. in 1990. Cronin and Taylor (1992) described a service quality model based upon perceptions, not the expectations as in the previous models. Mattsson (1992) stated that service quality is the result of a satisfaction process and utilize a value-based approach. Teas (1993) focus on the fact that the service receiver assess objects with a perceived certainty, and that each object has a certain number of attributes. Berkley and Gupta (1994) connect the information strategies of the company with the services to improve the service quality by information technology. Dabholkar (1996) describes one attribute-based model and one overall-affect model of service quality self-service in technology-based situations. Spreng and Mackoy (1996) connect the constructs of perceived service quality and consumer satisfaction derived from expectations, perceived performance and desires. a hierarchical structure of three attributes, namely pivotal, core and peripherical ones developed by Philip and Hazlett in 1997. A model based upon functional and technical service quality, product quality in relation to price provided by Sweeney et al. in 1997. Value influences the willingness to buy. Oh (1999) introduces a model stressing the post-purchase decision process underpinned by service quality, customer value and customer satisfaction. Dabholkar et al. (2000) describe a broader conceptual framework supported by the antecedents of service quality and the mediators of customer satisfaction. Frost and Kumar (2001) develop an internal service quality model (linked to the GAP-model) based upon front-line and support staff. Soteriou and Stavrinides (2000) emphasize how service quality measures can be incorporated in the quest for service quality improvements by using consumable resources and account structures as fundamentals. Broderick and Vachirapornuk (2002) focus on a set of components that influence the perceived service quality such as: customer expectations, image and reputation, service setting, customer participation and service encounter. Zhu et al. (2002) show the relationship between IT-based services and customer perceptions of service quality. Santos (2003) describes a conceptual model of e-service quality consisting of a selection of virtual dimensions. In summary, many researchers have described service quality in various empirical contexts and have developed different models and recognized different factors – all of which tend to be derived from the service receiver’s perspective. Moreover, there is a broad variety of propositions of service quality that range from the rather simple to. 17.
(33) the more complex model. However, the doings, the actions and the reactions are mostly ignored (Gőran , 2oo6). Service quality dimensions have not been stated clearly in the literature. Specially, the number and content of dimensions suggested has varied between researchers. For instance, three dimensions for service quality (interactive quality, physical quality, and corporate quality) proposed by Lehtinen and Lehtinen in 1991. Gro¨nroos(1984) stated that there were three factors, but recognized a various set of three(technical, functional, and reputational). Whereas, in 1988 Leblanc and Nguyen claimed five dimensions (internal organization, corporate image, physical support of the service producing system, staff – customer interaction, and the level of customer satisfaction). The well-known SERVQUAL instrument (Parasuraman et al., 1988) also used five dimensions of service quality in evaluating the consumer’s judgment of service quality, but differed from Leblanc and Nguyen (1988) by naming the five dimensions as tangibility, reliability, responsiveness, assurance, and empathy. Hedvall and Paltschik (1989) recognized just two dimensions (willingness and ability to serve; and physical and psychological access). Saleh and Ryan (1992) proposed five dimensions in the hotel industry (tangibles, conviviality, reassurance, avoidance of sarcasm, and empathy). Babakus and Boller (1992) offered only one dimension (that is, service quality as a single factor in itself). In the car-service industry Bouman and van der Wiele (1992) identified three dimensions (tangibles, customer kindness and faith). Gagliano and Hatchcote (1994) identified four dimensions (tangibles, personal attention, reliability and convenience) in the retail industry. Dabholkar et al. (1996) recognized five dimensions in the retail industry (physical aspects, reliability, personal interaction, problem-solving, and policy). Three dimensions in terms of “physical distribution” (timeliness, availability, and condition) proposed by Bienstock et al. in 1997. Others have included those of Edvardsson(1996), Lehtinen (1991), Brown and Swartz (1989), Garvin (1983, 1987), and Gro¨nroos (1990, 1988, 1982). Theoretical arguments and empirical evidence recommend that there may be two overriding components to service quality, the process aspects (customer-employee relationship) of the service and the core or outcome aspects (contractual) of the service (Gronroos, 1985; Parasuraman et al., 1991b; Dabholkar et al., 1996). The relational (how it is delivered) and the core (what is delivered) are the main elements for most services. According to empirical research the service quality 18.
(34) components, including core and relational service quality, are related to overall service quality and /or customer satisfaction (Taylor and Baker, 1994; Zeithaml et al., 1996; Dabholkar et al., 1996). In summery, two crucial components of overall service quality are core and relational quality. These components have been connected to customer satisfaction, usually in studies that focus on recognizing the dimensions of service quality versus the inclusion of other potential determinants of satisfaction. Recently concerns have been stated that excluding the customers perceived price or costs may be a shortcoming of these models (Ravald and Gronroos, 1996).. 2.4 Perceived value Perceived value is not an easy and simple concept to define and measure (Woodruff, 1997; Holbrook, 1994; Zeithaml, 1988). Perceived value is the results or benefits customers receive in relation to total costs (which include the price paid plus other cost associated with the purchase). Value is the difference between perceived benefits and costs. However, what constitutes value seems to be highly personal, idiosyncratic, and may vary from one customer to another (Holbrook, 1994; Zeithaml, 1988). Research evidence propose that customers who perceived what they received "value for money " are more satisfied than customers who do not perceived they received "value for money" (Zeithaml, 1988). In addition, perceived value may be utilized by consumers to "bundle" different aspects of the service relative to competitive offerings. That is, perceived value can be viewed as a relative measure of the costs and other monetary aspects of the service in comparison to competition (Zeithaml, 1988).. 2.4.1 Creating value for customers Value creation concept is at the core of what a firm dose, because only superior value creation vis-a-vis rivals opens up the opportunity for higher profitability. What dose value creation depends on? In order to realize and apply the value creation concepts let first consider the underlying economics (Jellassi and Enders, 2004). Value created is the difference among consumer's perceived benefit from a given product and the firm's cost for providing the product. In the strategy and economics literature, there are numerous, often times divergent, definition of some closely. 19.
(35) related concepts such as value, consumer benefit, utility and value created (Jellassi and Enders, 2004). The relationship between consumer benefit, cost and value created is shown in the figure 4. Figure: 4 Value creation depends on benefit and cost positions 200. Consumer benefit consists of elements such as: 1-product & service 2-speed of delivery 3-Brand 4-Reputation 5-Etc. € Value created is the difference between consumer benefit (or maximum willingness to pay for a product) and the costs for providing the product. 150. 100. Cost consists of: 1-R & D 2-Raw materials 3-Production 4-Marketing 5-Sales 6-Etc. 50. 0. Consumer Benefit. Value created. Costs. Source: Adapted from D. Besanko, D. Dranove, M. Shanley and S. Schafer, Economics of strategy, John Wiley, 2003, p.368.. 2.4.2 Consumer benefit Consumer benefit consists of all the characteristics that an individual consumer values in a product or service. In economic terms, consumer benefit is approximated by the buyer's maximum willingness to pay for given product. The crucial question that needs to be asked is: 'when is the buyer indifferent between buying and not buying a specific product or service (Jellassi and Enders, 2004)? To illustrate this concept, consider the automatic bidding agent at eBay, the online auction company. Imagine you want to purchase a laser printer at eBay. After picking out a printer, you have the possibility of entering into the bidding agent a maximum price at which you would still be willing to buy the printer. This particular printer might have a perceived worth to you of € 200. The bidding agent then starts at lowest offering price of, say, € 20. Any time another bidder enters the race and trumps your bid, the bidding agent is automatically activated and places a bid just above the previous one, until it reaches your maximum price of € 200. When someone else goes over this amount, you drop out. The implicit meaning behind this is that the benefit. 20.
(36) that you expect from the printer does not justify the higher price that is now being charged. Your consumer benefit and, therefore, also your maximum willingness to pay are € 200 (Jelassi and Enders, 2004, p.96).. 2.4.3 Costs Costs, in this context, include all the expenses that are incurred in providing a product to the consumer. This includes different cost items, such as technology development, raw materials, production, marketing, sales and delivery. (Jelassi and Enders, 2004, p.97). Variable costs, such as raw materials for a product or postage, can be attributed directly to an individual product, whereas fixed costs, such as the costs for the development of a website or construction of a warehouse, need to be spread out across all the products that are sold through this website. The cost of firms depend on different cost drivers, such as economies of scale and scope, capacity utilization, previous experience or input prices(Jellassi and Enders, 2004).. 2.4.4 Value Creation Value created is the difference between the benefit that consumers get from using a product and the costs that are incurred the product. Note that value created by itself does not state anything yet about price or profits. Determining price will be the next step. There are two necessary requirements that a firm needs to fulfill in order to compete successfully in the market place(Jellassi and Enders, 2004). The value that it create: Must be positive: the cost must be lower than the benefit, it provides to consumers. Must be higher than value that is created by competitors: Unless a firm can create similar or higher value than competitors, it will not be able to stay in business over the medium to long term. This is due to the fact that competitors can either undercut price due to lower costs or offer consumers more benefit while charging the same price (Jelassi and Enders, 2004, p.98). What exactly constitutes consumer benefit? It is inherently difficult to measure, because consumer benefit can not be quantified objectively, regardless of place, time and person (Jellassi and Enders, 2004). Instead it varies from individual to individual, depending on:. 21.
(37) Personal performance: you might derive a high benefit from driving a shiny sports car, whereas your next-door neighbor, who has three children, will get much more benefit from a mini-van. Place: think of a freezer in the arctic versus a freezer in the Sahara. Time: think of the benefit of electric light during the day versus night. There is a wide range of sources for consumer benefit, which can be divided into tangible and intangible sources, depending on whether they can be observed directly. Tangible and intangible sources of consumer benefit.. 2.4.5 Tangible Sources Tangible sources of consumer benefit include the following (Jellassi and Enders, 2004): Product quality: this characteristic refers to the objective traits of a product, such as its functionality, durability (or reliability) and ease of installation. Degree of product or service customization: the more a product or service can be adapted to specific customer need, the more benefit is creates for individual user. Convenience: the mental energy, effort and time that buyers have to expend during the purchasing process need to be taken into account when comparing different providers. Service quality: this characteristic refers to the friendliness and know-how of salespeople or in the case of a website, the degree of personalization, ease of use, and response time and information quality of online enquiries. Speed of delivery: the ability to deliver products and services quickly is an important source of consumer benefit. Speed depends on the availability of the products, location of the seller, and quality of the logistic process. Product range: a broad and deep selection provides an important source of differentiation since it allows convenient and quick one-stop shopping (Jelassi and Endes, 2004, p.98).. 2.4.6 Intangible Sources Intangible sources of consumer benefit include the following(Jellassi and Enders, 2004):. 22.
(38) Brand: this characteristic refers to the perceived traits that consumers associate with the company that is selling a product or a service. A strong brand tends to result from products that meet high-quality standards, yet this may not necessarily be so. It might also come as a result of intensive and innovative marketing activities. Brands need to be built and nurtured in order to use them as a differentiating characteristic in the marketplace. Reputation: the perceived historic performance of a company is a major factor influencing reputation. Threshold features: are the minimum requirements that a firm must fulfill in any product or service. If a firm can not meet these minimum requirements, then it will get excluded from the market because buyers will not even take it into consideration. Critical success factors: on the other hand, are those benefits that are crucial for the buyer's decision to purchase a given product (Jelassi and Enders, 2004, p.99).. 2.5 Disconfirmation model The key elements of the satisfaction/dissatisfaction process according to the disconfirmation paradigm (Hill 1986) are: 1- Examination of some prior basis. 2-comparison between expectation and perceived performance 3-post purchase judgment that the experience was noticeably better or worse than anticipated, leading to feelings of satisfaction or dissatisfaction The dissatisfaction pattern defines customer satisfaction in the best way. The most important components of the disconfirmation paradigm are: satisfaction / dissatisfaction, disconfirmation, perceived performance and expectation. According to this theory if the perceived performance is less than expected (negatively disconfirmed), consumers will be dissatisfied. On the other hand if the perceived performance exceeds expectations (positively disconfirmed) consumer will be satisfied (Hill 1986).. 2.6 Managing service quality The service quality of a firm is tested at each service encounter. If retail clerks are bored, cannot answer simple question, or are visiting with each other while customers are waiting, customers will think twice about doing business again with that seller.. 23.
(39) Customers from service expectations from past experience, word of mouth, and advertising compare the perceived service with the expected service. If the perceived service falls bellow the expected service, customers are disappointed. If the perceived service meets or exceeds their expectations, they are apt to use the provider again (Katter, 2003). Parasuraman, Zeithaml, and Berry formulated service-quality model that highlights the main requirements for delivering high service quality. The model, shown in figure 5, identifies five gaps that cause unsuccessful delivery: 1- Gap among management perception and consumer expectation: management does not always correctly perceive what customer want. For instance hospital administrators may think that patients want better food, but patient may be more concerned with nurse responsiveness. 2- Gap between management perception and service quality specification: management might correctly perceived customer's wants but not set a performance standard. Hospital administrators may tell the nurse to give "fast" service without specifying it in minutes. 3- Gap between service- quality specifications and service delivery: personnel might be poorly trained, or incapable or unwilling to meet the standard; or they may be held to conflicting standards, such as taking time to listen to customer and serving them fast. 4- Gap between service delivery and external communication: consumer expectations are affected by statements made by company representatives and ads. If a hospital brochure shows a beautiful room, but the patient arrives and finds the room to be cheap and tacky looking, external communications have distorted the customer's expectations. 5-. Gap between perceived service and expected service: this gap occurs when the customer misperceives the service quality. The physician may keep visiting the patient to show care, but the patient may interpret this as an indication that something really in wrong.. The same researcher (Parasuraman, Zeithaml, and Berry) found five determinates of service quality. These are presented in order of importance: 1- Reliability:. the ability to perform the promised service dependably and. accurately.. 24.
(40) 2- Responsiveness: the willingness to help customers and to provide prompt service. 3- Assurance: the knowledge and courtesy of employees and their ability to convey trust and confidence. 4- Empathy: the provision of caring, individualized attention to customers. 5- Tangibles: the appearance of physical facilities, equipment, personnel, and communication materials. Figure 5: Service Quality Model Word-of-mouth Communication. Personal needs. Past experience. Expected service. Gap 5 Customer. Perceived service. Gap 1 Marketer. Service delivery (including pre- and post- contacts). Gap 4. External communication to consumers. Gap3. Translation of perceptions in to service – quality specifications Gap 2 Management perception of consumer. Source: Parasuraman, Zeithmel, and Berry, "a conceptual model of service quality and its implications for future research", journal of marketing (fall 1985).. 25.
(41) 2.7 Customer relationship management (CRM) Customer relationship management (CRM) is one of most current IT topics (Bose 2003). According to XU(2002), the objective of CRM is , to improve a customer's experienced value of how they interact with companies, which will with a bit luck, create satisfaction , which in turn builds loyalty and ideally yields more sales. The value of interaction will be improved by increasing companies' capacity to understand a customer specific need. (XU, 2002) with CRM it involves acquisition, analysis and use of knowledge about the customer in order to better understand their needs and wishes. The term customer is in fact a broad definition that includes vendors, channel partners or anyone who needs information from the company. (Bose, 2003) Consequently, by using customer information wisely to deliver what the customer needs, companies will create long-term, collaborative relationship with the customers. This will bring many advantages since long-term customers are less costly to serve, and smooth –running relationships are less resource intensive.(Crosby,2002) CRM emerged for the reason that customer differ in their preferences and purchasing habits. Understandably, if the customer's needs and wishes were identical, there would be little use of CRM. Companies could continue to use mass marketing and mass communication without any risk of failure. Actually, customized marketing has been a reality for long time, realized by niche firm positioning towards certain customers. However, it's only recent that mass customization of product and services has been a realistic objective. The enabling factor is of course IT (Bose, 2002, referrers to Mckim and Huges). IT affects business activities in many different ways. Primarily, it can facilitate communication, information sharing and collaboration process with customers and within a company or network. This is an important factor since, independent of marketing approach; companies can not operate effectively unless they have the capability to communicate rapidly, accurately and over a great distance. The communication also needs to be two-way, integrated, recorded and managed. (Zindelin, 1998). 26.
(42) 2.8 Service quality models This part makes an attempt to study various service quality models. The primary aim of these models is to enable the management to understand and enhance the quality of the organization and its offering. Nineteen conceptual service quality models reported during the period (1984-2003) are reviewed in this part. Each of them is representative of a different point of view about services. The brief discussions on the models are as under: 2.8.1 Technical and functional quality model (Gro¨ nroos, 1984) Companies in order to compete successfully must have an understanding of customer perception of the quality and the way service quality is affected. Running perceived service quality means that companies have to match the expected services and perceived services to each other so that consumer satisfaction is achieved. Three components of service quality identified, namely: technical quality; functional quality; and image (Nitin Seth., et al, 2004). (see Figure 6): Figure 6: Service quality model. 2.8.2: GAP model of services quality(Parasuraman et al.,1985) Parasuraman, zithamel and Berry (1985) planned that service quality is a function of the differences between expectation and performance along the services quality. 27.
(43) dimensions. They proposed a service quality model (Figure 7) based on gap analysis. The various gaps visualized in the models are: Gap1: Distinction ammong consumers’ expectation and management’s perceptions of those expectations, i.e. not knowing what consumers expect. Gap2: Difference between management’s perceptions of consumer’s expectations and service quality attributs, i.e. improper service-quality standards. Gap3: Difference ammong service quality attributs and service actually delivered i.e. the service performance gap. Gap4: Change ammong service delivery and the communications to consumers about service delivery, i.e. whether promises match delivery?. Figure 7: Gap analysis model. Gap5: Distinction between consumer’s expectation and perceived service. Gap five depends on size and direction of the four gaps associated with the delivery of service quality on the marketer’s side.. 28.
(44) According the gap model, the service quality is a function of perception and expectations and can be formulate as:. where: SQ = overall service quality; k = number of attributes. Pij = Performance perception of stimulus i with respect to attribute j. Eij = Service quality expectation for attribute j that is the relevant norm for stimulus i. This investigative study was refined with their subsequent scale named SERVQUAL for measuring customers’ perceptions of service quality. (Parasuraman et al., 1988). Then the original ten dimensions of service quality collapsed in to five dimensions: reliability, responsiveness, tangibles, assurance (communication, competence, edibility, courtesy, and security) and empathy which capture access and understanding/knowing the customers. Afterward SERVQUAL was revised in 1991 by replacing “should” word by “would” and in 1994 by decreasing the total number of items to 21, but five dimensional structure remaining the same. Morover to this empirical study, the authors characterized and further delineated the four gaps identified in their research of 1985, that led to comprehensive service quality model (Figure 8). With regard to this extended model most dimensions involve communication and control process implemented in organizations to run employees (Nitin Seth., et al, 2004).. 29.
(45) Figure8: Extended model of service quality. 2.8.3 Attribute service quality model (Haywood-Farmer, 1988) This model (Figure 9) states that a service organization has “high quality” if it meets customer preferences and expectations consistently. According to this, the separation of attributes into various groups is the first step towards the development of a service. 30.
(46) quality model. In general, services have three basic attributes: physical facilities and processes; people’s behavior; and professional judgment. Figure 9: Attribute service quality model. Every attribute includes several factors. In this model, each set of attributes forms an apex of the triangle as shown in Figure 9. Too much concentration on any one of these elements to the exclusion of other may be appropriate it may lead to disaster for. 31.
(47) e.g. too much emphasis on procedures may give an impression to the customer that he will be processed as per his sequence. They also attempted to map varrious type of service settings as per degree of contact and interaction, degree of labor intensity and degree of service customization in to this model. For intance services, which are low in terms of customers’ contact customization and labor intensity (utilities, transportation of goods etc.), are closer to physical facility and process attribute of the model. Thus, the model suggests that special care at this instant must be taken to make sure that equipment is reliable and easy for customer to use (Nitin Seth., et al, 2004).. 2.8.4 Synthesized model of service quality (Brogowicz et al., 1990) Service quality gap can exist even when a customer has not yet experienced the service but learned through word of mouth, advertising or through other media communications. Therefore there is a need to integrate potential customers’ perceptions of service quality offered as well as actual customers’ perceptions of service quality experienced. The mentioned model attempts to combine traditional managerial framework, service design and operations and marketing activities. The objective of the model is to recognize the factors associated with service quality in a traditional managerial framework of planning, implementation and control. The synthesized model of service quality (Figure 5) considers three factors: company image, external influences and traditional marketing activities as the factors influencing technical and functional quality expectations (Nitin Seth., et al, 2004).. 2.8.5 Performance only model (Cronin and Taylor, 1992) Cronin and Taylor studied the conceptualization and measurement of service quality and its relationship with consumer satisfaction and purchase intentions. The autors compared calculated difference scores with perception to conclude that perceptions only are better forecaster of service quality. The researcher discussed on the framework of Parasuraman et al. (1985), with respect to conceptualization and measurement of service quality and improved performance. 32.
(48) only measurement of service quality called SERVPERF by illustrating that service quality is a form of consumer approach and the performance only measure of service quality is an enhanced means of measuring service quality. The authors argued that SERVQUAL confounds satisfaction and attitude. They expressed that service quality can be conceptualized as “similar to an attitude”, and can be operationalzed by the adequacy-importance model. Especially, they found that Performance instead of “Performance-Expectation” determines service quality. Service quality is assessed by perceptions only without expectations and without importance weights according to the below formula:. where: SQ = overall service quality; k = the number of attributes; Pij = performance perception of stimulus i with respect to attribute j (Nitin Seth., et al, 2004).. 33.
(49) Figure 10: synthesized model of service quality. 2.8.6 Ideal value model of service quality (Mattsson, 1992) In most of the researches on service quality “expectation is treated as belief about having desired attributes as the standard for evaluation”. Though, this matter needs to be studied in the light of other principles such as experience based, ideal, minimum acceptable and desirable.. 34.
(50) Ideal model of service quality suggests the use of a perceived ideal standard against which the experience is compared. Figure 11 indicates that implicit negative disconfirmation on a pre-conscious value level, is then hypothesized to determine satisfaction on a “higher” attitude level. This negative disconfirmation is the major determinant of consumer satisfaction, more attention should be given to cognitive processes by which consumers’ service concepts are formed and changed (Nitin Seth., et al, 2004).. 2.8.7 Evaluated performance and normed quality model (Teas, 1993) The conventional disconfirmation model possess conceptual, theoretical and measurement problems with respect to the author. Teas stated that in the measurement of service quality following issues, i.e. SERVQUAL (Parasuraman et al., 1988) as: theoretical definition doubt; theoretical justification of expectations in the measurement of service quality; the usefulness of the probability specification in the evaluated performance (EP) measurement; and link among service quality and consumer satisfaction/dissatisfaction. The author suggests the following two frameworks for service quality. Evaluated performance (EP) framework: with the assumption that an individual assesses object i with perceived certainty and that the object i possess a constant amount of each specification also with Minkowski space parameter equals to unity. The perceived quality is modeled as:. where: Qi = The individual’s perceived quality of object i. wj = Importance of attribute j as a determinant of perceived quality. Aij = Individual’s perceived amount of attribute j possessed by object i. Ij = The ideal amount of attribute j as conceptualized in classical ideal point attitudinal models. m = Number of attributes.. 35.
(51) With an assumption that perceived ability of the product to deliver satisfaction can be conceptualized as the product’s relative congruence with the consumer’s ideal product features. Figure 11: Value and attitude in negative disconfirmation. Normed quality model: if the object i is defined as the excellence norm that is the focus of revised SERVQUAL concept, the above equations can be applied to define the perceived quality of excellence norm Qe in terms of the similarity ammong the excellence norm and the ideal object with respect to “m” attributes. The quality of another object i, Qi relative to the quality of excellence norm then normed quality (NQ) is:. NQ = Normed quality index for object i. Qe = The individual’s perceived quality of the excellence norm object. For infinite ideal points, normed quality is:. Aej = individual’s perceived amount of attribute “j” possessed by the excellence norm “e” (Nitin Seth., et al, 2004).. 2.8.8 IT alignment model (Berkley and Gupta, 1994) Investments in information technology (IT) sectors are generally aimed at productivity of efficiency gains with a little attention to improve customer service and. 36.
Figure


+7
Related documents
6.1 Service Concept alignment and principles for great customer experience In this section a comparison is done between what the managers, back-office, and front-end
However, considering the fact that the fourth attempt ran into 8 finite requests, by a control flow density of 0.3, but with a node to service edge density of 0.4,
The results from the different dimensions show that there is a gap between expectations and perceptions which means that the customers are not fully satisfied about the
We carried out this qualitative research to understand perception of and experiences related to HTN among rural Bangladeshi hypertensive women.. Methods: A total of 74
Mätetal som är associerade med denna typ av mått som kan vara intressanta för byggbranschen är Supply Chain Counsil, 2010: Capacity Utilization AM.3.9 Detta mätetal är ett nivå
The reflection coefficient is degraded when the total width of the series transistor increases, therefore the input matching has to be improved in this approach by putting the
Andersson and Jern (2019) describes how service deals with action and hospitality deals with mood, but that these two have great cooperation in a meal experience. In
Key findings of the study are that service quality is represented by six dimensions in the hospitality industry, relating to Reliability, Assurance, Tangibles, Employees,
