Eva Nordlander, Jenny Holgersson, Eva Thorin, Martin Thomassen, Jinyue Yan Evaluation of the Energy Balance of two Biogas Plants
1661-1674
Corresponding author: eva.nordlander@mdh.se, +46 21 103149
Energy Efficiency Evaluation of two Biogas Plants
Eva NORDLANDER*, Jenny HOLGERSSON**, Eva THORIN*, Martin THOMASSEN*, Jinyue YAN*,***
*School of Sustainable Development of Society and Technology, Mälardalen University, P.O. Box 883, SE-721 23 Västerås, Sweden
**Eskilstuna Energi och Miljö
Kungsgatan 86, SE-631 86 Eskilstuna, Sweden
*** Royal Institute of Technology, SE-100 44 Stockholm, Sweden Abstract
Anaerobic digestion for biogas production is a promising renewable energy technology which can be used to achieve environmental goals set in the European Union and other regions. There are however many improvements that can still be made to the process. Furthermore, there are alternative energy conversion processes that compete for some of the substrates used in anaerobic digestion. Energy efficiency could therefore be a tool for measuring and comparing the performance of biogas plants. This study suggests a method for calculating energy efficiency of the biogas plant so that it is comparable to other processes. Two examples of existing biogas plants in Sweden have been selected for the efficiency assessment by using the method proposed in this paper. The results are compared between the plants to assess the further potential of improvement.
Introduction
Global warming has become more and more accepted worldwide as a problem which urgently needs to be addressed. There are actions taken to decrease the threat such as the Kyoto protocol. Renewable energy is one of the promising solutions. In the European Union the goal is for renewable energy sources to cover 20% of the total energy supply by 2020. One such promising renewable energy source is biogas which can be produced in an anaerobic digestion process. Biogas can be produced from a number of different substrates. Some substrates are easier digested than others and there are still many improvements that could be made to the process to get more biogas out of the same amount substrate. Furthermore, for some substrates, such as organic wastes, there are alternative processes that could be employed to convert energy such as gasification and combustion. From this background two questions arise:
• For which scenarios/substrates is anaerobic digestion the more suitable process? • How can the anaerobic digestion process be improved?
There are a number of studies to assess the performance and the efficiencies of different biogas production pathways or processes by a number of different methods [1-7]. Madlener et al. [3] studied a wide range of criteria including labor/time spent for plant operation, amount of substrate used, amount of biogas or net electricity produced, net heat produced and net GHG emissions released to the atmosphere. Cline et al [4] studied pollutant degradation in the digester while Klimiuk et al. [6] studied the conversion efficiency of different crops into biogas. Börjesson and Berglund [7] did an extensive analysis on the complete biogas system
studying energy input and emission. Three of the studies mentioned [1-2, 3] considered mass and energy balances.
All the above studies consider performance aspects of the biogas plant/system. However, they do not measure the performance of the biogas plant in a way that makes it comparable to the performance of alternative pathways such as thermal gasification. Furthermore they do not provide a measure on how efficient a single plant is at converting incoming biomass to biogas, since either the system considered is larger or smaller than just a plant [2,6,7] including for example harvesting, or energy content of the substrate is not considered [1,3,5].
The aim of this study is to use energy conversion efficiency calculations to evaluate the biogas process. Energy conversion efficiencies would enable the biogas process to be compared to other alternative processes from the perspective of energy performance. Two different ways of calculating the energy content of the substrate will be tested and compared.
Since this is a novel approach for energy performance calculations of biogas plants, it will first be evaluated using only two plants. The plants are feed with different substrates. The efficiencies will be calculated for every month in the year 2009 to see if any seasonal variation can be found. The two biogas plants are located in Sweden, in the cities of Eskilstuna and Västerås.
Eskilstuna biogas plant
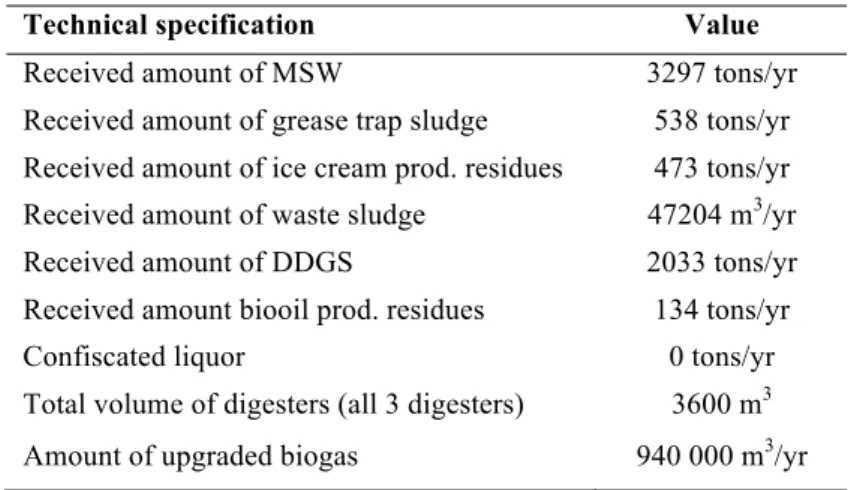
The digesters in Eskilstuna were installed in 1955. At this time they were used to reduce the amount of sewage sludge before it was discharged to the recipient. The raw biogas was only used for heating the building and the excess was flared. In 2003, a plant for upgrading the biogas was built. The consumption of biogas for transportation in Eskilstuna is estimated to be 1.7 million Nm3 in 2011; therefore there is a need for increasing the production. Detailed facts can be seen in Table 1.
Table 1 Technical data for the Eskilstuna biogas plant for 2009
Technical specification Value
Received amount of MSW 3297 tons/yr Received amount of grease trap sludge 538 tons/yr Received amount of ice cream prod. residues 473 tons/yr Received amount of waste sludge 47204 m3/yr
Received amount of DDGS 2033 tons/yr Received amount biooil prod. residues 134 tons/yr
Confiscated liquor 0 tons/yr
Total volume of digesters (all 3 digesters) 3600 m3 Amount of upgraded biogas 940 000 m3/yr
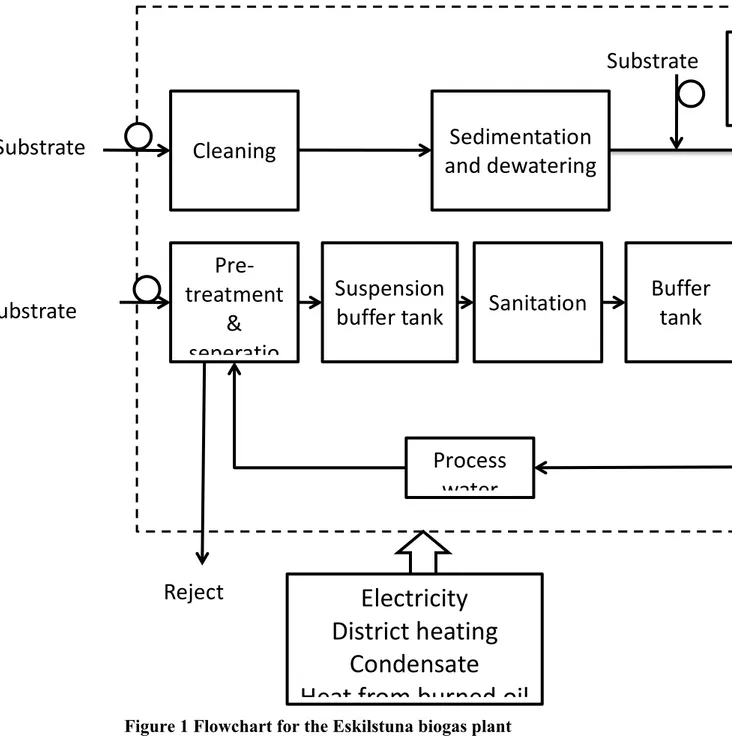
The incoming sewage sludge (2 in Figure 1) is filtered in a 3 mm grid before it is cleaned with ferrous sulphate and filtered again in a sand trap. The cleaned product is aerated, sedimented and dewatered in basins. In (3) in Figure 1, complement substrates such as fat removal sludge, alcohol confiscated by the police and distiller’s wastes are added before the product enters the digester.
Source-sorted organic municipal solid wasted (MSW), from food industry, stores, restaurants and households (from 2011) is delivered to the pre-treatment plant in plastic bags (1 in Figure 1). The bags are opened mechanically and the organic MSW is separated from the bags in a rotating screen. Metals are separated using a magnet separator and a vortex system. A screw press is used to divide the organic MSW into a solid and a fluid part. The solid part is
composted and the fluid part is diluted with water so it can be pumped. The bags and other combustible residuals are burned at another plant.
The product from the organic MSW is stored in buffer tanks before sanitation where it is mixed with other substrates, mainly from the food industry. During the sanitation step the substrate is heated to a temperature of 70⁰C and kept at that temperature for one hour. Condensate from a CHP (combined heat and power) plant, district heat, and a bio oil furnace provide the sanitation tank with heat. The substrate is then pumped to a buffer tank and then into one of four continuously-stirred digesters, all operating in the mesophilic temperature range (37 °C). The mean retention time for the substrate in the digester is 25 days.
Figure 1 Flowchart for the Eskilstuna biogas plant
Table 2 Technical data for the Växtkraft biogas plant, Västerås for 2009
Sanitation
Suspension
buffer tank
Pre-‐
treatment
&
seperatio
Digester
Press
Gas dome
and
Upgrading
Flare
Reject
Digestate
Digestate
Process
water
Substrate
Biogas
Electricity
District heating
Condensate
Heat from burned oil
1
2
Cleaning
and dewatering
Sedimentation
Substrate
Substrate
Buffer
tank
Technical specification Value
Received amount of MSW 15300 tons/yr Received amount of grease trap sludge 2100 tons/yr Received amount of lay crop silage 2900 tons/yr Size of digester (one digester) 4000 m3
Raw biogas prod. 2.4 million m3/yr Estimated upgraded biogas prod. 1.3 million m3/yr
The raw gas contains 65% of methane, 35% of carbon dioxide and small amounts of sulphur dioxide and ammonia. The raw gas can be flared off or used in a gas furnace in case of emergencies or problems in the gas production line, in order to prevent methane escaping to the atmosphere. The gas is stored in a gas tank before entering the upgrading process where it is cleaned using water scrubbing. The upgraded biogas is used as a vehicle fuel for the local bus company and also available to the public at a gas station in Eskilstuna.
The substrate from the digester is pumped into a dewatering station where a flocculant is added to the substrate. The solid part of the substrate from the dewatering station is used to cover the landfill today. The flow chart for the process can be seen in Figure 1. Organic waste enter at (1) in the figure, sewage sludge at (2) and the rest of the substrates at (3).
Växtkraft biogas plant
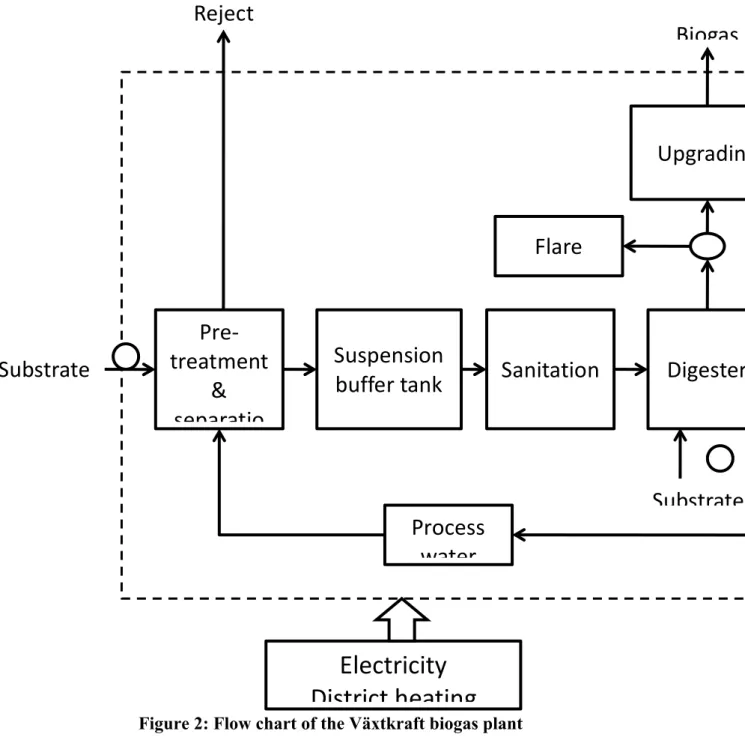
The Växtkraft biogas plant is located in Västerås, Sweden and it has been in operation since 2006. The plant co-digest source-sorted municipal solid waste from households and restaurants (1 in Figure 2), liquid organic waste (grease trap sludge) (1 in Figure 2) and lay crop silage (2 in Figure 2). Some statistics for the biogas plant can be seen in Table 2.
The organic municipal solid waste is, as shown in Table 2, the main substrate and it is brought with lorries from Västerås and the surrounding cities. This substrate first passes through a pre-treatment where materials like plastics, sand and metal, which are unsuitable for digestion, are separated. The separation is accomplished with the use of sieves, grates and sedimentation. The reject from the separation step is taken away and burnt. After the separation the substrate is mixed and water and the fat removal sludge are added to the process.
During the sanitation step the combined substrate is heated up to 70⁰C and kept at that temperature for one hour. After sanitation the combined substrate enters the digester, where it is digested under mesophilic conditions. The lay crop is crushed before entering the digester (2 in Figure 2). The raw biogas leaving the digester is sent to the upgrading plant, or in the case of unmanageable overproduction, is flared off in order to prevent methane escaping to the atmosphere. The digestate is centrifuged and divided into solid digestate and liquid digestate. From the liquid digestate the water is extracted and reused in the process. The digestate is then used as a fertilizer by local farmers. The upgraded biogas plant is used as a vehicle fuel for the local bus company and also available to the public at gas stations in the Västerås area. The annual amount of gas produced from the plant corresponds to about 2.3 million liters of ordinary fossil fuel based gasoline.
Figure 2: Flow chart of the Växtkraft biogas plant Method
The energy conversion efficiency of a system is the ratio between the useful energy output and the required energy input:
This expression was used for evaluating the energy performance of the biogas plants in Eskilstuna and Västerås. Two plants were chosen since it was considered that two plants would be sufficient for evaluation of the energy performance calculations. Since the two plants are feed with different substrates a broader perspective would be attained. The efficiencies was calculated for every month in the year 2009 to see if any seasonal variation could be found. To be able to make this evaluation real process data was collected for both plants. The system chosen for the study is the biogas plant itself. Entering the system is the substrates and auxiliary heat and power. The useful energy output of the system is the upgraded biogas. In cases in
Sanitation
Suspension
buffer tank
Pre-‐
treatment
&
separatio
Digester
Centrifugation
Upgrading
Flare
Digestate
Digestate
Process
water
Reject
Substrate
Biogas
Electricity
District heating
1
2
Substrate
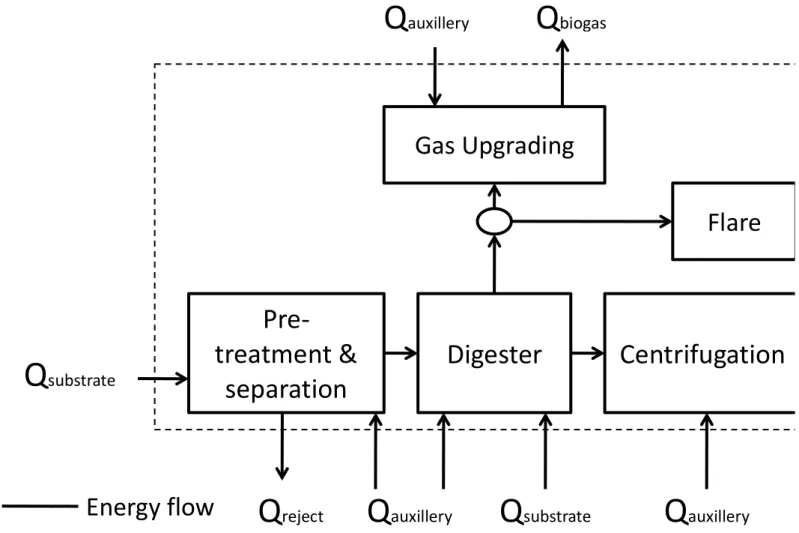
which the reject is utilized for heating/power purposes at another site this would also consist a useful energy output. The expression for energy conversion efficiency used in this study then becomes:
Where Qupgraded biogas is the energy content of the product gas delivered from the biogas plant,
determined either using higher or lower heating value or lower. Qsubstrate is the sum of the heat
content of the substrates. Qauxillary is the additional energy required by the process (heat and
electricity for pre-treatment, digester heating, sanitation, centrifugation, gas upgrading etc.). The system described is illustrated in Figure 3. Qflare in the figure is the heat lost when burning
the biogas in the safety flare, this energy is not considered a useful energy output.
Figure 3 Illustration of the system including energy flows
There is more than one way that Qsubstrate could be determined. One way is to determine Qsubstrate
by using the higher or lower heating value of the substrate (as it is done for fuel used in combustion and gasification processes). These values might not be available for all digestion substrates or they might be hard to determine for some substrates. An alternative way to determine Qsubstrate would then be to first determine the methane potential of the substrate and
then use the heating value of methane to calculate Qsubstrate.
In order to make the biogas production process comparable to other energy conversion processes the heating value should be used. The second method does not reflect the complete energy content of the substrate, since a part of the substrate might be combustible even though
Gas Upgrading
Flare
Centrifugation
Digester
Pre-‐
treatment &
separation
Q
substrateQ
substrateQ
biogasQ
auxilleryEnergy flow
Q
rejectQ
auxilleryQ
auxilleryit is not digestible. However, for comparison in-between biogas production plants it would be possible to use methane potentials.
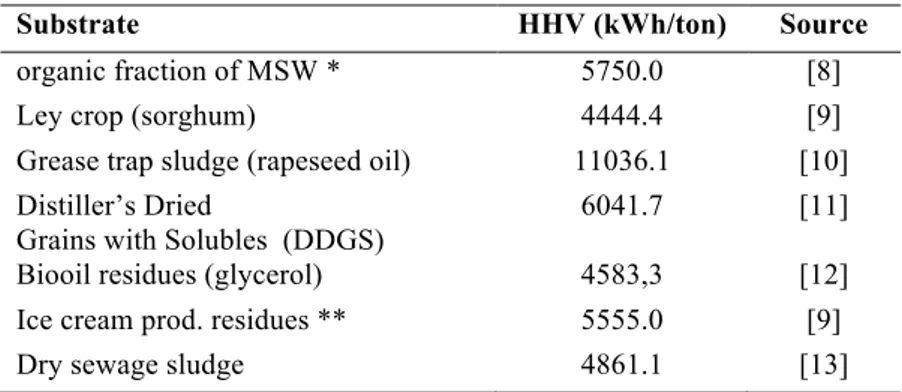
In this study we will therefore evaluate both methods and discuss the differences. For the energy value of the substrates, we used values found in literature and left measurements of the substrate for future studies. We used the higher heating value (HHV) for the caloric value of the feedstock and the values we used can be found in Table 3. In the case where the HHV for a particular substrate could not be found it was approximated by another substrate (in parenthesis in the table).
For DDGS and sewage sludge the values are given for a dry product therefore for these substrates the TS (total solids) flow was used for calculations. Rapeseed oil and glycerol have almost 100% TS while the grease trap sludge and the bio oil residues does not, therefore the TS flow was used also for these two substrates. For the sewage sludge entering the Eskilstuna biogas plant there is a lack of data, therefore the inflow of sludge had to be estimated using mass balance of the inflow from the other substrates and the digester output. The TS and oTS (organic total solids) were measured regularly for some substrates while for others the measurements were very infrequent or even non-existent. In both cases averages of the measured values available were used. When no values could be found, estimations were made in consultation with employees at the plant. In the case of the Växtkraft biogas plant, the oTs of the incoming substrate is measured regularly but the measurement point is past the point where the grease trap sludge is added. Therefore results from a study of the different flows in 2006 [14] were used instead.
Table 3 HHV for the studied substrates
Substrate HHV (kWh/ton) Source
organic fraction of MSW * 5750.0 [8]
Ley crop (sorghum) 4444.4 [9]
Grease trap sludge (rapeseed oil) 11036.1 [10] Distiller’s Dried
Grains with Solubles (DDGS)
6041.7 [11] Biooil residues (glycerol) 4583,3 [12] Ice cream prod. residues ** 5555.0 [9]
Dry sewage sludge 4861.1 [13]
*= calculated according to method in the source paper
**=no value could be found, therefore the value 20MJ/kg is assumed, as it has been reported as the average heating value for biomass in [9].
HHV for the organic fraction of MSW was calculated according to a method found in [8] and for those calculations the food waste was assumed to have the same composition as suggested in the source paper, see Table 4.
Table 4 Composition of food waste used for HHV calculations
Component Mass fraction
Moisture 75 Carbon 46.7 Hydrogen 8 Oxygen 38.88 Nitrogen 2.13 Sulfur 0.12 Ash 4.17
There were also some problems encountered when determining the heat and power consumption of the Eskilstuna biogas plant. The biogas process plant is attached to the sewage treatment plant and therefore not all power and heat consumed by the total plant is used for the biogas process. Therefore measurements of electricity consumption were made for the process steps for which the power and heat consumption was unknown. These steps were the dewatering and pumping of incoming sewage sludge, digester stirring, dewatering of digestate, hygenisation and initial pre-treatment of incoming organic MSW. For all steps except organic MSW initial pre-treatment, an average daily consumption was then calculated. For the initial pre-treatment of organic MSW, measurements had been made during October 2010. Those measurements were used to calculate energy use per mass unit processed.
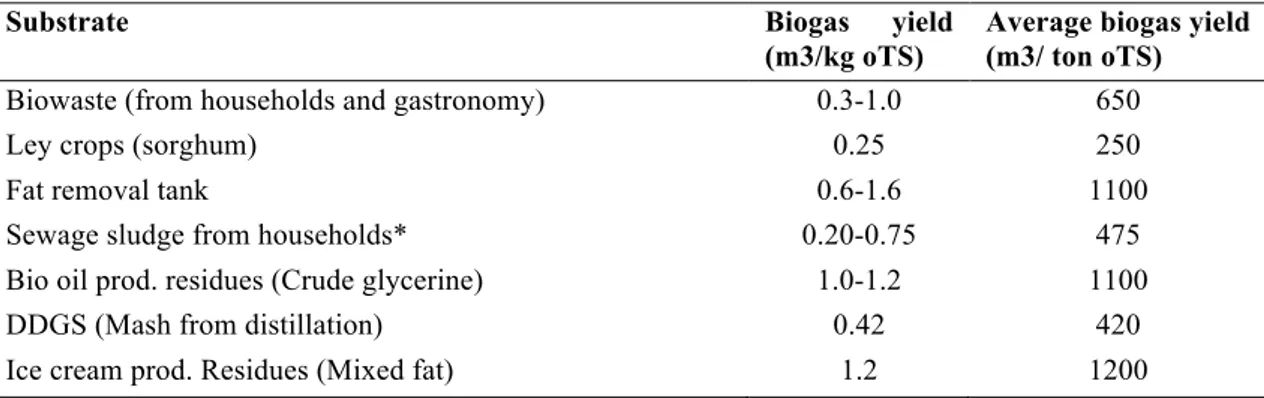
For the calculations based on methane potential, literature values for the methane potential of the different substrates were used. For those substrates for which no value could be found in literature, the literature value for a similar substrate was used. The substrate inflow used was the substrate flow after initial pre-treatment since it was the most well-documented for both plants. Since the substrate has been mixed with water at that stage, the oTS flow was used for the calculations instead of the mass flow. The methane potential values used can be found in Table 5. The values in the table are from [19] and the average is calculated from the range given in the source. In the cases in which a substrate could not be found it was approximated by another (given in parenthesis in the table). To get the energy contents of the substrate the methane potential was multiplied with the heating value of methane. The heating value used for methane was 11.06 kWh/m3.
Table 5 The methane potential used for the substrates considered in this study
Substrate Biogas yield
(m3/kg oTS)
Average biogas yield (m3/ ton oTS)
Biowaste (from households and gastronomy) 0.3-1.0 650
Ley crops (sorghum) 0.25 250
Fat removal tank 0.6-1.6 1100
Sewage sludge from households* 0.20-0.75 475
Bio oil prod. residues (Crude glycerine) 1.0-1.2 1100
DDGS (Mash from distillation) 0.42 420
Ice cream prod. Residues (Mixed fat) 1.2 1200
*= No oTS per TS (%) was given in the reference, therefore it was assumed that all TS was organic
The difference in the results for the two biogas plants was then evaluated by comparison. The variation of the efficiency during the year was also investigated.
Results
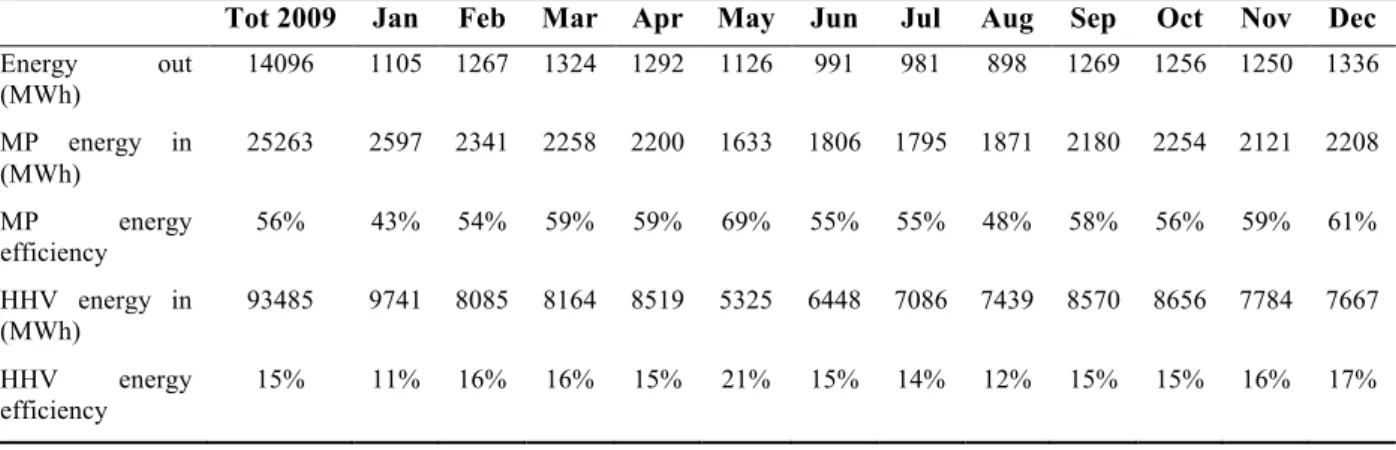
The energy output was calculated by considering the methane content in the produced gas (other gases was disregarded). The energy input was calculated for the two different methods as well as the energy conversion efficiency, as can be seen in Table 6 (for the Eskilstuna biogas plant) and Table 7 (for the Växtkraft biogas plant). HHV in the table is calculations using heating values and MP is using methane potential.
Table 6 The energy input and output as calculated by the two different methods for Eskilstuna biogas plant
Output (MWh) 9853 778 827 886 876 851 905 803 900 914 795 648 673 MP input (MWh) 19060 1696 1555 1444 1558 1384 1631 1448 1626 1455 1512 1515 1617 MP efficiency 52% 46% 53% 61% 56% 61% 56% 55% 55% 63% 53% 43% 42% HHV input (MWh) 40755 3708 3301 3325 3946 3028 3258 3248 3279 3226 3505 3197 3735 HHV efficiency 24% 21% 25% 27% 22% 28% 28% 25% 27% 28% 23% 20% 18%
Figure 4 Energy efficiency for the Eskilstuna biogas plant, calculated based on substrate HHV values (HHV) and on substrate methane potential values (MP)
Table 7 The energy input and output as calculated by the two different methods for Växtkraft biogas plant
Tot 2009 Jan Feb Mar Apr May Jun Jul Aug Sep Oct Nov Dec
Energy out (MWh) 14096 1105 1267 1324 1292 1126 991 981 898 1269 1256 1250 1336 MP energy in (MWh) 25263 2597 2341 2258 2200 1633 1806 1795 1871 2180 2254 2121 2208 MP energy efficiency 56% 43% 54% 59% 59% 69% 55% 55% 48% 58% 56% 59% 61% HHV energy in (MWh) 93485 9741 8085 8164 8519 5325 6448 7086 7439 8570 8656 7784 7667 HHV energy efficiency 15% 11% 16% 16% 15% 21% 15% 14% 12% 15% 15% 16% 17% 0,0% 10,0% 20,0% 30,0% 40,0% 50,0% 60,0% 70,0%
Jan Feb Mar Apr May Jun Jul Aug Sep Oct Nov Dec
HHV MP
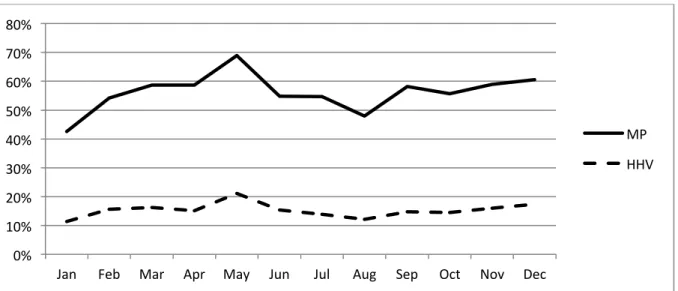
Figure 5 The energy efficiency for the Växtkraft biogas plant, calculated based on HHV values of the substrates (HHV) and on the methane potential for the substrates (MP)
Figure 6 The energy input divided into the different components for the Eskilstuna biogas plant
Figure 7 Energy input divided into components for the Växtkraft biogas plant
0% 10% 20% 30% 40% 50% 60% 70% 80%
Jan Feb Mar Apr May Jun Jul Aug Sep Oct Nov Dec
MP HHV 0 500 1000 1500 2000 2500 3000 3500 4000 4500
Jan Feb Mar Apr May Jun Jul Aug Sep Oct Nov Dec
Sum of all energy inputs
MSW Sewage sludge Grease trap sludge DDGS
Auxillery energy input
Bio oil residues Ice cream prod. residues [MWh] 0 2000 4000 6000 8000 10000 12000
Jan Feb Mar Apr May Jun Jul Aug Sep Oct Nov Dec
Sum of all energy inputs MSW Ley crop silage Auxillery energy input Grease trap sludge
The graphical comparison between the two different efficiencies for the two biogas plants can be found in Figure 4 (Eskilstuna biogas plant) and Figure 5 (Växkraft biogas plant) for each month of the year. As can be seen in the figures, the energy efficiency is not constant but varies over the year.
The variation over the year of the different energy inputs can be seen in Figure 6 (Eskilstuna) and Figure 7 (Växtkraft).
Discussion
No measurements were made on the HHV values for the different substrates. Instead literature values were used which creates some uncertainties in the results. The HHV of organic MSW was calculated using a method found in literature [8]. Only one study was found that gave a value for the HHV of the organic fraction of MSW [16]. In the study, the HHV for the organic fraction of MSW was found for Bangladesh trash to be 5907 kJ/kg in 2007 and US trash 4652 kJ/kg in 1977. No other higher heating values were found for the organic fraction. It is possible that neither the Bangladesh trash nor the US trash is representative for Swedish trash but it is reasonable to believe that they should at least be in the same order of size. The calculated value used in this study is somewhere in-between these two values which indicate that it is reasonable as discussed below.
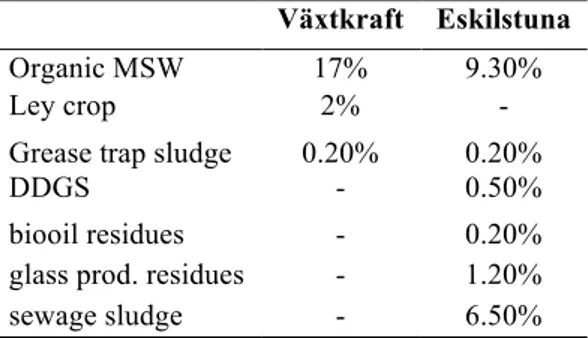
To test the sensitivity to errors in the HHV values, each HHV value was in turn increased with 20% and the percentage change of the efficiency was studied, see Table 8. The efficiency for Växtkraft biogas plant was quite sensitive to changes in the HHV for the MSW, a 20% increase in the HHV lead to an almost equal change in efficiency. Since organic MSW is the main substrate for Växtkraft this could be expected. The influence of the HHV value for MSW for Eskilstuna was also quite large. Otherwise changes in the HHV for the other substrates had little influence on the efficiency. However, to receive more accurate results, measurements of the HHV of the substrates used at the studied plant should be made. Or, if the efficiency is to be calculated based on methane potential, the methane potential should be studied for the specific substrate used. Another possible source of errors was the uncertainty in the oTS percentage for the different substrates. For some of the substrates the oTS was measured very seldom or not at all, which influences the accuracy of the result.
Table 8 Average percentage decrease in efficiency
Växtkraft Eskilstuna
Organic MSW 17% 9.30%
Ley crop 2% -
Grease trap sludge 0.20% 0.20%
DDGS - 0.50%
biooil residues - 0.20% glass prod. residues - 1.20%
sewage sludge - 6.50%
The total energy inputs of the two plants are less influenced by the power and heat consumption and more influenced by the substrate energy input (see Figure 6 and Figure 7). There are uncertainties in the measurement of heat and power consumption but the heat and power consumption would have to be doubled several times before they have any greater impact on the efficiency. Therefore the greatest loss is unconverted energy in the substrates. It is especially true in the case of the Växtkraft biogas plant which utilizes organic MSW as the main substrate, and almost all energy input comes from the organic MSW. It shows that the efficiency improvement of the biogas plant shall mainly focus on improving the anaerobic
digestion of the different substrates, for example improved pre-treatment, adding nutrients or investigating possible inhibitions or other methods discussed for improved biogas production. Furthermore, it can be observed that there are quite large variations in efficiency over the year studied. It is quite difficult to distinguish any common seasonal pattern for the two biogas plants other than that they both seem to have one peak in May. It can be observed that the biogas/energy output is quite even over the year while energy input varies, which means that the peaks in efficiency corresponds to dips in energy input and vice versa. One possible explanation is that the substrate is not digested instantaneously, which means that substrate entering the digester one month can yield biogas also the next month. However, when a correction factor was calculated to account for digestion time and applied, some dips was lessened a bit and shifted but not all and the correction factor overall had no greater effect. Another possible reason is that the digesters are overfeed at the times when the substrate input peaks, leading to a decrease in produced biogas per kg substrate. It could also be of interest to look for variations in other factors such as digester temperature. If it varies in a similar pattern it could also be a cause to variations in the efficiency. Furthermore there could also be unknown factors causing the effect.
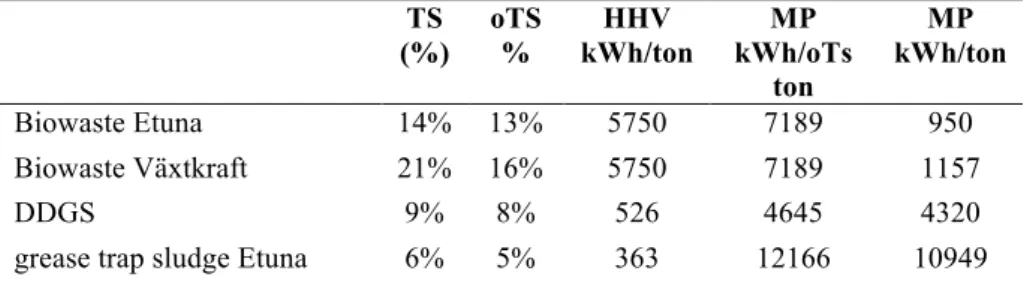
If the use of the methane potential for calculating the energy content of the substrate is compared to using the HHV, the MP method gives an efficiency that is more than twice as high as the HHV method. One reason for this is that in a combustion or gasification process materials that cannot be digested could be utilized and yield additional energy to the output. Furthermore, in this study methane potentials for individual substrates were used even though it is possible that a larger methane production can be achieved when they are co-digested. Therefore just considering the methane potential of the substrates does not consider the complete energy opportunity of the material. However since it is easier to find methane potentials for substrates than it is to find HHVs the MP method can be utilized when no HHVs can be found for the substrates as long as the difference in efficiency results is kept in mind. If the efficiency of the two biogas plants is compared, the Eskilstuna biogas plant has in general a higher efficiency according to this study when HHV is used for the substrates. However, it should be observed that the difference in efficiency between the biogas plants is somewhat sensitive to changes in the HHV value of the organic MSW since a change in the HHV for organic MSW would lead to a much greater change in the efficiency for the Växtkraft biogas plant than it would in the efficiency for the Eskilstuna biogas plant. Furthermore, when efficiency was calculated according to the MP method, Växtkraft had a higher efficiency. The reason that none of the plants has a higher efficiency according to both the MP and the HHV method is that the heat content value of the substrates does not follow the same pattern in the two methods. One example is that grease trap sludge has the lowest heat content in the HHV calculations but one of the highest in the MP calculations, see Table 9. This could be due to the uncertainties in the values as previously mentioned. Another factor is that the MP value is dependent on how digestible the material is. A material could be hard to digest and give little methane but when combusted give more heat than a more digestible material. To determine which biogas plant is more efficient further study is needed of the heat content and oTS of the substrates.
Table 9 Comparison of heating values used in HHV method and in MP method
TS (%) oTS % HHV kWh/ton MP kWh/oTs ton MP kWh/ton Biowaste Etuna 14% 13% 5750 7189 950 Biowaste Växtkraft 21% 16% 5750 7189 1157 DDGS 9% 8% 526 4645 4320
grease trap sludge Växtkraft 4% 4% 251 12166 12371 ice cream prod. residues 15% 14% 5555 13272 1792
ley crops 38% 34% 1675 2765 940
sewage sludge 6% 4% 292 5254 3678
*= Ts was used in HHV calculations, therefore HHV has here been corrected for TS Conclusions
Calculation of energy efficiency is a tool which could be used for evaluation of biogas plant performance. It could be used for identifying points in time in which production problems arise and with further studies these problems could perhaps be taken care of to increase biogas production. It could also be used to compare biogas plants to find the one which operate with greatest efficiency. Furthermore, it would be possible to compare biogas plants with other types of plants such as gasification and combustion plants in the terms of energy conversion efficiency if the HHV is employed for calculation of the energy input from the substrates. Calculation of the efficiency for two real biogas plants in Sweden show that the efficiency varies during the year and that it is mostly influenced by the substrate. The reasons for the variations are not obvious and need to be further studied.
Nomenclature
DDGS: Dried Distiller’s Grains with Solubles HHV: Higher heating value [kWh/ton]
MSW: Municipal organic waste η : efficiency [%]
oTS: organic total solids [tons]
Qauxillery : Energy entering the system in the form of heat or power, e.g. district heating and
electricity [MWh]
Qflare : Energy lost when biogas burned in safety flare [MWh]
Qreject : Energy of reject [MWh]
Qsubstrate : Energy of substrate entering the system [MWh]
Qupgraded biogas : Energy of the methane part of the biogas leaving the system [MWh]
TS: total solids [tons] References
[1] Banks, C.J., Chesshire M., Heaven, S., 2011, “Anaerobic digestion of source-segregated domestic food waste: Performance assessment by mass and energy balance”, Bioresource Technology, Vol 102, No 2, pp. 612-620.
[2] Pöschl, M., Ward, S., Owende P., 2010, “Evaluation of energy efficiency of various biogas production and utilization pathways. Applied Energy, Vol 87, No 11, pp. 3305-3321.
[3] Madlener, R., Antunes C.H., Dias L.C., 2009, “Assessing the performance of biogas plants with multi-criteria and data envelopment analysis”. European Journal of Operational Research, Vol 197, No 3, pp. 1084-1094.
[4] Cline, T., Thomas, N., Shumway, L., Yeung, I., Hansen, C.L., Hansen, L.D., Hansen, J.C., 2010,“Method for evaluating anaerobic digester performance”. Bioresource Technology, Vol 101, No 22, pp. 8623-8626.
[5] Fredriksson, H., Baky, A., Bernesson, S., Nordberg, A., Norén, O., Hansson, P.A., 2006, “Use of on-farm produced biofuels on organic farms -Evaluation of energy balances and environmental loads for three possible fuels”, Agricultural Systems, Vol 89, No 1, pp. 184-203. [6] Klimiuk, E., Pokój, T., Budzynski, W., Dubis, B., 2010, “Theoretical and observed biogas production from plant biomass of different fibre contents”, Bioresource Technology, Vol 101, No 24, pp. 9527-9535.
[7] Börjesson, P., Berglund, M., 2006, “Environmental systems analysis of biogas systems--Part I: Fuel-cycle emissions”, Biomass and Bioenergy, Vol 30, No 5, pp. 469-485.
[8] Magrinho, A., Semiao V., 2008, “Estimation of residual MSW heating value as a function of waste component recycling”, Waste management, Vol 28, No 12, pp. 2675-2683.
[9] González, J.F., González-García, C.M., Ramiro, A., Gañán, J., Ayuso, A., Turegano, J., 2006, “Use of energy crops for domestic heating with a mural boiler”, Fuel Processing Technology, Vol 87, No 8, pp. 717-726.
[10] Demirbas, A., 1998, “Fuel properties and calculation of higher heating values of vegetable oils”, Fuel, Vol 77, No 9-10, pp. 1117-1120.
[11] De Kam, M.J., Morey R.V., Tiffany D.G., 2009, “Biomass Integrated Gasification Combined Cycle for heat and power at ethanol plants”, Energy Conversion and Management, Vol 50, No 7, pp. 1682-1690.
[12] Strömberg, B., 2009, ’Förbränning av glycerol -huvudbränsle, sameldning eller additiv’ [eng. Combustion of glycerol – main fuel, co-combustion or additive], TPS Branschforskningsprogram för Energiverk, http://www.svenskfjarrvarme.se/Rapporter--Dokument/Rapporter_och_Dokument/FoU-rapporter/TPS/ [in Swedish]
[13] Midilli, A., Dogru, M., Howarth, C.R., Ling, M.J., Ayhan, T., 2001, “Combustible gas production from sewage sludge with a downdraft gasifier”, Energy Conversion and Management, Vol 42, No 2, pp. 157-172.
[14] Weiland P., Ahrens, T., 2006, “Demonstration of an optimized production system for biogas from biological waste and agricultural feedstock – Final Report”. Federal Agricultural Research Cenre of Germany, July 2006.
[15] Deublein, D., Steinhauser, A., 2011, “Biogas from Waste and Renewable Resources”, 2nd Ed., Weinheim: WILEY-VCH.
[16] Alamgir, M., Ahsan A., 2007, “Characterization of MSW and nutrient contents of organic component in Bangladesh”, Electronic Journal of Environmental, Agricultural and Food Chemistry, Vol 4, No 6, pp. 1945-1956.
Acknowledgments
This study was part-funded by the European Union (European Regional Development Fund) through the project Regional Mobilizing of Sustainable Waste-to-Energy Production (REMOWE) which is a part of the Baltic Sea Region programme, as well as by the Knowledge Foundation through the BioGasOpt project.